. 2020 Dec 29;6(1):97.
doi: 10.1038/s41421-020-00219-0.

Single-cell RNA sequencing reveals regulation of fetal ovary development in the monkey (Macaca fascicularis)

Affiliations

Single-cell RNA sequencing reveals regulation of fetal ovary development in the monkey (Macaca fascicularis)

Zheng-Hui Zhao et al. Cell Discov. .

Abstract

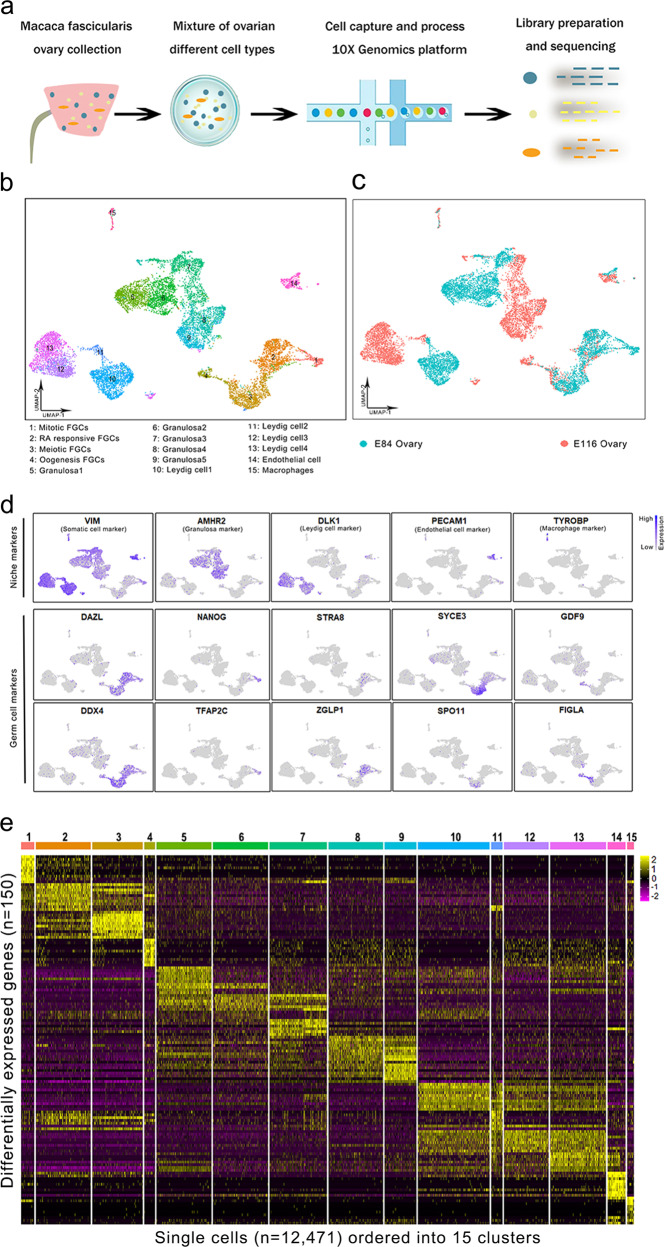
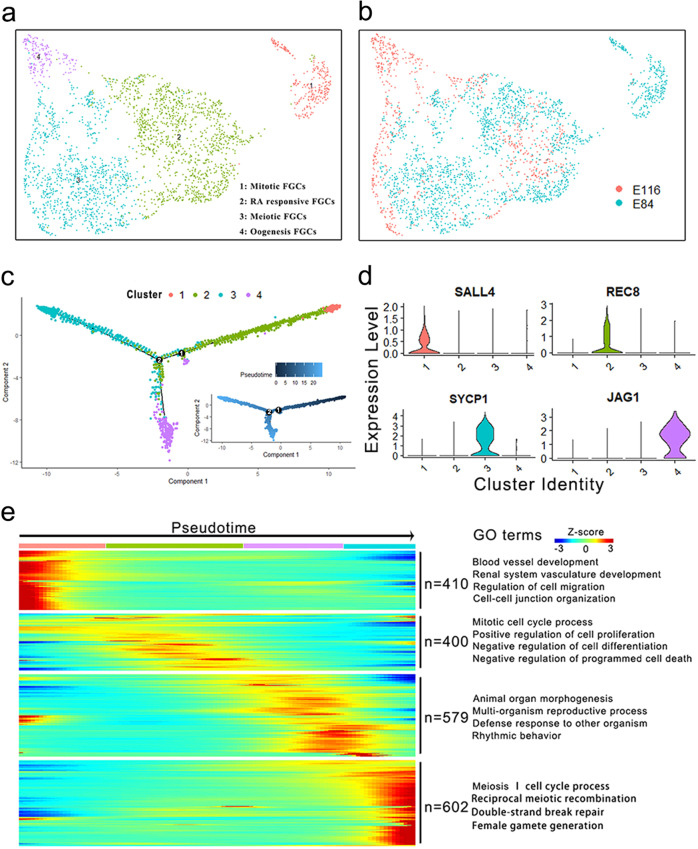
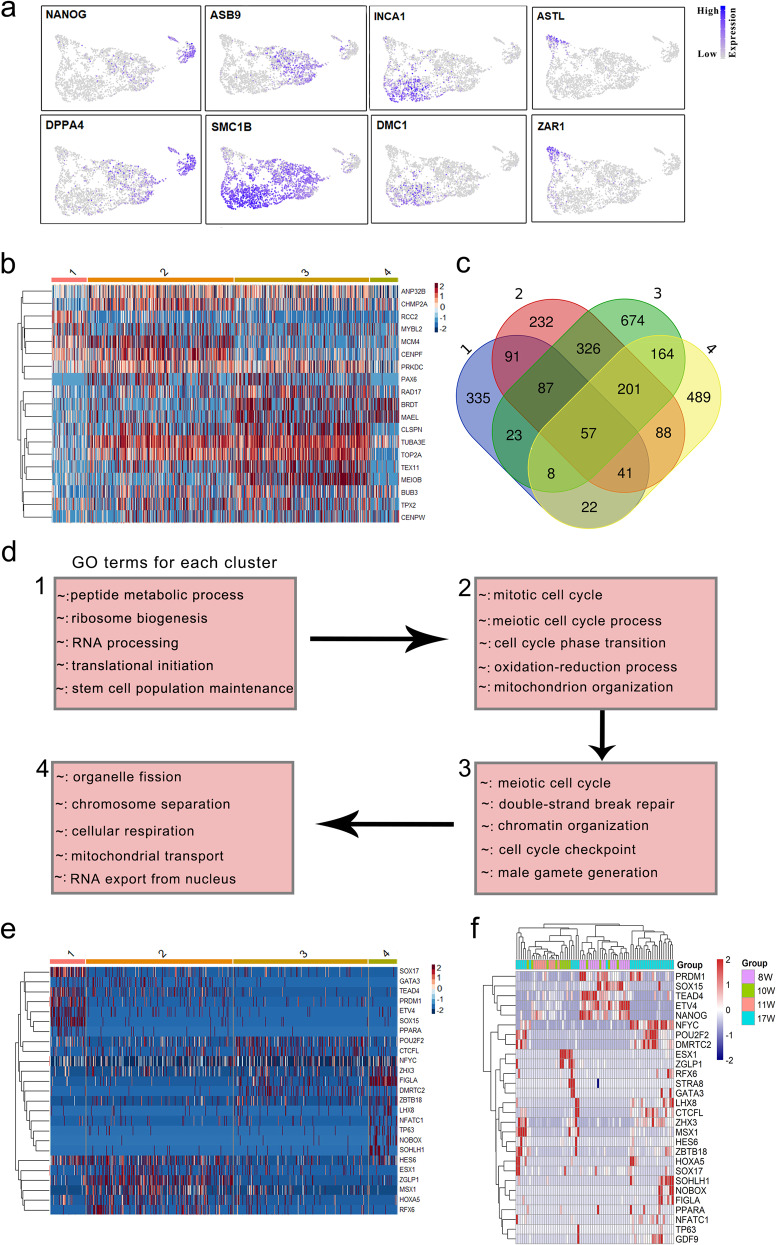
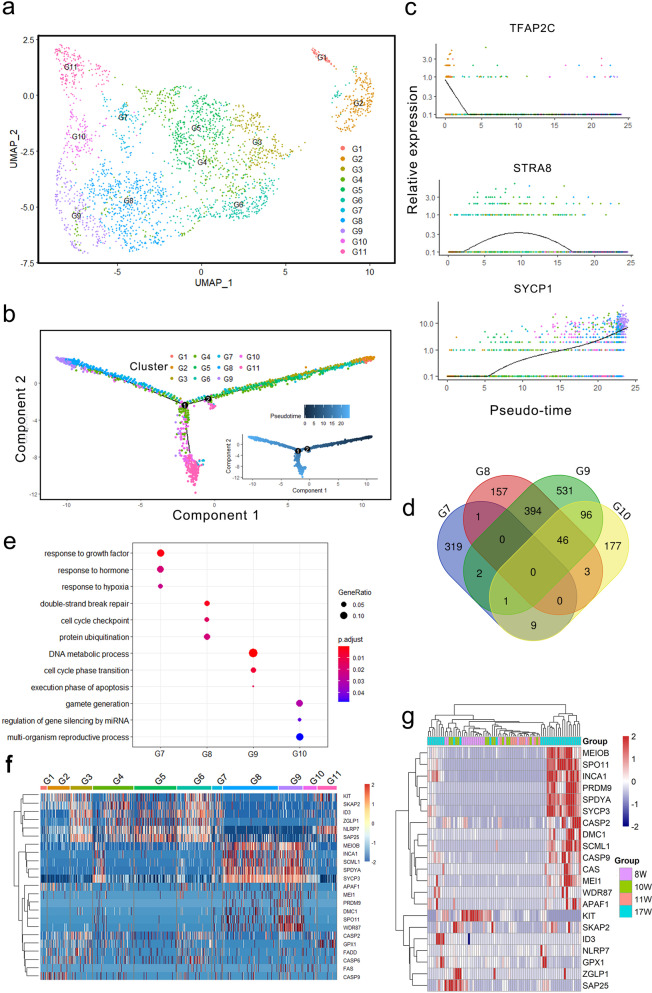
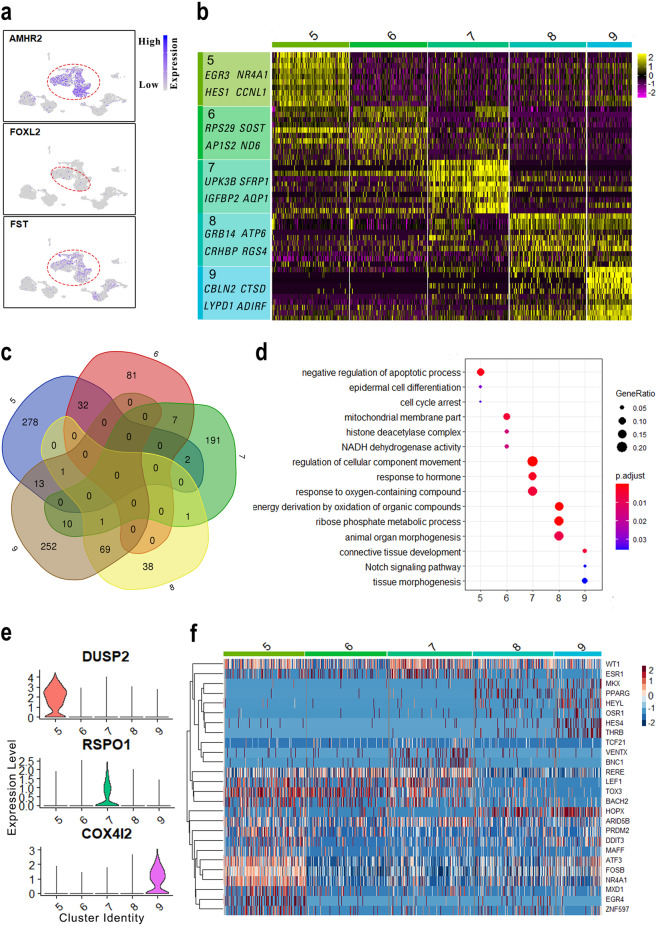
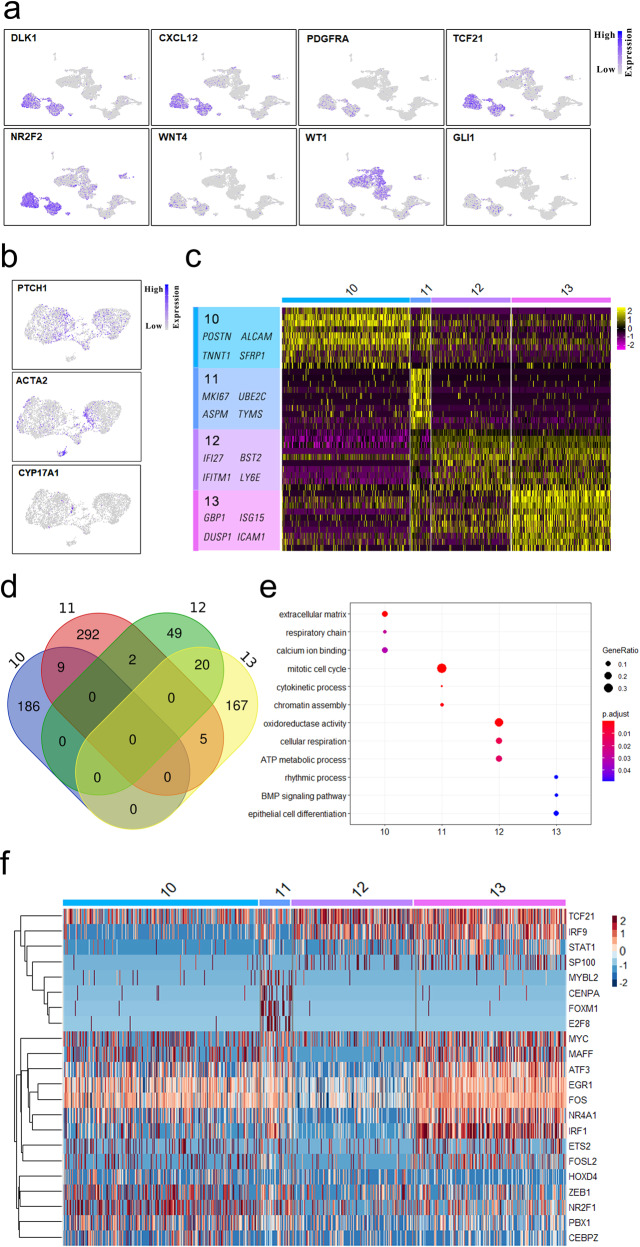
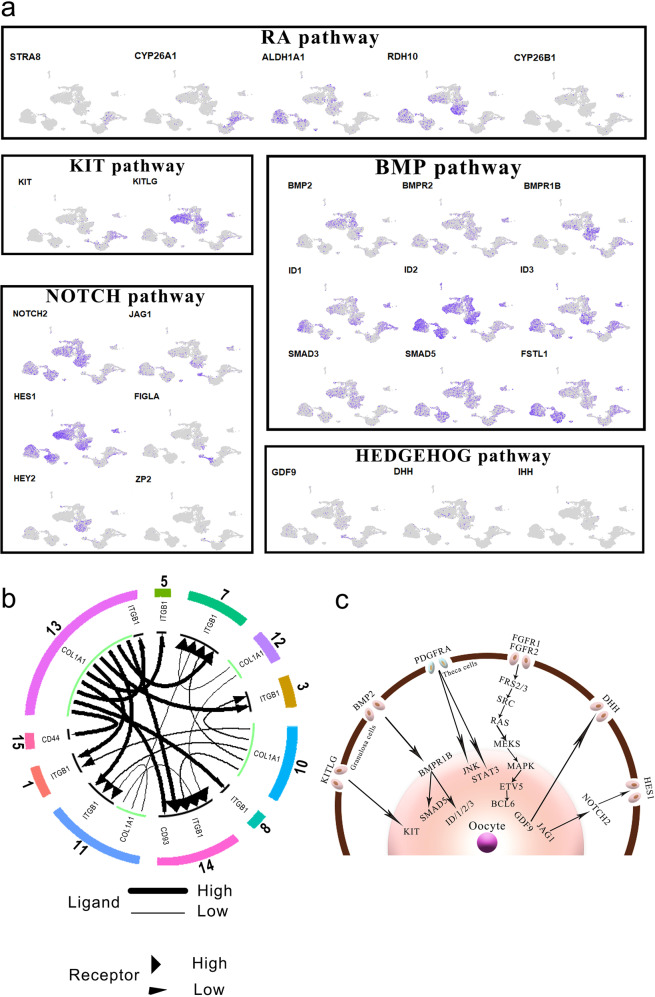
Germ cells are vital for reproduction and heredity. However, the mechanisms underlying female germ cell development in primates, especially in late embryonic stages, remain elusive. Here, we performed single-cell RNA sequencing of 12,471 cells from whole fetal ovaries, and explored the communications between germ cells and niche cells. We depicted the two waves of oogenesis at single-cell resolution and demonstrated that progenitor theca cells exhibit similar characteristics to Leydig cells in fetal monkey ovaries. Notably, we found that ZGLP1 displays differentially expressed patterns between mouse and monkey, which is not overlapped with NANOG in monkey germ cells, suggesting its role in meiosis entry but not in activating oogenic program in primates. Furthermore, the majority of germ cell clusters that sharply express PRDM9 and SPO11 might undergo apoptosis after cyst breakdown, leading to germ cell attrition. Overall, our work provides new insights into the molecular and cellular basis of primate fetal ovary development at single-cell resolution.


Conflict of interest statement

The authors declare that they have no conflict of interest.

Figures

Fig. 1
Fig. 1. Single-cell transcriptome profiling of fetal monkey ovaries.
a Schematic diagram of the experimental design. In total, fetal ovaries were collected from E84 and E116 monkey fetus and further enzymatically digested into single-cell suspension, which were then captured using 10× Genomics technology. The libraries of single-cell transcriptome were generated using the single-cell 3′ reagent V3 kits according to the manufacturer’s protocol. b UMAP and clustering analysis of single-cell transcriptome data from fetal monkey ovaries. The 15 clusters were assigned and colored as indicated on the figure key. c UMAP plot of single-cell transcriptome data with cells colored based on their embryonic stages. d Expression patterns of selected markers for the identification of cell clusters. Blue indicates high expression and gray indicates low or no expression, as shown on the figure key. e Heatmap showing top 10 differentially expressed genes across 15 cell clusters, and 12,471 single cells were visualized.
Fig. 2
Fig. 2. Cell lineage reconstruction and identification of the germ cells.
a Isolation and re-clustering of the germ cell populations at a higher resolution. The assigned clusters are consistent with that in Fig. 1b. b UMAP plot of single-cell transcriptome data with germ cells colored based on their embryonic stages. c Pseudotime analysis of germ cells. Cluster 1 represents the start of pseudotime, with cluster 4 at the end. d Violin plots show the expression patterns of marker genes during oogenesis. e Hierarchical clustering of the ordering genes during early oogenesis. Each row represents an ordering gene, and each column represents a single germ cell. The GO terms of clustered ordering genes are listed on the right.
Fig. 3
Fig. 3. Mitosis to meiosis transition and meiosis progression.
a Expression patterns of germ cell development-associated genes. b Hierarchical clustering of differentially expressed mitotic and meiotic genes across female germ cell clusters (clusters 1–4). c Overlap of differentially expressed genes across germ cell clusters. d Differentially expressed genes and associated GO categories characteristic of meiosis initiation and progression, based on the four germ cell clusters. e Heatmap representing the key transcription factors across monkey germ cell clusters. f Hierarchical clustering of the transcription factors and human female germ cells. Each row represents a transcription factor, and each column represents a single human female germ cell.
Fig. 4
Fig. 4. Female germ cell fate determination.
a Re-clustering of germ cells at a higher resolution. The 11 sub-clusters (G1–G11) were assigned and colored as indicated on the figure key. b Cell lineage reconstruction using monocle2. Sub-cluster G1 represents the start of pseudotime, with sub-cluster G11 at the end. c Dynamic expression of stage-specific genes along pseudotime. d Overlap of highly variable genes among G7–G10 sub-clusters. e GO analysis of differentially expressed genes in clusters G7–G10. f Heatmap representing the survival, apoptosis, and meiotic genes in monkey female germ cells. g Heatmap representing the survival, apoptosis, and meiotic genes in human female germ cells. Each row represents a gene, and each column represents a single human female germ cell.
Fig. 5
Fig. 5. Dynamic changes of granulosa cell transcriptomes.
a The expression of granulosa cell marker genes, with their expression projected onto the UMAP plot. b Heatmap showing representative marker genes of granulosa cell subpopulations (clusters 5–9). c Venn diagram shows overlapping of differentially expressed genes among granulosa cell populations. d The enriched GO terms (biological processes) to the subpopulations of the granulosa cells (clusters 5–9). e Violin plots show the specific expressed genes in different granulosa cell subpopulations. f Heatmap representing the dynamics of transcription factors across granulosa cell populations.
Fig. 6
Fig. 6. Dynamic changes of transcriptome in theca cells.
a UMAP cluster map showing expression of selected known marker genes for Leydig cells. b The expression patterns of theca cell-associated marker genes. c Heatmap showing representative differentially expressed genes across theca cell populations. d Venn diagram shows overlapping of differentially expressed genes among theca cell populations. e Top GO terms within the differentially expressed genes unique to the theca cells. f Hierarchical clustering of the critical transcription factors among theca cell subpopulations.
Fig. 7
Fig. 7. Signaling pathways for niche–germline interactions.
a Relative expression levels of marker genes from different key signaling pathways. b Cell–cell communication networks between different cell clusters. c Schematic summary of signaling pathways for niche–germline interactions.

Similar articles

Cited by

References

    1. Bullejos M, Koopman P. Germ cells enter meiosis in a rostro-caudal wave during development of the mouse ovary. Mol. Reprod. Dev. 2004;68:422–428. doi: 10.1002/mrd.20105. - DOI - PubMed
    1. Stévant, I. et al. Single-cell transcriptomics of the mouse gonadal soma reveals the establishment of sexual dimorphism in distinct cell lineages. https://www.biorxiv.org/content/10.1101/410407v1.full (2018). - DOI
    1. Evans EP, Ford CE, Lyon MF. Direct evidence of the capacity of the XY germ cell in the mouse to become an oocyte. Nature. 1977;267:430–431. doi: 10.1038/267430a0. - DOI - PubMed
    1. Li L, et al. Single-cell RNA-seq analysis maps development of human germline cells and gonadal niche interactions. Cell Stem Cell. 2017;20:891–892. doi: 10.1016/j.stem.2017.05.009. - DOI - PubMed
    1. Guo F, et al. The transcriptome and DNA methylome landscapes of human primordial germ cells. Cell. 2015;161:1437–1452. doi: 10.1016/j.cell.2015.05.015. - DOI - PubMed