. 2022 Apr;5(4):e1236.
doi: 10.1002/cnr2.1236. Epub 2020 Jan 29.

Leptomeningeal metastatic cells adopt two phenotypic states

Affiliations

Leptomeningeal metastatic cells adopt two phenotypic states

Jan Remsik et al. Cancer Rep (Hoboken). 2022 Apr.

Abstract

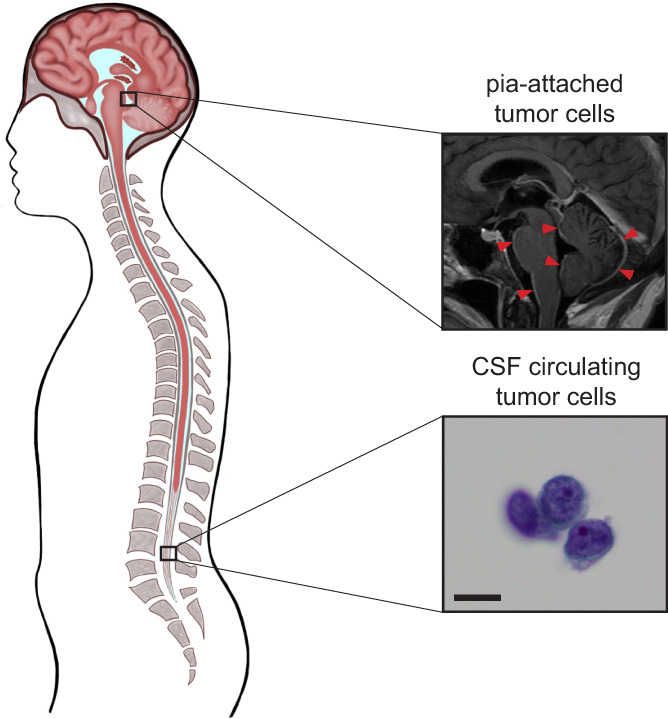
Background: Leptomeningeal metastasis (LM), or spread of cancer cells into the cerebrospinal fluid (CSF), is characterized by a rapid onset of debilitating neurological symptoms and markedly bleak prognosis. The lack of reproducible in vitro and in vivo models has prevented the development of novel, LM-specific therapies. Although LM allows for longitudinal sampling of floating cancer cells with a spinal tap, attempts to culture patient-derived leptomeningeal cancer cells have not been successful.

Aim: We, therefore, employ leptomeningeal derivatives of human breast and lung cancer cell lines that reproduce both floating and adherent phenotypes of human LM in vivo and in vitro.

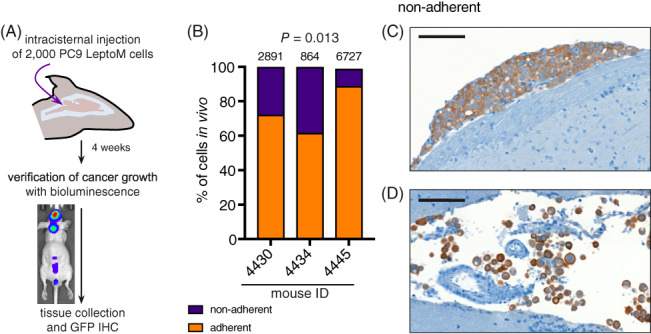
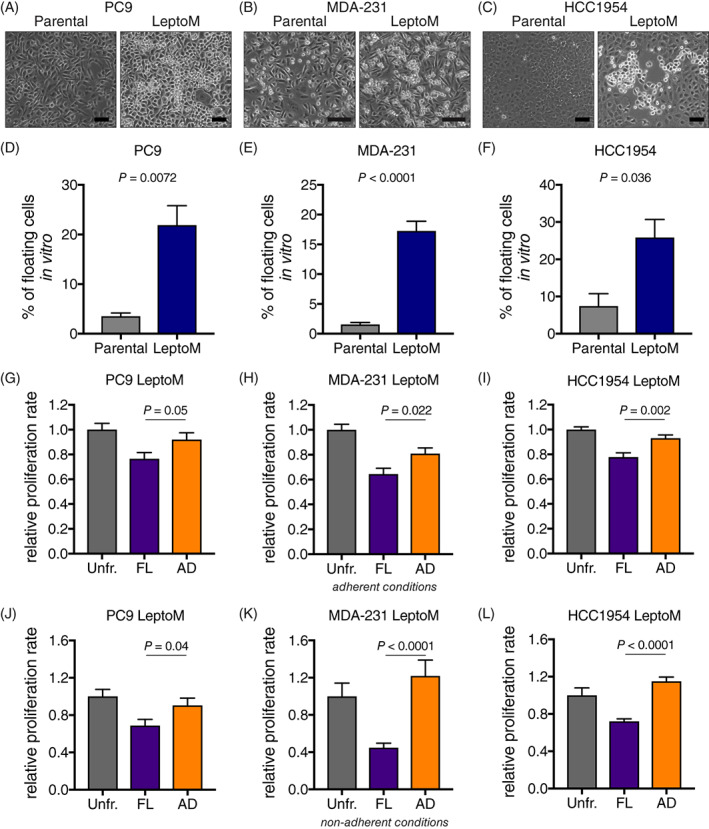
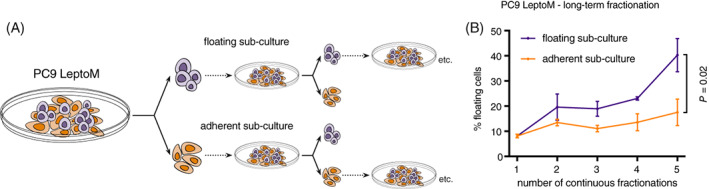
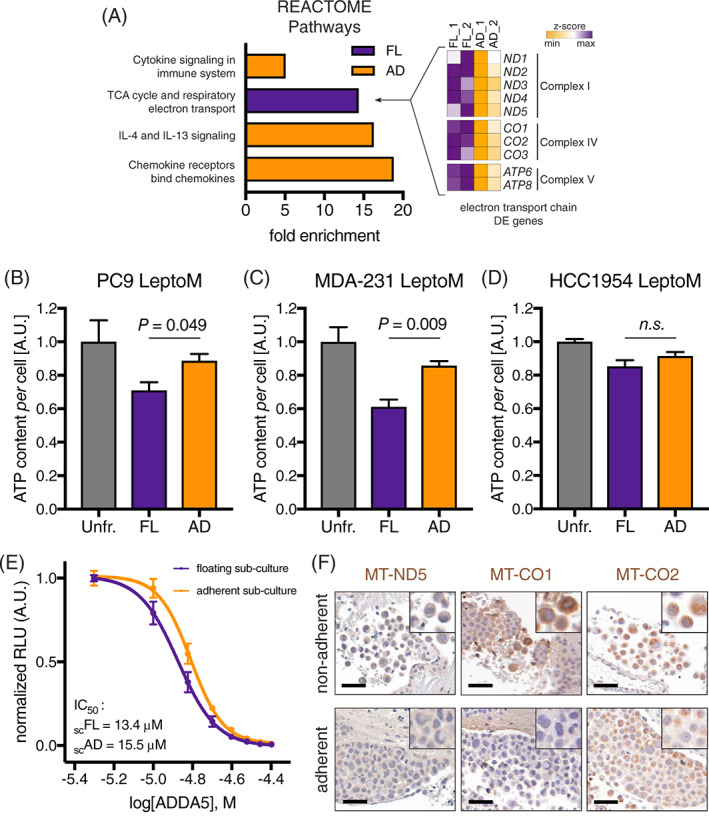
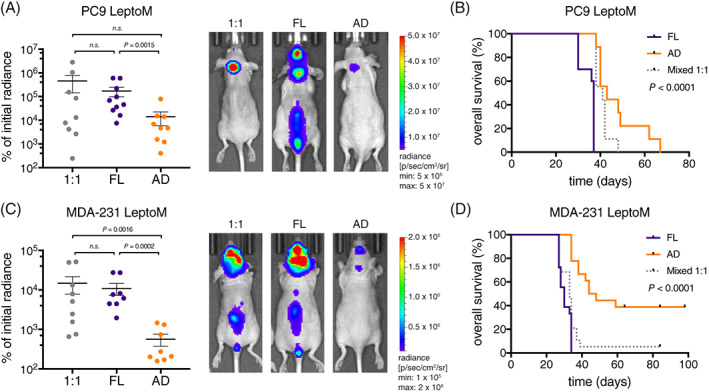
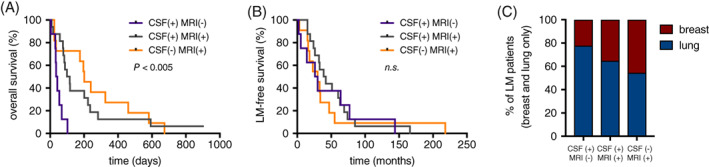
Methods and results: We introduce a trypsin/EDTA-based fractionation method to reliably separate the two cell subsets and demonstrate that in vitro cultured floating cells have decreased proliferation rate, lower ATP content, and are enriched in distinct metabolic signatures. Long-term fractionation and transcriptomic analysis suggest high degree plasticity between the two phenotypes in vitro. Floating cells colonize mouse leptomeninges more rapidly and associate with shortened survival. In addition, patients harboring LM diagnosed with CSF disease alone succumbed to the disease earlier than patients with adherent (MRI positive) disease.

Conclusion: Together, these data support mechanistic evidence of a metabolic adaptation that allows cancer cells to thrive in their natural environment but leads to death in vitro.

Keywords: cancer plasticity; cerebrospinal fluid; electron transport chain; leptomeningeal metastasis; metabolic adaptation.


Conflict of interest statement

Adrienne Boire has consulted for Arix Bioscience (2018), is on the Scientific Advisory Board for Evren Scientific (unpaid), and holds patent applications: 62/258044 and 62/052966. Other authors declare no conflict of interest.

Figures

FIGURE 1
FIGURE 1
The two distinct cancer cell phenotypes of human leptomeningeal metastastasis. A, Human leptomeningeal metastasis from solid cancer primary. White plaques of leptomeningeal metastasis (LM) around pons, brainstem, and cerebellum (red arrows), as visualized by gadolinium‐enhanced magnetic resonance imaging (MRI), and Giemsa‐stained cytospin of cerebrospinal fluid (CSF) showing the cluster of cancer cells (bottom, scale bar = 5 μm)
FIGURE 2
FIGURE 2
Mouse xenograft models of LM reproduce both phenotypes of human disease in vivo. A, Experimental schema. PC9 LeptoM cells expressing the TGL reporter were injected into the cisterna magna of athymic animals, and the tumor burden was monitored using noninvasive bioluminescence in vivo imaging weekly. The tissue was collected 4 weeks after injection and processed for immunohistochemistry. B, GFP‐expressing cancer cells in stained slides were counted using ImageJ and classified as “adherent” based on their tight adherence to pia mater or “nonadherent” based on their loose appearance. Portions of adherent and nonadherent cells were determined in four coronal brain sections in three animals, total number of counted cells per animal is shown above corresponding bars. C, Representative image shows adhered PC9 LeptoM cells (top) and freely floating cells and cellular clusters in vivo (bottom, scale bar = 200 μm)
FIGURE 3
FIGURE 3
Floating leptomeningeal cancer cells have decreased proliferation rate in vitro. A‐C, Phase contrast images show in vitro morphology of parental and LeptoM PC9 (A), MDA‐231 (B), and HCC1954 cells (C; scale bar = 200 μm). D‐F, Plots show the portion of floating cells in cell culture of parental and LeptoM PC9 (D), MDA‐231 (E), and HCC1954 cells (F). Results are from at least three independent experiments, and data represent mean ± SEM. Please refer to Figure S1A for trypsin fractionation overview. G‐I, Plots show the relative proliferation rate of fractionated and unfractionated LeptoM PC9 (G), MDA‐231 (H), and HCC1954 cells (I), 4 days after seeding to adherent conditions (standard tissue culture plates). Results are from at least three independent experiments and data represent mean ± SEM. J‐L, Plots show the relative proliferation rate of fractionated and unfractionated LeptoM PC9 (J), MDA‐231 (K), and HCC1954 cells (L), 9 days after seeding to nonadherent conditions (ultralow attachment plates). Results are from four independent experiments and data represent mean ± SEM
FIGURE 4
FIGURE 4
Continuous fractionation enriches for floating leptomeningeal cancer cells in vitro. A, Schema shows experimental strategy used for continuous fractionation. PC9 LeptoM cells were fractionated, and depicted fractions were seeded back to the cell culture. Subcultures were then again fractionated before reaching the confluency, and depicted fractions were seeded back to the cell culture. B, Plot shows the percentage of floating PC9 LeptoM cells in floating (violet) and adherent (orange) cell subcultures over the long‐term fractionation experiment, as described in (A). Results are from four independent experiments, and data represent mean ± SD
FIGURE 5
FIGURE 5
Transcriptomic analysis of floating leptomeningeal cancer cells reveals distinct metabolic adaptation. A, Plot shows significantly enriched REACTOME pathways in fractionated floating (FL) and adherent (AD) PC9 LeptoM cells (signature P < .01 and FDR < 0.01). Two independent samples per cell subset were sequenced. Differentially expressed genes related to the electron transport chain are plotted in the heatmap. B‐D, Plots show the per cell ATP content of fractionated and unfractionated LeptoM PC9 (B), MDA‐231 (C), and HCC1954 cells (D). Results are from at least three independent experiments, and data represent mean ± SEM. E, Plot shows the dose response of floating and adherent PC9 LeptoM subcultures to Complex IV poison ADDA5. Results are from three independent experiments, and data represent mean ± SEM. F, Representative images show expression of component of electron transport chain ND5, CO1 and CO2 in vivo, in adherent and nonadherent PC9 LeptoM cells (scale bar = 100 μm). Please also refer to Figure S3
FIGURE 6
FIGURE 6
Floating leptomeningeal cancer cells exhibit more aggressive phenotype in vivo. A, Tumor growth and representative BLI images of mice injected with fractionated floating (FL), adherent (AD), and mixed (1:1) PC9 LeptoM cells 4 weeks after injection, n = 9 to 10 per group. Results are from two independent experiments. Data represent mean ± SEM, Mann‐Whitney U test. Please also refer to Figure S3A,B. B, Kaplan‐Meier survival curve of mice groups shown in (A). Log‐rank test. C, Tumor growth and representative BLI images of mice injected with fractionated floating (FL), adherent (AD), and mixed (1:1) MDA‐231 LeptoM cells 3 weeks after injection, n = 8‐9 per group. Results are from three independent experiments. Data represent mean ± SEM, Mann‐Whitney U test. Please also refer to Figure S3A,C. D, Kaplan‐Meier survival curve of mice groups shown in (D). Log‐rank test
FIGURE 7
FIGURE 7
Floating leptomeningeal cancer cells represent lethal phenotype in lung and breast cancer patients. A, Kaplan‐Meier survival of lung and breast cancer patients initially diagnosed with CSF cytology alone (CSF +, MRI −, n = 8), MRI alone (CSF −, MRI +, n = 11), or both CSF and MRI (CSF +, MRI +, n = 16). B, Leptomeningeal metastasis‐free survival of patients shown in Figure 7A. C, Primary tumor type of patients shown in Figure 7A

References

    1. Beauchesne P. Intrathecal chemotherapy for treatment of leptomeningeal dissemination of metastatic tumours. Lancet Oncol. 2010;11:871‐879. 10.1016/S1470-2045(10)70034-6. - DOI - PubMed
    1. Glover RL, Brook AL, Welch MR. Teaching NeuroImages: leptomeningeal lung carcinoma. Neurology. 2014;82:e183‐e184. 10.1212/WNL.0000000000000455. - DOI - PubMed
    1. Kokkoris CP. Leptomeningeal carcinomatosis. How does cancer reach the pia‐arachnoid? Cancer. 1983;51:154‐160. - PubMed
    1. Boyle R, Thomas M, Adams JH. Diffuse involvement of the leptomeninges by tumour—a clinical and pathological study of 63 cases. Postgrad Med J. 1980;56:149‐158. 10.1136/pgmj.56.653.149. - DOI - PMC - PubMed
    1. Posner JB, Chernik NL. Intracranial metastases from systemic cancer. Adv Neurol. 1978;19:579‐592. - PubMed

Publication types

Substances