. 2021 Jan 21;29(22):3589-3605.
doi: 10.1093/hmg/ddaa243.

Mitochondria-lysosome membrane contacts are defective in GDAP1-related Charcot-Marie-Tooth disease

Affiliations

Mitochondria-lysosome membrane contacts are defective in GDAP1-related Charcot-Marie-Tooth disease

Lara Cantarero et al. Hum Mol Genet. .

Abstract

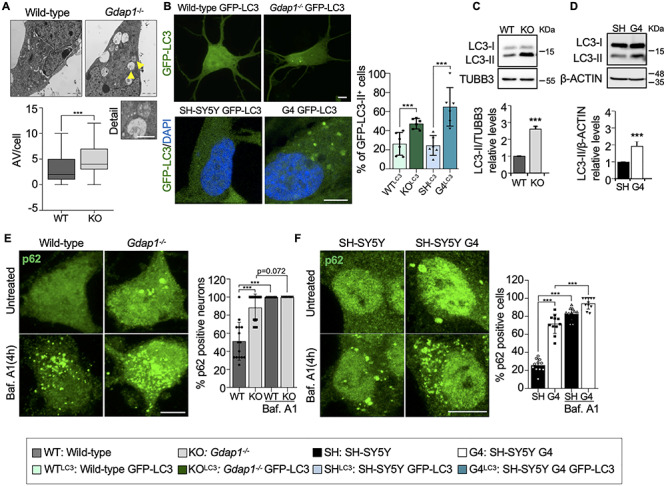
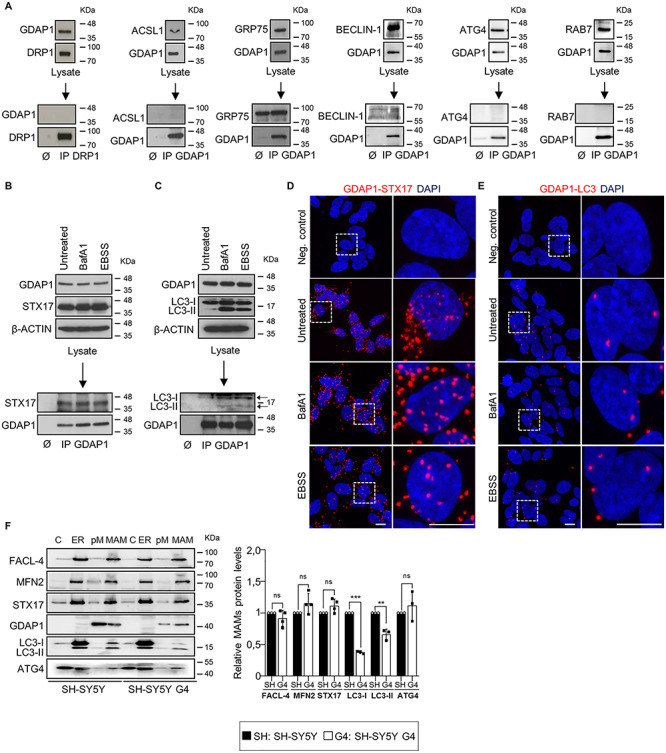
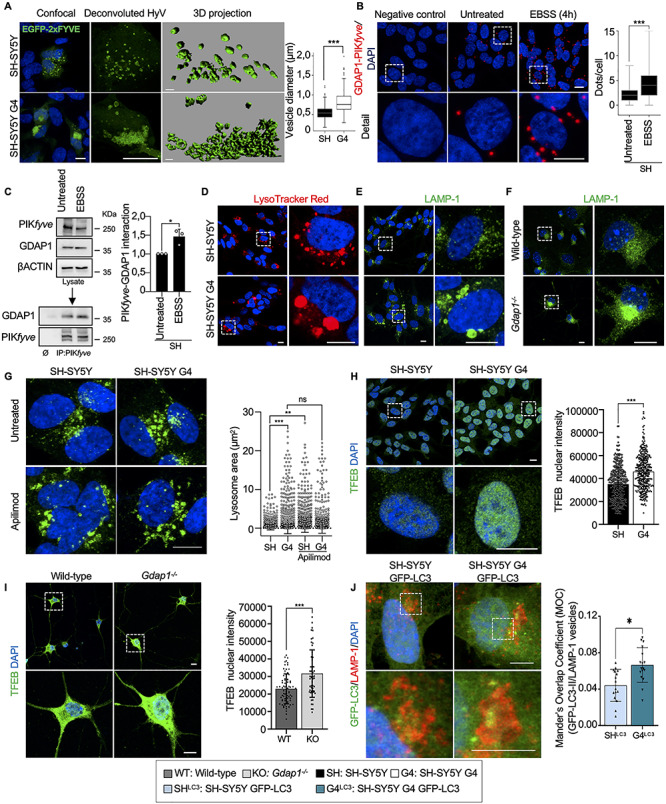
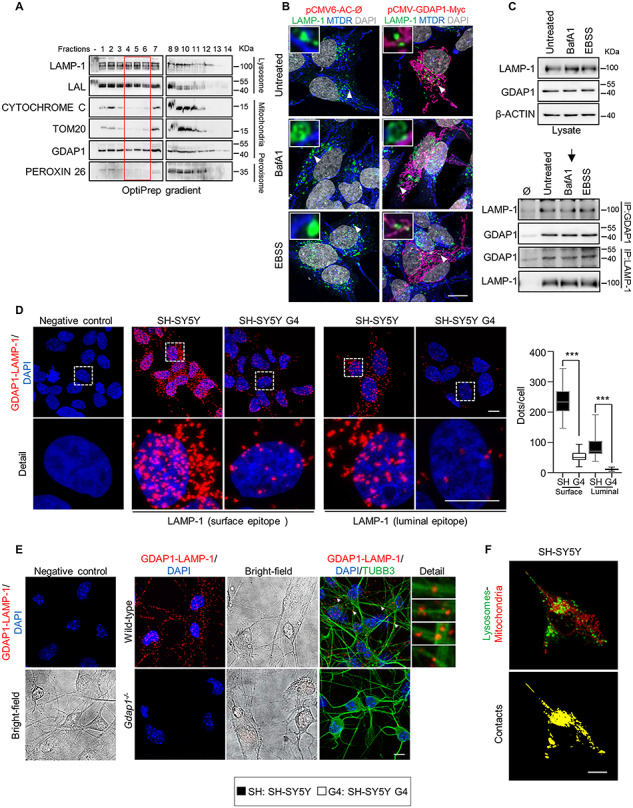
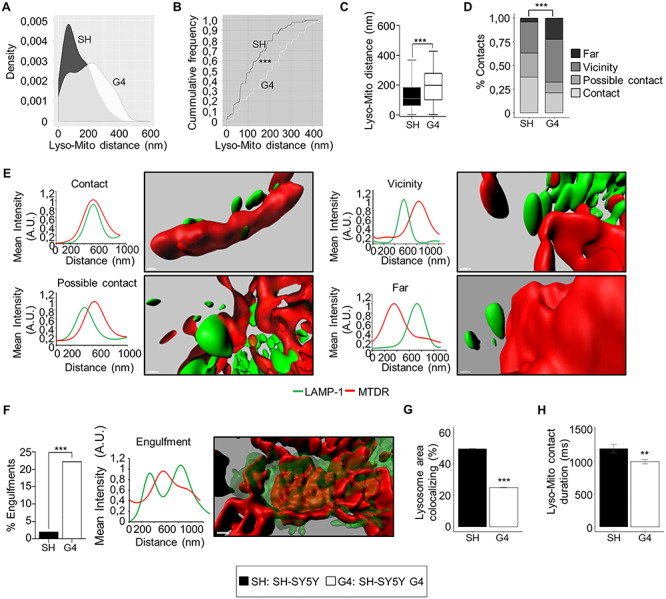
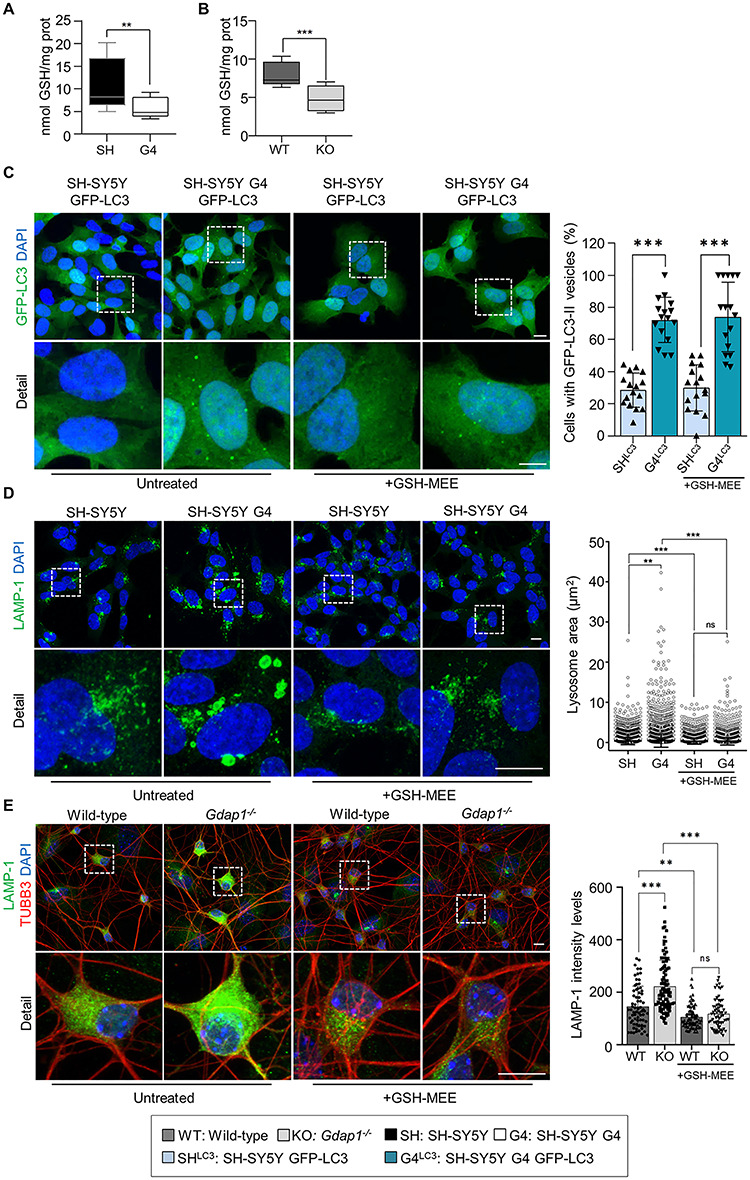
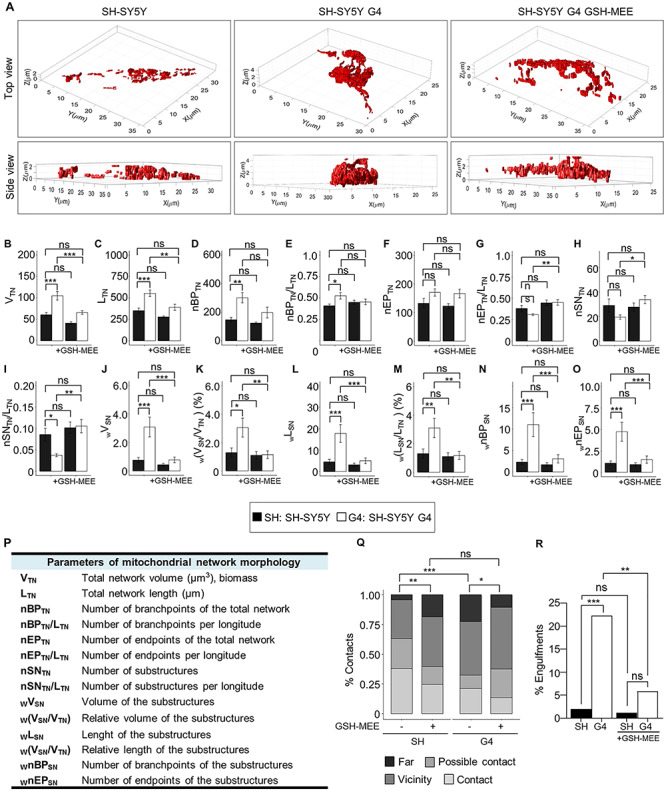
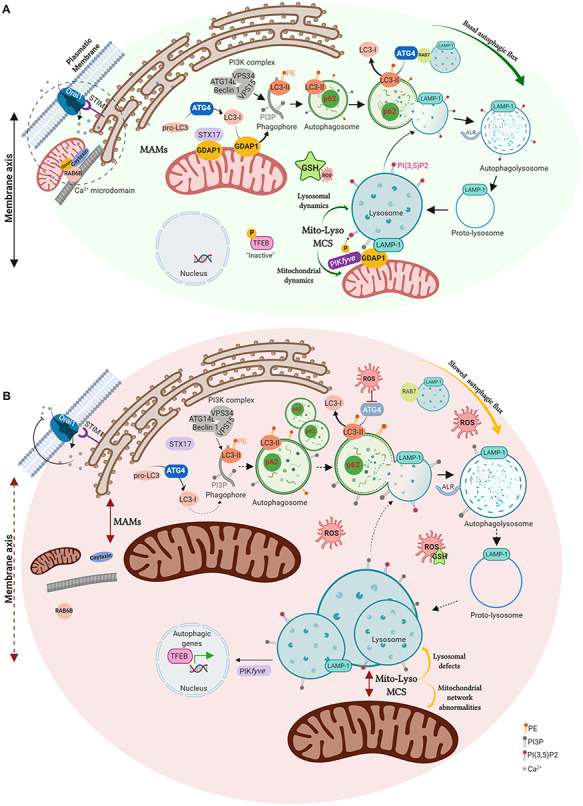
Mutations in the GDAP1 gene cause Charcot-Marie-Tooth (CMT) neuropathy. GDAP1 is an atypical glutathione S-transferase (GST) of the outer mitochondrial membrane and the mitochondrial membrane contacts with the endoplasmic reticulum (MAMs). Here, we investigate the role of this GST in the autophagic flux and the membrane contact sites (MCSs) between mitochondria and lysosomes in the cellular pathophysiology of GDAP1 deficiency. We demonstrate that GDAP1 participates in basal autophagy and that its depletion affects LC3 and PI3P biology in autophagosome biogenesis and membrane trafficking from MAMs. GDAP1 also contributes to the maturation of lysosome by interacting with PYKfyve kinase, a pH-dependent master lysosomal regulator. GDAP1 deficiency causes giant lysosomes with hydrolytic activity, a delay in the autophagic lysosome reformation, and TFEB activation. Notably, we found that GDAP1 interacts with LAMP-1, which supports that GDAP1-LAMP-1 is a new tethering pair of mitochondria and lysosome membrane contacts. We observed mitochondria-lysosome MCSs in soma and axons of cultured mouse embryonic motor neurons and human neuroblastoma cells. GDAP1 deficiency reduces the MCSs between these organelles, causes mitochondrial network abnormalities, and decreases levels of cellular glutathione (GSH). The supply of GSH-MEE suffices to rescue the lysosome membranes and the defects of the mitochondrial network, but not the interorganelle MCSs nor early autophagic events. Overall, we show that GDAP1 enables the proper function of mitochondrial MCSs in both degradative and nondegradative pathways, which could explain primary insults in GDAP1-related CMT pathophysiology, and highlights new redox-sensitive targets in axonopathies where mitochondria and lysosomes are involved.


Figures

Figure 1
Figure 1
GDAP1 deficiency produces an impairment of basal autophagy. (A) Representative electron microscopy images of two-day cultured eMNs and box-plot of the autophagic vesicles (AV, yellow arrows) per cell (number of neurons: wild-type = 31, Gdap1−/− = 48). The analysis was performed from independent culture preparations (wild-type = 2, Gdap1−/− = 4). Scale bar 2 μm, detail 1 μm. (B) Percentage of punctate GFP-LC3 in transfected eMNs (n = 150 wild-type cells, n = 202 Gdap1−/− cells) and in neuroblastoma cells stably expressing GFP-LC3 (n = SH-SY5Y GFP-LC3 cells, n = 100 SH-SY5Y G4 GFP-LC3 cells; three independent experiments). Scale bars: 10 μm. (C and D) Western blotting of LC3-I and LC3-II in eMNs and neuroblastoma cells with quantification of relative LC3-II protein levels (three independent experiments). (E and F) Percentage of p62-positive eMNs (D; n = 56, 50, 47 and 45 cells, respectively) and neuroblastoma cells (E; n = 287 241 288 and 222 cells, respectively) without treatment and after BafA1 treatment. Three independent experiments. Scale bars: 10 μm. Data information: In (A), the box plot lines correspond from the bottom of the box to top: 25th percentile, median percentile, 75th percentile. The whiskers extend to the minimum and maximum values. In (B–F), data represent mean ± SD and individual values are displayed as dots. Mann–Whitney test (A), Mantel–Haenszel chi-squared test (B, E, F) and Student’s t-test (C, D). *P < 0.05, **P < 0.01, ***P < 0.001.
Figure 2
Figure 2
GDAP1 interacts with SYNTAXIN 17 (STX17) and LC3 in MAMs. (A) Negative interactions by co-IP assays of GDAP1 with DRP1 (mitochondrial fission in MAMs), ACSL1 (fatty acid metabolism in MAMs), GRP75 (Ca2+ channel in MAMs), BECLIN-1 (ER-mitochondria tethering and autophagosome formation), ATG4 (unique redox sensor essential for maturation of autophagosomes) and RAB7 (trafficking, maturation, and fusion of endocytic and autophagic vesicles). (B and C) Co-IP assay of endogenous GDAP1 and STX17 (B) or LC3 (C) in SH-SY5Y cells. (D and E) Representative images of the interaction between GDAP1 and STX17 (D) or LC3 (E) in SH-SY5Y cells by PLA from 3 independent experiments. Scale bar: 10 μm. (F) Western blot of subcellular fractions from SH-SY5Y and G4 cells and quantification of relative protein levels in MAMs fraction (three or four independent experiments). C, cytosol; ER, endoplasmic reticulum; pM, pure mitochondria; MAM, mitochondria associated membranes. Data information: In (F), data represent mean ± SD and individual values are displayed as dots. ANOVA followed by Sidak’s post hoc test.
Figure 3
Figure 3
GDAP1 regulates membrane biogenesis in MAMs and the activity of PYKfyve. (A) Representative images of GFP-FYVE positive vesicles in transfected SH-SY5Y and G4 cells. Box-plot shows vesicle diameter (μm). Scale bar: 10 μm, 3D scale bar:1 μm. (B) PLA of GDAP1 and PIKfyve in untreated SH-SY5Y cells and after autophagy induction (EBSS). Quantification of the number of dots per cell is shown in the right panel (n = 261 untreated SH-SY5Y cells and n = 229 SH-SY5Y EBSS cells; three independent experiments). (C) Co-IP assay of endogenous GDAP1 and PIKfyve in SH-SY5Y cells. Quantification is shown in the right panel (three independent experiments). (DF) Representative images of lysosomes stained with LysoTracker Red (D) or α-LAMP-1 (E) in SH-SY5Y and G4 cells and with α-LAMP-1 in eMNs (F). (G) Representative images of α-LAMP-1 staining in untreated neuroblastoma cells and after Apilimod treatment (left panel) and lysosomal area distribution (right panel) (n = 2339 SH-SY5Y lysosomes, n = 3128 G4 lysosomes, n = 4487 SH-SY5Y Apilimod lysosomes and n = 2338 G4 Apilimod lysosomes; two independent experiments). Scale bar: 10 μm. (H and I) Representative images of TFEB staining and quantification of nuclear TFEB intensity in neuroblastoma cells (H) (n = 459 SH-SY5Y cells, n = 399 G4 cells; three independent experiments) and eMNs (I) (n = 95 Wild-type cells, n = 66 Gdap1−/− cells; three independent primary cultures). Scale bars: 10 μm. (J) Colocalization of GFP-LC3 vesicles with LAMP-1 staining in SH-SY5Y and G4 cells. Analysis of Mander’s Overlapping Coefficient (MOC) of the vesicles is shown in the graphic below (n = 278 SH-SY5Y cells, n = 260 G4 cells; three independent experiments). Scale bars: 10 μm. Data information: In (A, B), the box plot lines correspond from the bottom of the box to top: 25th percentile, median percentile, 75th percentile. The whiskers extend to the minimum and maximum values. Outliers are represented as dots. In (C, G, H, I and J) data represent mean ± SD and individual values are displayed as dots. Mann–Whitney U test (A, B), Student’s t-test (C, H–J) and Kolmogorov–Smirnov test (G). *P < 0.05, **P < 0.01, ***P < 0.001.
Figure 4
Figure 4
GDAP1 interacts with the lysosomal-associated membrane protein LAMP-1. (A) Western blotting of enriched lysosome fractions isolated from SH-SY5Y cells. The red box marks the pure lysosome fractions. (B) SH-SY5Y cells transfected with pCMV-GDAP1-Myc and stained with α-LAMP-1 and MitoTracker Deep Red after different treatments. Deconvoluted images and magnification are shown (insets). Scale bar: 10 μm. (C) Co-IP assay of endogenous GDAP1 and LAMP-1 in SH-SY5Y cells. (D) PLA assay of endogenous GDAP1 and LAMP-1 interaction in SH-SY5Y and G4 cells with two specific epitope-LAMP-1 antibodies. Quantification of the number of dots per cell is shown in the right panel (n = 54 SH-SY5Y cells, n = 29 G4 cells, n = 22 SH-SY5Y cells, n = 42 G4 cells). Scale bar 10 μm. (E) PLA assay of endogenous GDAP1 and LAMP-1 interaction in wild-type and Gdap1−/− eMNs. The bright field, a complementary image with TUBB3 staining and magnification details of axonal interactions are shown. Scale bars: 10 μm. (F) A sample frame (up) of the confocal live imaging of SH-SY5Y cells overexpressing LAMP1-GFP and stained with MitoTracker Deep Red. Intensity-based image segmentation (identification of lysosomes and mitochondria) was applied to each video frame and the colocalization structures were then isolated. Maximum projection of the 2D + t volume generated from the colocalization at each video frame is shown (down). Scale bar: 10 μm. Data information: In (D) the box plot lines correspond from the bottom of the box to top: 25th percentile, median percentile, 75th percentile. The whiskers extend to the minimum and maximum values. Mann–Whitney U test ***P < 0.001.
Figure 5
Figure 5
GDAP1 and LAMP-1 is a new tethering pair of mitochondria-lysosomes MCSs. (A) Comparative Kernel density plots of lysosome-mitochondria distance in SH-SY5Y and G4 cells. (B) Cumulative distribution plot of lysosome-mitochondria distance in SH-SY5Y and G4 cells. (C) Distance between lysosomes and mitochondria in SH-SY5Y (n = 100 total events) and G4 (n = 104 total events) cells. (D) Percentage of events in the four categories (contact, possible contact, vicinity and far) in SH-SY5Y (n = 100 total events) and G4 (n = 104 total events) cells. (E) Representative 3D images of the four mitochondria–lysosome event categories and the corresponding intensity profiles of MTDR (red channel) and LAMP-1 (green channel) along an ideal straight line crossing the event. Scale bar: 500 nm. (A.U: arbitrary units). (F) Percentage of engulfment events in SH-SY5Y (n = 100 total events) and G4 (n = 104 total events) cells. A representative 3D images of and engulfment event and the corresponding intensity profile of MTDR (red channel) and LAMP-1 (green channel) along an ideal straight line (white) crossing the event. Scale bar: 500 nm. (A.U: arbitrary units). (G) Percentage of total lysosome area colocalizing with mitochondria (n = 3600 video frames form 8 SH-SY5Y cells), n = 3150 video frames from 7 G4 cells). (H) Duration (ms) of lysosome-mitochondria contacts (n = 10 658 contacts from 8 SH-SY5Y cells), n = 19 661 contacts from 7 G4 cells. Data information: In (C), the box plot lines correspond from the bottom of the box to top: 25th percentile, median percentile, 75th percentile. The whiskers extend to the minimum and maximum values. In (F, G and H) data represent mean ± SD. Kolmogorov–Smirnov test (B), Mann–Whitney U test (C), Pearson’s Chi-squared test (D), Fisher’s exact test (F) and Student’s t-test (G and H). *P < 0.05, **P < 0.01, ***P < 0.001.
Figure 6
Figure 6
Restoration of cellular GSH levels rescues lysosomal morphology in GDAP1 depleted cells. (A and B) GSH levels (nmol/mg protein) in SH-SY5Y and G4 cells (n = 6 independent experiments) (A) and in Gdap1−/− eMNs (n = 3 independent experiments) (B). (C) Percentage of GFP-LC3 vesicles in untreated neuroblastoma cells stably expressing GFP-LC3 and after GSH-MEE treatment (n = 278 SH-SY5Y cells, n = 260 G4 cells, n = 181 SH-SY5Y GSH cells and n = 111 G4 GSH cells; three independent experiments). (D) Representative images of α-LAMP-1 staining in untreated neuroblastoma cells and after GSH-MEE treatment (left panel) and lysosomal area distribution (right panel) (n = 7653 SH-SY5Y lysosomes, n = 9404 G4 lysosomes, n = 6181 SH-SY5Y GSH-MEE lysosomes and n = 6504 G4 GSH-MEE lysosomes; three independent experiments). Scale bars: 10 μm. (E) Representative images of α-LAMP-1 staining in untreated MNs and after GSH-MEE treatment (left panel) and quantification of LAMP-1 intensity levels (right panel) (n = 71 Wild-type cells, n = 92 Gdap1−/− cells, n = 83 Wild-type GSH-MEE cells, and n = 70 Gdap1−/− GSH-MEE cells; two independent primary cultures). Scale bars: 10 μm. Data information: In (A and B), the box plot lines correspond from the bottom of the box to top: 25th percentile, median percentile, 75th percentile. The whiskers extend to the minimum and maximum values. In (C–E) data represent mean ± SD and individual values are displayed as dots. Mann–Whitney U test (A and B), ANOVA followed by Sidak’s post hoc test (C and E) and Kolmogorov–Smirnov test (D). *P < 0.05, **P < 0.01, ***P < 0.001.
Figure 7
Figure 7
Restoration of cellular GSH levels rescues mitochondrial network dynamics in GDAP1 depleted cells. (A) Representative 3D volume models of the mitochondrial network in SH-SY5Y, G4 and GSH-MEE-treated G4 cells. (BO) Assessment of morphological mitochondrial parameters for the total network (B–I) (n = 20 SH-SY5 cells, n = 22 G4 cells, n = 21 SH-SY5Y GSH-MEE cells, and n = 24 G4 GSH-MEE cells) and network sub-structures (J–O) (n = 582 structures from 20 SH-SY5Y cells, n = 432 structures from 22 G4 cells, n = 584 structures from SH-SY5Y GSH-MEE 21 cells and n = 815 structures from 24 cells). (P) Table summarizing measured mitochondrial parameters. (Q and R) Percentage of contacts in the four categories (Q) and engulfment events (R) in untreated SH-SY5Y and G4 cells or after GSH-MEE treatment (n = 100 SH-SY5Y cells, n = 104 G4 cells, n = 82 SH-SY5Y GSH-MEE cells and n = 102 G4 GSH-MEE cells). Data information: In (B–O) data represent mean ± SEM. ANOVA followed by Tukey’s post hoc test (A–O), Pearson’s Chi-squared (Q) and Fisher’s exact tests (R). *P < 0.05, **P < 0.01, ***P < 0.001, ns, non-significant.
Figure 8
Figure 8
GDAP1 function in mitochondrial MCSs and proposed pathophysiological mechanisms in deficient cells. (A) GDAP1 is located in both the outer mitochondrial membrane and the mitochondria-associated membranes (MAMs), the membrane contact sites (MCSs) between mitochondria and ER. GDAP1 participates in membrane biogenesis of early autophagic vesicles, interacting with STX17 and LC3-I/II, allowing proper basal autophagic flux. GDAP1 through its interaction with the lysosomal protein LAMP-1, constitutes a new tether of mitochondria-lysosome MCSs, regulating mitochondrial and lysosomal dynamics. GDAP1 also interacts with the kinase PIKfyve, involved in lysosomal identity, maturation, and transport. The figure also includes the known participation of GDAP1 in both retrograde and anterograde movements mediated by RAB6 and caytaxin, respectively, which locates mitochondria at Ca2+ microdomains. (B) Cells lacking GDAP1 present an oxidative microenvironment due to a decrease in GSH levels. The depletion of GDAP1 causes defects in vesicle biogenesis from MAMs, leading to autophagosome accumulation and slowing down the autophagic flux. The lack of GDAP1 also affects mitochondria-lysosome MCSs inducing (1) enlarged lysosomes and the activation of TFEB, which is recruited to the nucleus activating the expression of autophagic genes and (2) mitochondrial network abnormalities. In Ca2+ microdomains, mitochondrial localization is also altered affecting SOCE activity. Illustration created with BioRender (https://biorender.com/).

References

    1. Rossor A.M., Tomaselli P.J. and Reilly M.M. (2016) Recent advances in the genetic neuropathies. Curr. Opin. Neurol., 29, 537–548. - PMC - PubMed
    1. Marco A., Cuesta A., Pedrola L., Palau F. and Marin I. (2004) Evolutionary and structural analyses of GDAP1, involved in Charcot-Marie-Tooth disease, characterize a novel class of glutathione transferase-related genes. Mol. Biol. Evol., 21, 176–187. - PubMed
    1. Huber N., Bieniossek C., Wagner K.M., Elsasser H.P., Suter U., Berger I. and Niemann A. (2016) Glutathione-conjugating and membrane-remodeling activity of GDAP1 relies on amphipathic C-terminal domain. Sci. Rep., 6, 36930. - PMC - PubMed
    1. Baxter R.V., Ben Othmane K., Rochelle J.M., Stajich J.E., Hulette C., Dew-Knight S., Hentati F., Ben Hamida M., Bel S., Stenger J.E. et al. (2002) Ganglioside-induced differentiation-associated protein-1 is mutant in Charcot-Marie-Tooth disease type 4A/8q21. Nat. Genet., 30, 21–22. - PubMed
    1. Cuesta A., Pedrola L., Sevilla T., Garcia-Planells J., Chumillas M.J., Mayordomo F., LeGuern E., Marin I., Vilchez J.J. and Palau F. (2002) The gene encoding ganglioside-induced differentiation-associated protein 1 is mutated in axonal Charcot-Marie-Tooth type 4A disease. Nat. Genet., 30, 22–25. - PubMed

Publication types

MeSH terms