

The calcium transporter ANNEXIN1 mediates cold-induced calcium signaling and freezing tolerance in plants
- PMID: 33372703
- PMCID: PMC7809786
- DOI: 10.15252/embj.2020104559
The calcium transporter ANNEXIN1 mediates cold-induced calcium signaling and freezing tolerance in plants
Abstract
The transient elevation of cytosolic free calcium concentration ([Ca2+ ]cyt ) induced by cold stress is a well-established phenomenon; however, the underlying mechanism remains elusive. Here, we report that the Ca2+ -permeable transporter ANNEXIN1 (AtANN1) mediates cold-triggered Ca2+ influx and freezing tolerance in Arabidopsis thaliana. The loss of function of AtANN1 substantially impaired freezing tolerance, reducing the cold-induced [Ca2+ ]cyt increase and upregulation of the cold-responsive CBF and COR genes. Further analysis showed that the OST1/SnRK2.6 kinase interacted with and phosphorylated AtANN1, which consequently enhanced its Ca2+ transport activity, thereby potentiating Ca2+ signaling. Consistent with these results and freezing sensitivity of ost1 mutants, the cold-induced [Ca2+ ]cyt elevation in the ost1-3 mutant was reduced. Genetic analysis indicated that AtANN1 acts downstream of OST1 in responses to cold stress. Our data thus uncover a cascade linking OST1-AtANN1 to cold-induced Ca2+ signal generation, which activates the cold response and consequently enhances freezing tolerance in Arabidopsis.
Keywords: Arabidopsis; OST1 kinase; calcium signal; calcium-permeable transporter AtANN1; freezing tolerance.
© 2020 The Authors.
Conflict of interest statement
The authors declare that they have no conflict of interest.
Figures

- A–C
Freezing phenotype (A), survival rate (B), and ion leakage (C) of Col‐0, atann1, and atann1 AtANN1 (#10) plants. Twelve‐day‐old plants grown on MS medium at 22°C were exposed to freezing temperatures (NA for non‐acclimation, −5°C, 30 min; CA for cold acclimation, −8°C, 40 min). Representative pictures are shown in (A).
- D, E
Expression of CBFs (D) and their targets (E) in Col‐0, atann1, and atann1 AtANN1 (#10) plants. Twelve‐day‐old plants grown on MS medium at 22°C were placed at 4°C for 3 h (D) or 24 h (E), and total RNA was extracted and subjected to qRT–PCR analysis. Relative transcript levels in untreated Col‐0 plants were set to 1.

- A, B
mRNA (A) and the protein (B) levels of AtANN1 in the wild type (Col‐0), atann1 and atann1 AtANN1 (#4 and #10) seedlings. AtANN1 protein was detected with anti‐GFP antibody. HSP90 was used as a control.
- C–E
Freezing phenotype (C), survival rate (D), and ion leakage (E) of Col‐0, atann1, and atann1 AtANN1 (#4) plants. 12‐day‐old plants grown on MS medium at 22°C were exposed to freezing temperatures (NA for non‐acclimation, −5°C, 30 min; CA for cold acclimation, −8°C, 40 min). Representative pictures are shown in (C).
- F, G
Freezing phenotype (F) and survival rate (G) of Col‐0, atann4‐1, and atann4‐2 plants. 12‐day‐old plants grown on MS medium at 22°C were exposed to freezing temperatures (NA, −5°C, 30 min; CA, −8°C, 40 min). Representative pictures are shown in (F).
- H, I
Freezing phenotype (H) and survival rate (I) of Col‐0, atann1, atann4‐1 and atann1 atann4‐1 plants. 12‐day‐old plants grown on MS medium at 22°C were exposed to freezing temperatures (NA, −5°C, 30 min; CA, −8°C, 40 min). Representative pictures are shown in (H).

- A–C
Pseudocolor luminescence image of Ca2+‐dependent photons emitted by 10‐day‐old wild type (Col‐0), atann1, and atann1 AtANN1 complementation line (#10) after treatment with ice‐cold water (4°C water) (A). Seedlings grown at 22°C or treated with water at room temperature (22°C water) were used as controls. Luminescence signals were collected for 8 min and the color scale indicates photon counts per pixel (A, top), and photographs was taken as control (A, bottom). Analysis of relative luminescence signal intensity in (A) was shown (B). Aequorin protein levels of seedlings used in (A) detected with anti‐Aequorin antibody (C). HSP90 was used as a control.
- D
Time‐course analysis of [Ca2+]cyt dynamics between 10‐day‐old wild‐type (Col‐0) and ann1‐2 mutant after treatment with 4°C water (arrow shows the time point of treatment). Luminescence was recorded at 1‐s intervals. Quantification of the cold‐induced [Ca2+]cyt changes shown in the left. Peak [Ca2+]cyt indicates the highest [Ca2+]cyt after treatment.
- E
Time‐course analysis of cytosolic free calcium concentration ([Ca2+]cyt) dynamics in 10‐day‐old wild type (Col‐0), atann1, and atann1 AtANN1 complementation line (#10) after treatment with 22°C water or 22°C water containing 10 mM LaCl3 (arrow shows the time point of treatment). Luminescence was recorded at 1‐s intervals.
- F
Time‐course analysis of [Ca2+]cyt dynamics between 10‐day‐old wild‐type (Col‐0) and atann4‐1 mutant after treatment with 4°C water (left) or 22°C water (right). Luminescence was recorded at 1‐s intervals. Quantification of the cold‐induced [Ca2+]cyt changes shown in the left. Peak [Ca2+]cyt indicates the highest [Ca2+]cyt after treatment.

- A
Time‐course analysis of cytosolic free calcium concentration ([Ca2+]cyt) dynamics in 10‐day‐old wild type (Col‐0), atann1, and atann1 AtANN1 complementation line (#10) after treatment with ice‐cold water or ice‐cold water containing 10 mM LaCl3 (arrow shows the time point of treatment). Luminescence was recorded at 1‐s intervals.
- B
Quantification of the cold‐induced [Ca2+]cyt changes shown in (A). Peak [Ca2+]cyt indicates the highest [Ca2+]cyt after treatment.
- C
GST pull‐down assay showing that OST1 interacts with AtANN1 in vitro. Purified recombinant GST‐OST1, GST‐OST1G33R, or GST proteins from Escherichia coli were immunoprecipitated with GST beads and then incubated with MBP‐His‐AtANN1. Precipitated proteins were detected with anti‐GST and anti‐His antibodies.
- D
Interaction of OST1 and AtANN1 detected by bimolecular fluorescence complementation (BiFC) assays. The construct combinations were co‐transformed into Nicotiana benthamiana leaves and expressed for 2 days. The signal was detected by confocal microscopy. Scale bar, 25 µm. The fluorescence intensity was scanned using the ImageJ plot profile tool. The y‐axes indicate relative pixel intensity.
- E, F
Interaction of OST1 and AtANN1 detected by Co‐IP assays in Arabidopsis. Twelve‐day‐old OST1‐Myc overexpressing plants grown on MS medium at 22°C were placed at 4°C for 0, 0.5, 2 h, and total proteins were extracted and immunoprecipitated with anti‐Myc agarose beads. The wild type (Col‐0) treated with 4°C for 2 h was used as control. The OST1‐Myc protein was detected with anti‐Myc antibody, and the AtANN1 protein was detected with anti‐AtANN1 antibody. Representative pictures are shown in (E) and relative protein level in (F).
- G
Co‐IP assay showing the interaction between OST1 and AtANN1 in vivo. The construct combinations were expressed in N. benthamiana leaves. Total proteins were extracted after the N. benthamiana leaves treated with 4°C or 22°C and immunoprecipitated with anti‐Myc agarose beads. The proteins were detected with anti‐Myc and anti‐GFP antibodies.
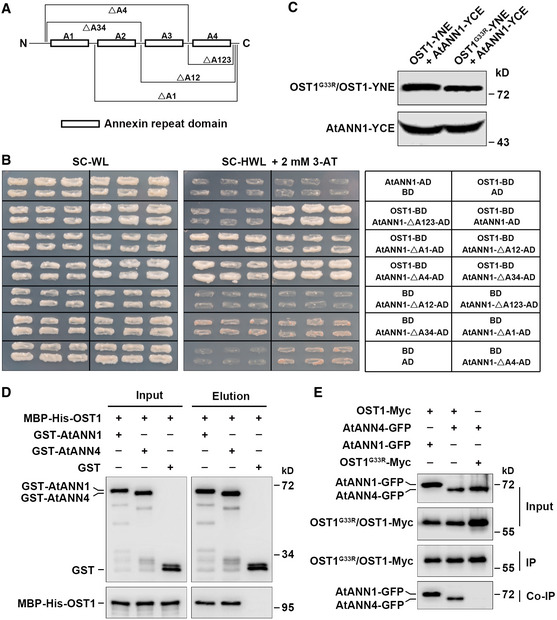
Diagram of AtANN1‐truncated proteins used for the yeast two‐hybrid assays described in (B).
The interaction of OST1 and AtANN1 in yeast cells. Yeast cells were grown on SC/–Trp/–Leu (–WL) medium for 2 days or SC/–His/–Trp/–Leu (–HWL) medium supplemented with 2 mM 3‐AT for 4 days.
The protein level of AtANN1 and OST1/OST1G33R in BiFC assays described in Fig 2D. OST1‐YNE and OST1G33R‐YNE proteins were detected with anti‐Myc antibody. AtANN1‐YCE protein was detected with anti‐HA antibody.
GST pull‐down assay showing that OST1 interacts with AtANN4 in vitro. Purified recombinant GST‐AtANN1, GST‐AtANN4, or GST proteins from E. coli were immunoprecipitated with GST beads and then incubated with MBP‐His‐OST1. Precipitated proteins were detected with anti‐GST and anti‐His antibodies.
Co‐IP assay showing the interaction between OST1 and AtANN4 in vivo. The construct combinations were expressed in Nicotiana benthamiana leaves. Total proteins were extracted and immunoprecipitated with anti‐Myc agarose beads. The proteins were detected with anti‐Myc and anti‐GFP antibodies.

- A–C
Freezing phenotype (A), survival rate (B), and ion leakage (C) of Col‐0, ost1‐3, atann1, and atann1 ost1‐3. Twelve‐day‐old plants grown on MS medium at 22°C were exposed to freezing temperatures (NA, −5°C, 30 min; CA, −8°C, 40 min). Representative pictures are shown in (A).
- D, E
OST1 gene expression (D) and protein levels of OST1 and AtANN1 (E) in Col‐0, OST1‐Myc, atann1, and OST1‐Myc atann1. OST1 and AtANN1 proteins were detected with anti‐Myc and anti‐AtANN1 antibodies. HSP90 was used as a control.
- F–H
Freezing phenotype (F), survival rate (G), and ion leakage (H) of Col‐0, OST1‐Myc, atann1 and OST1‐Myc atann1. 12‐day‐old plants grown on MS medium at 22°C were exposed to freezing temperatures (NA, −5°C, 30 min; CA, −8°C, 40 min). Representative pictures are shown in (F).

- A, B
OST1 phosphorylates AtANN1 (A) and AtANN4 (B) in vitro. Purified recombinant MBP‐His‐OST1 was incubated with GST‐AtANN1, GST‐AtANN4, or GST in kinase reaction buffer with 1 µCi [γ‐32P] ATP for 30 min at 30°C, followed by separation with SDS–PAGE. Phosphorylated AtANN1 and AtANN4 were detected by autoradiography. Recombinant OST1, AtANN1, and AtANN4 were stained by Coomassie brilliant blue (CBB).
- C
In‐gel kinase assays of OST1 in Col‐0 and ost1‐3 mutant under cold stress. Twelve‐day‐old Col‐0 and ost1‐3 mutant were treated at 4°C for 2 h. Total protein extracts were prepared and separated on a SDS–PAGE gel containing 0.2 mg/ml GST‐AtANN1 as a substrate and incubated with 70 µCi [γ‐32P] ATP. Top, autoradiograph; bottom, CBB staining.
- D
In vitro kinase analysis of the indicated mutant forms of AtANN1 by OST1. After phosphorylation, the proteins were separated by SDS–PAGE and subjected to autoradiography. Top, autoradiograph; bottom, CBB staining.
- E
OST1 phosphorylates AtANN1 at S289 in vivo in LC/MS analysis. Total proteins were extracted from 12‐day‐old AtANN1‐Myc overexpressing plants treated at 4°C for 0, 10, 30, and 120 min, followed by trypsin digestion. Phosphopeptides were enriched for mass spectrometry analysis. Representative picture for 10 min was shown.

- A–C
Freezing phenotype (A), survival rate (B), and ion leakage (C) of Col‐0, atann1, and atann1 AtANN1S289E (#5) plants. 12‐day‐old plants grown on MS medium at 22°C were exposed to freezing temperatures (NA, −5°C, 30 min; CA, −8°C, 40 min). Representative pictures are shown in (A).
- D–F
Freezing phenotype (D), survival rate (E), and ion leakage (F) of Col‐0, Atann1, and atann1 AtANN1S289A (#16) plants. 12‐day‐old plants grown on MS medium at 22°C were exposed to freezing temperatures (NA, −5°C, 30 min; CA, −8°C, 40 min). Representative pictures are shown in (D).

AtANN1 current recordings in Xenopus oocytes. Whole‐cell currents were recorded in Xenopus oocytes injected with ddH2O or with AtANN1, OST1, or AtANN1 + OST1 cRNA. Bath solution was described in Materials and Methods. The voltage protocol as well as time and current scale bars for the recordings are shown.
Current–voltage (I–V) relationship of the steady‐state whole‐cell currents in Xenopus oocytes described in (A). Negative current is influx of cations into the oocytes.
Percentage of total Xenophus oocytes in different nA range according to (A).
AtANN1 current recordings in oocytes. Whole‐cell currents were recorded in Xenopus oocytes injected with ddH2O or with AtANN1, AtANN1 S289A, OST1, AtANN1 + OST1, and AtANN1 S289A + OST1 cRNA.
Current–voltage (I–V) relationship of the steady‐state whole‐cell currents in Xenopus oocytes described in (D).
Percentage of total Xenophus oocytes in different nA range according to (D).

AtANN1 current recordings in Xenophus oocytes. Whole‐cell currents were recorded in oocytes with injection of cRNA of ddH2O, AtANN1, OST1 and AtANN1 + OST1.
Current‐voltage (I–V) relationship of the steady‐state whole‐cell currents in Xenopus oocytes described in (A). Negative current is influx of cations into the oocytes.
Percentage of total Xenophus oocytes in different nA range according to (A).
Time‐course analysis of cytosolic free calcium concentration ([Ca2+]cyt) dynamics in 10‐day‐old wild‐type (Col‐0) and ost1‐3 mutant after treatment with 22°C water or 22°C water containing 10 mM LaCl3 (arrow shows the time point of treatment). Luminescence was recorded at 1‐s intervals. Quantification of the cold‐induced [Ca2+]cyt changes shown in the top. Peak [Ca2+]cyt in the bottom indicates the highest [Ca2+]cyt after treatment.
The protein level of GST, GST‐AtANN1, GST‐AtANN1S289A, and GST‐AtANN1S289E in MST assays described in Fig 7C.

Time‐course analysis of [Ca2+]cyt dynamics between 10‐day‐old wild‐type (Col‐0) and ost1‐3 mutant after treatment with ice‐cold water or ice‐cold water containing 10 mM LaCl3 (arrow shows the time point of treatment). Luminescence was recorded at 1‐s intervals.
Quantification of the cold‐induced [Ca2+]cyt changes shown in (A). Peak [Ca2+]cyt indicates the highest [Ca2+]cyt after treatment.
MST assays of the calcium‐binding affinity of GST‐AtANN1, GST‐AtANN1S289A, and GST‐AtANN1S289E. GST was used as a control.
A proposed working model. Under normal conditions, OST1 protein kinase interacts with PP2C, which inhibits the kinase activity of OST1. AtANN1 is localized in the cytosol and at the plasma membrane. Under cold stress, OST1 is activated and phosphorylates AtANN1, which, on the one hand, enhances the Ca2+ transport activity of AtANN1, and, on the other, promotes the Ca2+‐binding activity of AtANN1. This dual role of phosphorylation results in increased cold stress‐induced [Ca2+]cyt. Consequently, AtANN1 indirectly facilitates the expression of CBFs and CORs to positively regulate plant freezing tolerance.
Similar articles
-
OST1 kinase modulates freezing tolerance by enhancing ICE1 stability in Arabidopsis.Dev Cell. 2015 Feb 9;32(3):278-89. doi: 10.1016/j.devcel.2014.12.023. Dev Cell. 2015. PMID: 25669882
-
EGR2 phosphatase regulates OST1 kinase activity and freezing tolerance in Arabidopsis.EMBO J. 2019 Jan 3;38(1):e99819. doi: 10.15252/embj.201899819. Epub 2018 Nov 14. EMBO J. 2019. PMID: 30429206 Free PMC article.
-
Increasing freezing tolerance: kinase regulation of ICE1.Dev Cell. 2015 Feb 9;32(3):257-8. doi: 10.1016/j.devcel.2015.01.004. Dev Cell. 2015. PMID: 25669879
-
Calcium Signaling-Mediated Plant Response to Cold Stress.Int J Mol Sci. 2018 Dec 5;19(12):3896. doi: 10.3390/ijms19123896. Int J Mol Sci. 2018. PMID: 30563125 Free PMC article. Review.
-
Cold acclimation by the CBF-COR pathway in a changing climate: Lessons from Arabidopsis thaliana.Plant Cell Rep. 2019 May;38(5):511-519. doi: 10.1007/s00299-019-02376-3. Epub 2019 Jan 16. Plant Cell Rep. 2019. PMID: 30652229 Free PMC article. Review.
Cited by
-
Genome-Wide Characterization of Fructose 1,6-Bisphosphate Aldolase Genes and Expression Profile Reveals Their Regulatory Role in Abiotic Stress in Cucumber.Int J Mol Sci. 2024 Jul 13;25(14):7687. doi: 10.3390/ijms25147687. Int J Mol Sci. 2024. PMID: 39062929 Free PMC article.
-
UPL5 modulates WHY2 protein distribution in a Kub-site dependent ubiquitination in response to [Ca2+]cyt-induced leaf senescence.iScience. 2023 Mar 6;26(3):106216. doi: 10.1016/j.isci.2023.106216. eCollection 2023 Mar 17. iScience. 2023. Retraction in: iScience. 2023 Jun 01;26(6):106974. doi: 10.1016/j.isci.2023.106974. PMID: 36994183 Free PMC article. Retracted.
-
MdbHLH4 negatively regulates apple cold tolerance by inhibiting MdCBF1/3 expression and promoting MdCAX3L-2 expression.Plant Physiol. 2023 Jan 2;191(1):789-806. doi: 10.1093/plphys/kiac512. Plant Physiol. 2023. PMID: 36331333 Free PMC article.
-
Computational genomics insights into cold acclimation in wheat.Front Genet. 2022 Oct 20;13:1015673. doi: 10.3389/fgene.2022.1015673. eCollection 2022. Front Genet. 2022. PMID: 36338961 Free PMC article.
-
Insights into Plant Sensory Mechanisms under Abiotic Stresses.Plants (Basel). 2024 Jul 10;13(14):1907. doi: 10.3390/plants13141907. Plants (Basel). 2024. PMID: 39065434 Free PMC article. Review.
References
-
- Breton G, Vazquez‐Tello A, Danyluk J, Sarhan F (2000) Two novel intrinsic annexins accumulate in wheat membranes in response to low temperature. Plant Cell Physiol 41: 177–184 - PubMed
-
- Cantero A, Barthakur S, Bushart TJ, Chou S, Morgan RO, Fernandez MP, Clark GB, Roux SJ (2006) Expression profiling of the Arabidopsis annexin gene family during germination, de‐etiolation and abiotic stress. Plant Physiol Biochem 44: 13–24 - PubMed
-
- Ding Y, Li H, Zhang X, Xie Q, Gong Z, Yang S (2015) OST1 kinase modulates freezing tolerance by enhancing ICE1 stability in Arabidopsis . Dev Cell 32: 278–289 - PubMed
Publication types
MeSH terms
Substances
Grants and funding
- 2016ZX08009003/Ministry of Agriculture of China for Transgenic Research
- BB/K009869/1/UKRI | Biotechnology and Biological Sciences Research Council (BBSRC)
- Beijing Outstanding University Discipline Program
- 31920103002/NSFC | Foundation for Innovative Research Groups of the National Natural Science Foundation of China
- 31921001/NSFC | Foundation for Innovative Research Groups of the National Natural Science Foundation of China
LinkOut - more resources
Full Text Sources
Other Literature Sources
Molecular Biology Databases
Miscellaneous
