

Assessment of Amide proton transfer weighted (APTw) MRI for pre-surgical prediction of final diagnosis in gliomas
- PMID: 33373375
- PMCID: PMC7771875
- DOI: 10.1371/journal.pone.0244003
Assessment of Amide proton transfer weighted (APTw) MRI for pre-surgical prediction of final diagnosis in gliomas
Erratum in
-
Correction: Assessment of Amide proton transfer weighted (APTw) MRI for pre-surgical prediction of final diagnosis in gliomas.PLoS One. 2021 Apr 8;16(4):e0250189. doi: 10.1371/journal.pone.0250189. eCollection 2021. PLoS One. 2021. PMID: 33831103 Free PMC article.
Abstract
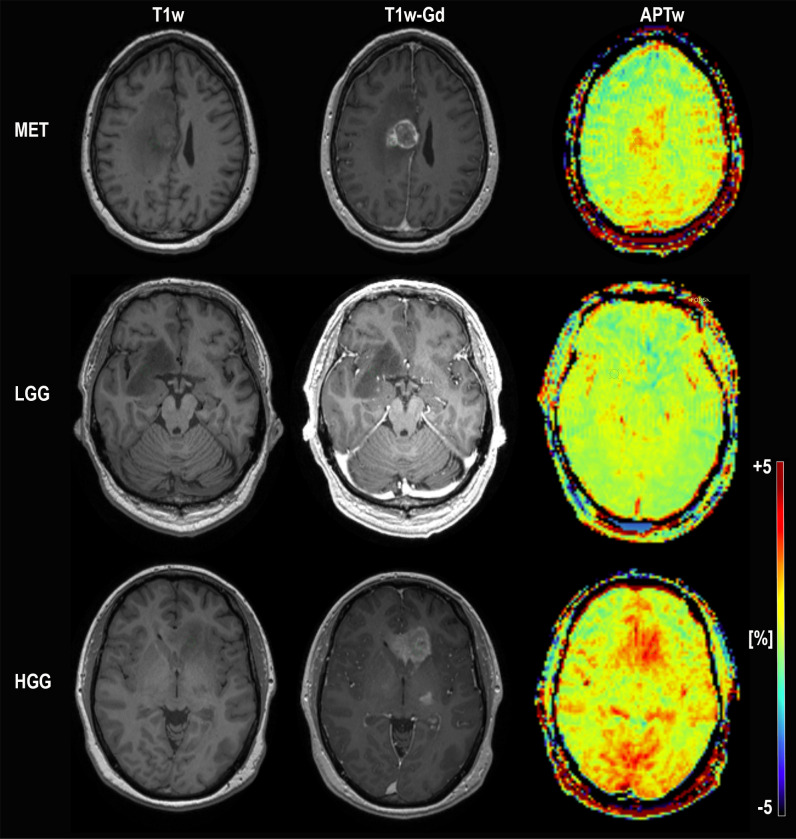
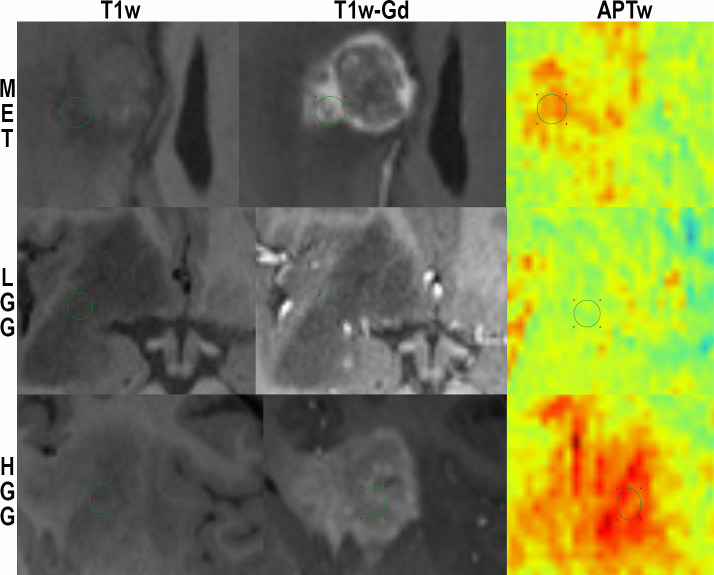
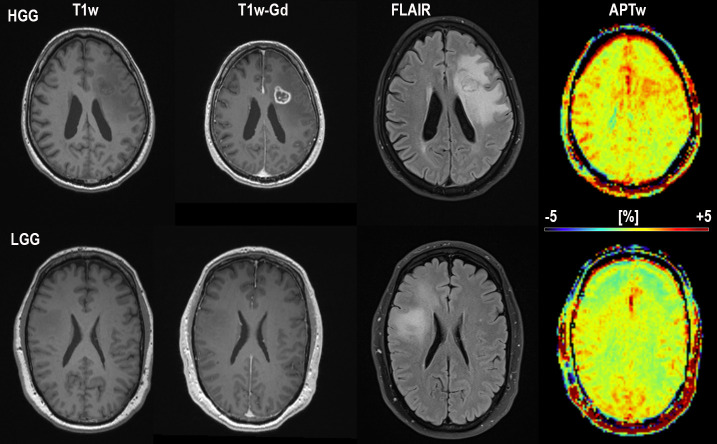
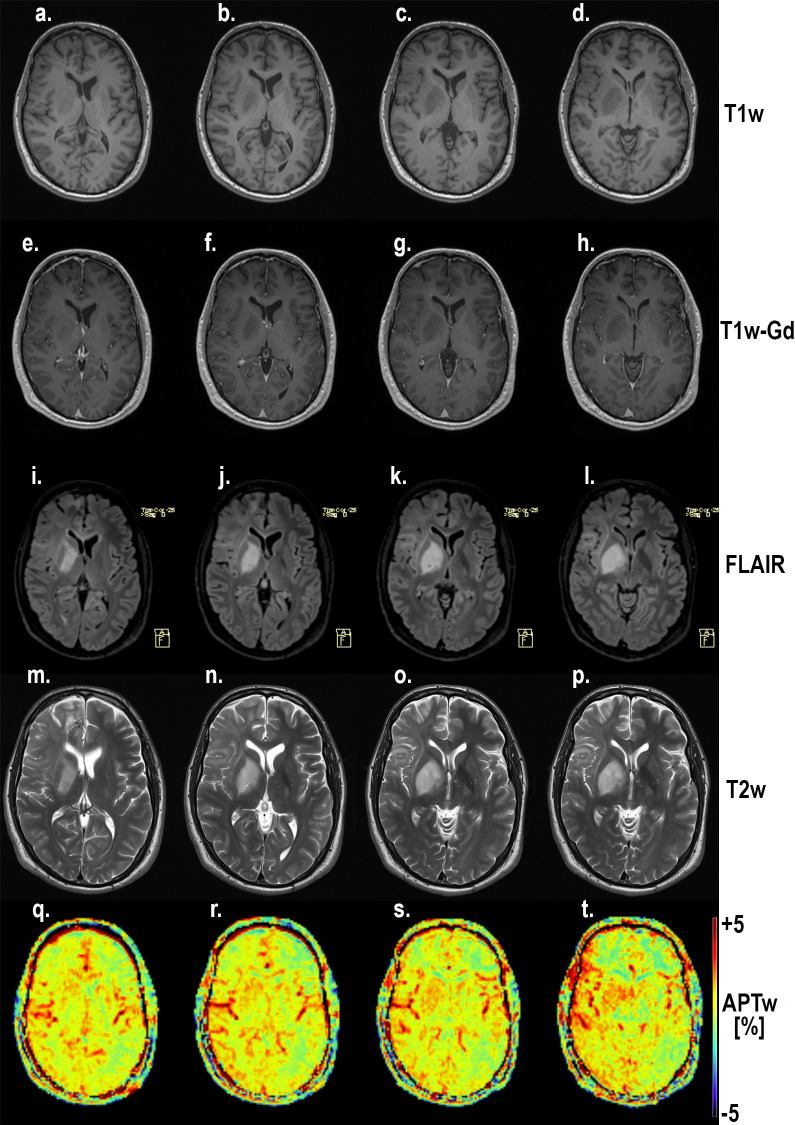
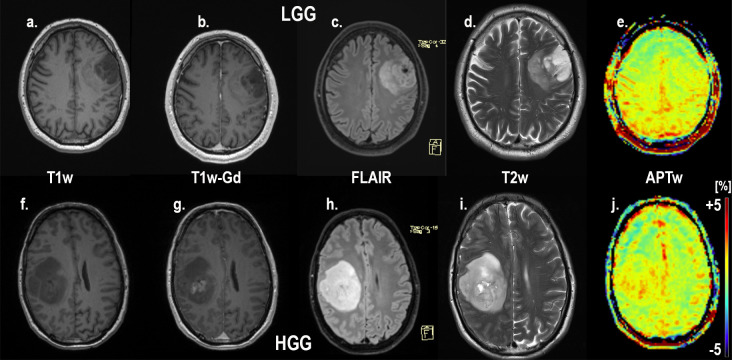
Purpose: Radiological assessment of primary brain neoplasms, both high (HGG) and low grade tumors (LGG), based on contrast-enhancement alone can be inaccurate. We evaluated the radiological value of amide proton transfer weighted (APTw) MRI as an imaging complement for pre-surgical radiological diagnosis of brain tumors.
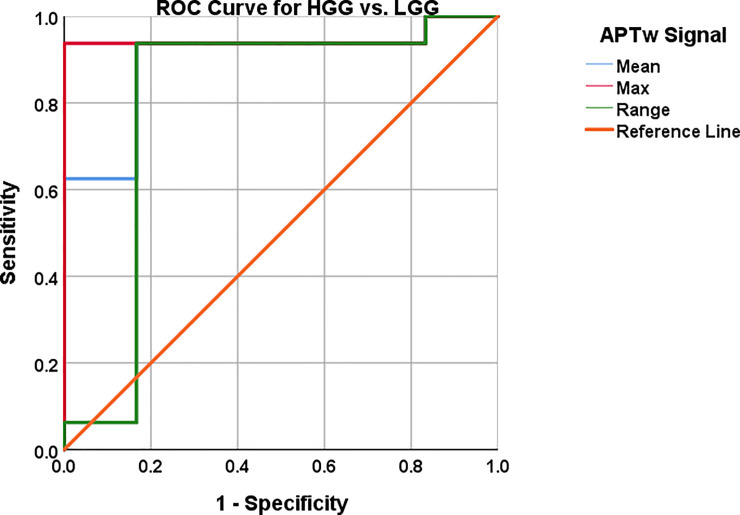
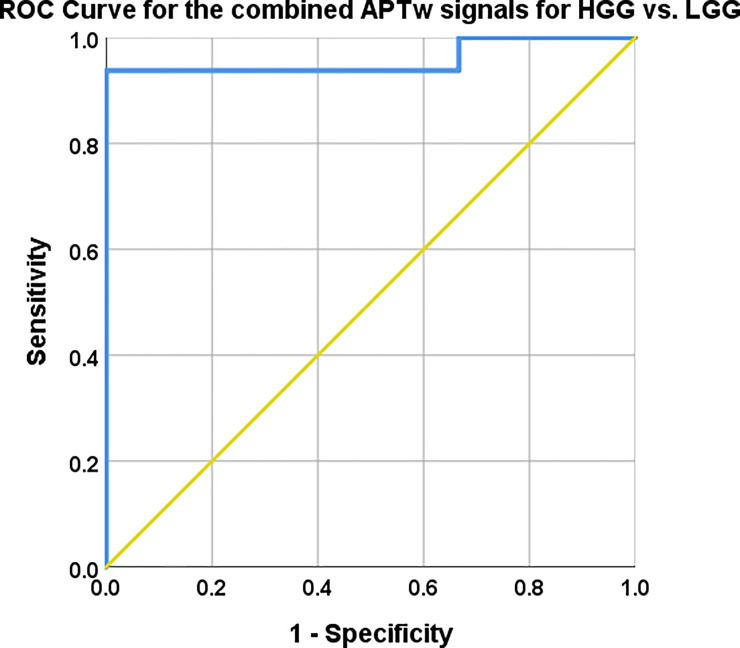
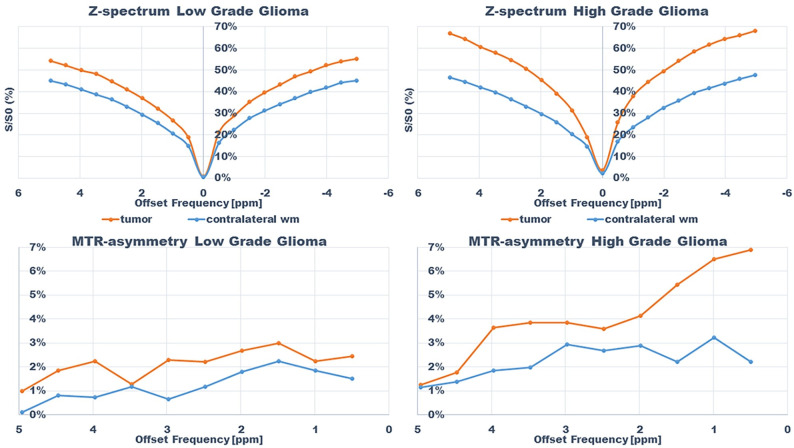
Methods: Twenty-six patients were evaluated prospectively; (22 males, 4 females, mean age 55 years, range 26-76 years) underwent MRI at 3T using T1-MPRAGE pre- and post-contrast administration, conventional T2w, FLAIR, and APTw imaging pre-surgically for suspected primary/secondary brain tumor. Assessment of the additional value of APTw imaging compared to conventional MRI for correct pre-surgical brain tumor diagnosis. The initial radiological pre-operative diagnosis was based on the conventional contrast-enhanced MR images. The range, minimum, maximum, and mean APTw signals were evaluated. Conventional normality testing was performed; with boxplots/outliers/skewness/kurtosis and a Shapiro-Wilk's test. Mann-Whitney U for analysis of significance for mean/max/min and range APTw signal. A logistic regression model was constructed for mean, max, range and Receiver Operating Characteristic (ROC) curves calculated for individual and combined APTw signals.
Results: Conventional radiological diagnosis prior to surgery/biopsy was HGG (8 patients), LGG (12 patients), and metastasis (6 patients). Using the mean and maximum: APTw signal would have changed the pre-operative evaluation the diagnosis in 8 of 22 patients (two LGGs excluded, two METs excluded). Using a cut off value of >2.0% for mean APTw signal integral, 4 of the 12 radiologically suspected LGG would have been diagnosed as high grade glioma, which was confirmed by histopathological diagnosis. APTw mean of >2.0% and max >2.48% outperformed four separate clinical radiological assessments of tumor type, P-values = .004 and = .002, respectively.
Conclusions: Using APTw-images as part of the daily clinical pre-operative radiological evaluation may improve diagnostic precision in differentiating LGGs from HGGs, with potential improvement of patient management and treatment.
Conflict of interest statement
PvZ acknowledges research support from Philips Healthcare, travel support from Philips Healthcare, paid lectures for Philips Healthcare. Also, APT technology is licensed to Philips Healthcare. The commercial vendor Siemens Healthcare provided support in the form of salaries for authors FT and BS, but did not have any additional role in the study. The specific roles of these authors are articulated in the ‘author contributions’ section. This does not alter our adherence to PLOS ONE policies on sharing data and materials.
Figures
References
-
- Urhie O, Turner R, Lucke-Wold B, Radwan W, Ahn J, Gyure K, et al. Glioblastoma Survival Outcomes at a Tertiary Hospital in Appalachia: Factors Impacting the Survival of Patients Following Implementation of the Stupp Protocol. World Neurosurg. 2018. July;115:e59–66. 10.1016/j.wneu.2018.03.163 - DOI - PMC - PubMed
-
- Kondziolka D, Lunsford LD, Martinez AJ. Unreliability of contemporary neurodiagnostic imaging in evaluating suspected adult supratentorial (low-grade) astrocytoma. J Neurosurg. 2009. October;79(4):533–6. - PubMed
Publication types
MeSH terms
Grants and funding
LinkOut - more resources
Full Text Sources
Medical
