

Biphasic Expression of Atypical Chemokine Receptor (ACKR) 2 and ACKR4 in Colorectal Neoplasms in Association with Histopathological Findings
- PMID: 33374792
- PMCID: PMC7824260
- DOI: 10.3390/biom11010008
Biphasic Expression of Atypical Chemokine Receptor (ACKR) 2 and ACKR4 in Colorectal Neoplasms in Association with Histopathological Findings
Abstract
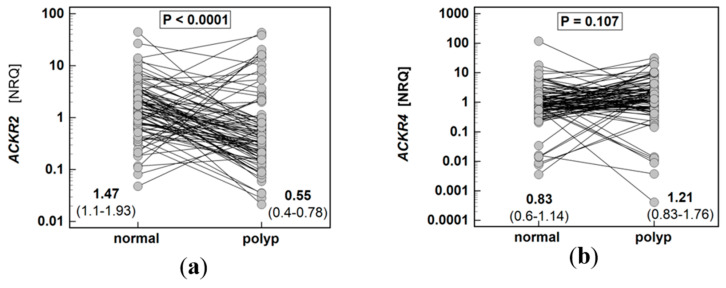
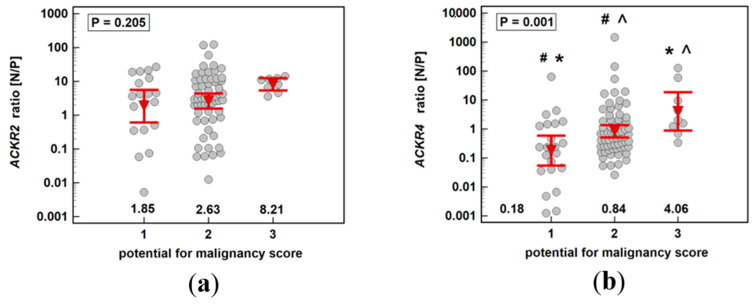
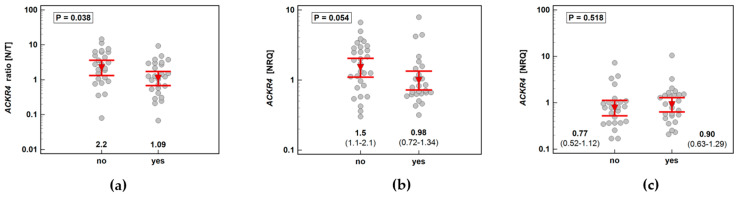
Facilitating resolution of inflammation using atypical chemokine receptors (ACKR) as an anticancer strategy is considered but requires a deeper understanding of receptor role in carcinogenesis. We aimed at transcriptional analysis (RTqPCR) of ACKR2 and ACKR4 expression in colorectal adenoma-adenocarcinoma sequence in paired normal-neoplastic tissues from 96 polyps and 51 cancers. On average, ACKR2 was downregulated in neoplastic as compared to non-affected tissue in polyp (by 2.7-fold) and cancer (by 3.1-fold) patients. The maximal downregulation (by 8.2-fold) was observed in adenomas with the highest potential for malignancy and was gradually lessening through cancer stages I-IV, owing to increased receptor expression in tumors. On average, ACKR4 was significantly downregulated solely in adenocarcinomas (by 1.5-fold), less so in patients with lymph node metastasis, owing to a gradual decrease in ACKR4 expression among N0-N1-N2 cancers in non-affected tissue without changes in tumors. In adenomas, ACKR4 downregulation in neoplastic tissue increased with increasing potential for malignancy and contribution of villous growth pattern. ACKR4 expression increased in non-affected tissue with a concomitant decrease in pathological mucosa. In conclusion, the changes in ACKRs expression occur already in precancerous colorectal lesions, culminating in the adenomas with the highest potential for malignancy. Therefore, chemoprevention by manipulating ACKRs' expression is worth exploration.
Keywords: CC chemokines; chemoprevention; colorectal adenomas; colorectal cancer; decoy receptors; resolution of inflammation.
Conflict of interest statement
The authors declare no conflict of interest.
Figures


Similar articles
-
Atypical chemokine receptors 1, 2, 3 and 4: Expression and regulation in the endometrium during the estrous cycle and pregnancy and with somatic cell nucleus transfer-cloned embryos in pigs.Theriogenology. 2019 Apr 15;129:121-129. doi: 10.1016/j.theriogenology.2019.02.021. Epub 2019 Feb 27. Theriogenology. 2019. PMID: 30844653
-
The relation between ACKR4 and CCR7 genes expression and breast cancer metastasis.Life Sci. 2021 Aug 15;279:119691. doi: 10.1016/j.lfs.2021.119691. Epub 2021 Jun 5. Life Sci. 2021. PMID: 34102193
-
Role of atypical chemokine receptor ACKR2 in experimental oral squamous cell carcinogenesis.Cytokine. 2019 Jun;118:160-167. doi: 10.1016/j.cyto.2018.03.001. Epub 2018 Mar 15. Cytokine. 2019. PMID: 29550065
-
Beyond Cell Motility: The Expanding Roles of Chemokines and Their Receptors in Malignancy.Front Immunol. 2020 Jun 4;11:952. doi: 10.3389/fimmu.2020.00952. eCollection 2020. Front Immunol. 2020. PMID: 32582148 Free PMC article. Review.
-
Atypical chemokine receptors in cancer.Cytokine. 2024 Apr;176:156504. doi: 10.1016/j.cyto.2024.156504. Epub 2024 Jan 23. Cytokine. 2024. PMID: 38266462 Review.
Cited by
-
ACKR4 in Tumor Cells Regulates Dendritic Cell Migration to Tumor-Draining Lymph Nodes and T-Cell Priming.Cancers (Basel). 2021 Oct 7;13(19):5021. doi: 10.3390/cancers13195021. Cancers (Basel). 2021. PMID: 34638505 Free PMC article.
-
Modulating Properties of Piroxicam, Meloxicam and Oxicam Analogues against Macrophage-Associated Chemokines in Colorectal Cancer.Molecules. 2021 Dec 5;26(23):7375. doi: 10.3390/molecules26237375. Molecules. 2021. PMID: 34885960 Free PMC article.
-
Macrophage Inflammatory Proteins (MIPs) Contribute to Malignant Potential of Colorectal Polyps and Modulate Likelihood of Cancerization Associated with Standard Risk Factors.Int J Mol Sci. 2024 Jan 23;25(3):1383. doi: 10.3390/ijms25031383. Int J Mol Sci. 2024. PMID: 38338661 Free PMC article.
-
Heat Shock Proteins HSPA1 and HSP90AA1 Are Upregulated in Colorectal Polyps and Can Be Targeted in Cancer Cells by Anti-Inflammatory Oxicams with Arylpiperazine Pharmacophore and Benzoyl Moiety Substitutions at Thiazine Ring.Biomolecules. 2021 Oct 27;11(11):1588. doi: 10.3390/biom11111588. Biomolecules. 2021. PMID: 34827586 Free PMC article.
-
The Role of Atypical Chemokine Receptor D6 (ACKR2) in Physiological and Pathological Conditions; Friend, Foe, or Both?Front Immunol. 2022 May 23;13:861931. doi: 10.3389/fimmu.2022.861931. eCollection 2022. Front Immunol. 2022. PMID: 35677043 Free PMC article. Review.
References
Publication types
MeSH terms
Substances
Grants and funding
LinkOut - more resources
Full Text Sources
Medical
Molecular Biology Databases
