. 2020 Dec 23;9(1):3.
doi: 10.3390/vaccines9010003.

Resources, Production Scales and Time Required for Producing RNA Vaccines for the Global Pandemic Demand

Affiliations

Resources, Production Scales and Time Required for Producing RNA Vaccines for the Global Pandemic Demand

Zoltán Kis et al. Vaccines (Basel). .

Erratum in

Abstract

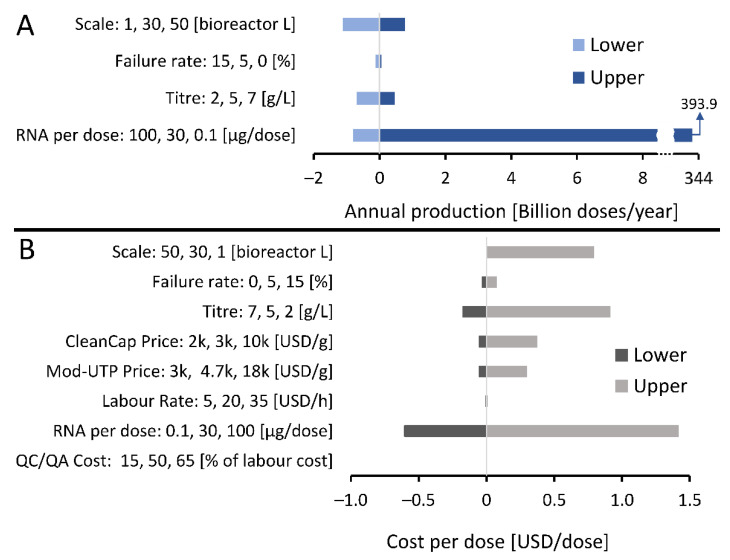
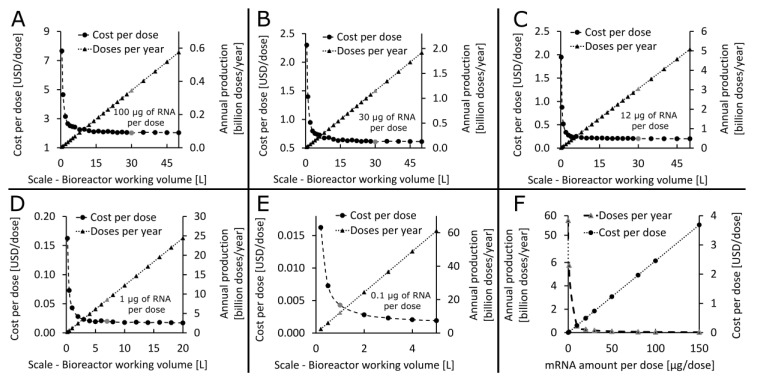
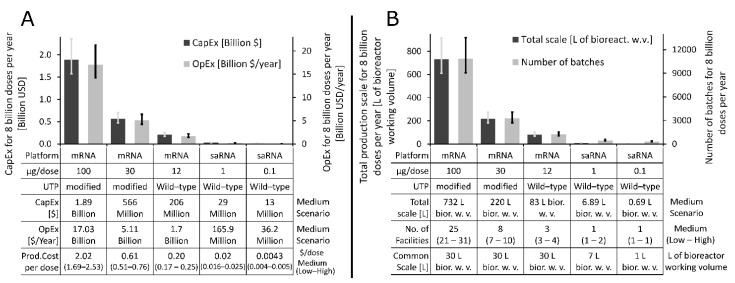
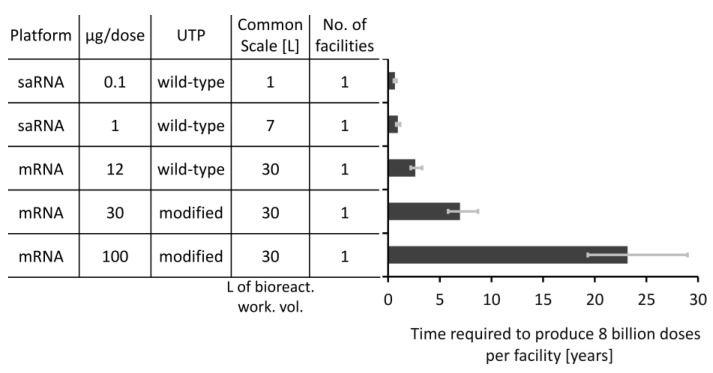
To overcome pandemics, such as COVID-19, vaccines are urgently needed at very high volumes. Here we assess the techno-economic feasibility of producing RNA vaccines for the demand associated with a global vaccination campaign. Production process performance is assessed for three messenger RNA (mRNA) and one self-amplifying RNA (saRNA) vaccines, all currently under clinical development, as well as for a hypothetical next-generation saRNA vaccine. The impact of key process design and operation uncertainties on the performance of the production process was assessed. The RNA vaccine drug substance (DS) production rates, volumes and costs are mostly impacted by the RNA amount per vaccine dose and to a lesser extent by the scale and titre in the production process. The resources, production scale and speed required to meet global demand vary substantially in function of the RNA amount per dose. For lower dose saRNA vaccines, global demand can be met using a production process at a scale of below 10 L bioreactor working volume. Consequently, these small-scale processes require a low amount of resources to set up and operate. RNA DS production can be faster than fill-to-finish into multidose vials; hence the latter may constitute a bottleneck.

Keywords: COVID-19; RNA vaccines; mRNA vaccines; pandemic-response vaccine production; production process modelling; saRNA vaccines; techno-economic analysis.


Conflict of interest statement

The authors declare no conflict of interest.

Figures

Figure 1
Figure 1
Sensitivity analysis showing RNA vaccine drug substance manufacturing uncertainties and their impact on annual production amounts and costs per dose. Input variables which are uncertain, their uncertainty ranges and units are shown on the vertical y-axis and the outputs of drug substance annual production amounts and costs per dose and shown on the horizontal x-axis. The zero values shown on the horizontal x-axes and the corresponding vertical line indicates a baseline scenario which describes an RNA vaccine production process with a 30 L bioreactor working volume scale, a final titre in the bioreactor of 5 g/L, 44% combined losses in the downstream purification and formulation steps, 30 µg of RNA per vaccine dose, a production process failure rate of 5%, 5′ cap analogue (CleanCap) purchase price of 3000 USD/g, 1-methyl-pseudouridine (Mod-UTP) purchase price of 4700 USD/g, basic labour rate of 20 USD/hour, quality control testing (QC/QA) cost of 50% of the labour costs, and 444–471 production batches completed per year. (A) The impact of uncertainties and their ranges listed on the vertical y-axis on the amount of doses worth of lipid nanoparticles (LNP) formulated RNA that can be produced annually shown on the horizontal x-axis. Results are shown relative to a baseline scenario at zero on the x-axis, as described above. (B) The impact of uncertainties and their ranges listed on the vertical y-axis on the production cost of the LNP formulated RNA drug substance per dose shown on the horizontal x-axis. Results are shown relative to a baseline scenario at zero on the x-axis.
Figure 2
Figure 2
Determining the techno-economically feasible production scale for five vaccines with varying RNA amount per dose listed in Table 1. The entire process is scaled up proportionally and the scale is indicated by the bioreactor working volume. (A) Identifying the techno-economically feasible production scale for a 100 µg/dose RNA vaccine with modified UTPs. The annual production amounts and the drug substance production cost per dose is plotted in function of the scale of the production process. The scale identified as technologically feasible and economically viable corresponds to the 30 L bioreactor working volume and the corresponding key performance indicators (KPIs) of annual production and cost per dose values are shown by the grey dot and triangles, respectively. (B) Determining the suitable production scale for a 30 µg/dose RNA vaccine with modified UTPs. Plotting the annual production amounts and cost per dose in function of production scale identified the techno-economically feasible scale at 30 L bioreactor working volume, corresponding KPIs are indicated by the grey dot and triangle. (C) Determining the suitable production scale for a 12 µg/dose RNA vaccine with wild-type UTPs. Plotting the annual production amounts and cost per dose in function of production scale identified the techno-economically feasible scale at 30 L bioreactor working volume, corresponding KPIs are indicated by the grey dot and triangle. (D) Determining the suitable production scale for a 1 µg/dose RNA vaccine with wild-type UTPs. Plotting the annual production amounts and cost per dose in function of production scale identified the techno-economically feasible scale at 7 L bioreactor working volume, corresponding KPIs are indicated by the grey dot and triangle. (E) Determining the suitable production scale for a 0.1 µg/dose RNA vaccine with wild-type UTPs. Plotting the annual production amounts and cost per dose in function of production scale identified the techno-economically feasible scale at 1 L bioreactor working volume, corresponding KPIs are indicated by the grey dot and grey triangle. (F) The impact of the RNA amount per vaccine dose on the annual production amounts and cost per dose.
Figure 3
Figure 3
Resource and production scale requirements for producing 8 billion doses of LNP formulated RNA drug substance per year. Variations in production efficiencies were modelled by changing the production titre by −20% for the low scenario, leaving it at the 5/L baseline value for the medium scenario and increasing it by +20% for the high scenario. The bar charts represent the results for medium scenario and the error bars show the results for the low and high scenarios. (A) Total capital investment cost (CapEx) and annual operating cost (OpEx) required to produce 8 billion doses of RNA DS per annum for the five RNA vaccine types. The five vaccine types, their characteristics and cost-modelling results are shown in the table belonging to the x-axis. (B). Total production scales expressed in L of bioreactor working volume and the number of batches required to meet the RNA DS annual demand of 8 billion doses for the five RNA vaccine types. The five vaccine types and their common techno-economically feasible scales are shown in the table belonging to the x-axis. Additionally, this table also shows the total production scales required for meeting the 8 billion dose of DS annual demand and the number of facilities required to meet the same demand, assuming one production line at the techno-economically feasible scale per facility.
Figure 4
Figure 4
The time required to produced 8 billion doses worth of LNP formulated drug substance for the five RNA vaccine types. The times required per facility are shown on the x-axis and the five vaccine types together with their key features are shown in the table belonging to the y-axis. For this comparison it was assumed that a single facility housing a single production line at the techno-economically feasible scale is used. The error bars represent the low and high productivity scenarios which were obtained by adjusting the titre by ±20% from its baseline value of 5 g/L which corresponds to the medium scenario shown by the vertical bars of the chart.

Similar articles

Cited by

References

    1. World Health Organization DRAFT Landscape of COVID-19 Candidate Vaccines. [(accessed on 12 November 2020)];2020 Available online: https://www.who.int/publications/m/item/draft-landscape-of-covid-19-cand....
    1. Dolgin E. COVID-19 Vaccines Poised for Launch, but Impact on Pandemic Unclear. [(accessed on 26 November 2020)];Nat. Biotechnol. 2020 doi: 10.1038/d41587-020-00022-y. Available online: https://www.nature.com/articles/d41587-020-00022-y. - DOI - PubMed
    1. McKay P.F., Hu K., Blakney A.K., Samnuan K., Brown J.C., Penn R., Zhou J., Bouton C.R., Rogers P., Polra K., et al. Self-amplifying RNA SARS-CoV-2 lipid nanoparticle vaccine candidate induces high neutralizing antibody titers in mice. Nat. Commun. 2020;11:3523. doi: 10.1038/s41467-020-17409-9. - DOI - PMC - PubMed
    1. Vogel A.B., Lambert L., Kinnear E., Busse D., Erbar S., Reuter K.C., Wicke L., Perkovic M., Beissert T., Haas H., et al. Self-Amplifying RNA Vaccines Give Equivalent Protection against Influenza to mRNA Vaccines but at Much Lower Doses. Mol. Ther. 2018;26:26446–26455. doi: 10.1016/j.ymthe.2017.11.017. - DOI - PMC - PubMed
    1. Pardi N., Hogan M.J., Porter F.W., Weissman D. mRNA vaccines—A new era in vaccinology. Nat. Rev. Drug Discov. 2018;17:261–279. doi: 10.1038/nrd.2017.243. - DOI - PMC - PubMed