. 2020 Dec 23;13(1):11.
doi: 10.3390/pharmaceutics13010011.

Delivery of Protein Kinase A by CRISPRMAX and Its Effects on Breast Cancer Stem-Like Properties

Affiliations

Delivery of Protein Kinase A by CRISPRMAX and Its Effects on Breast Cancer Stem-Like Properties

Jun-Nian Zhou et al. Pharmaceutics. .

Abstract

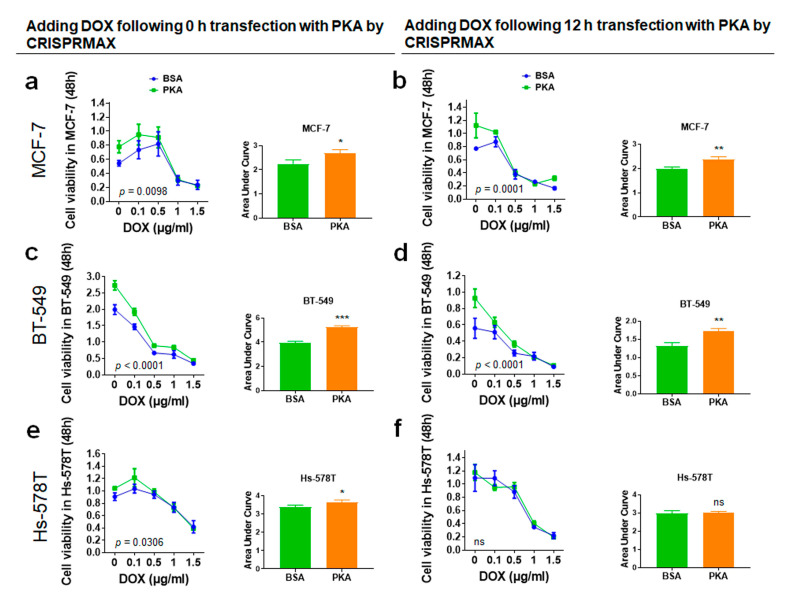
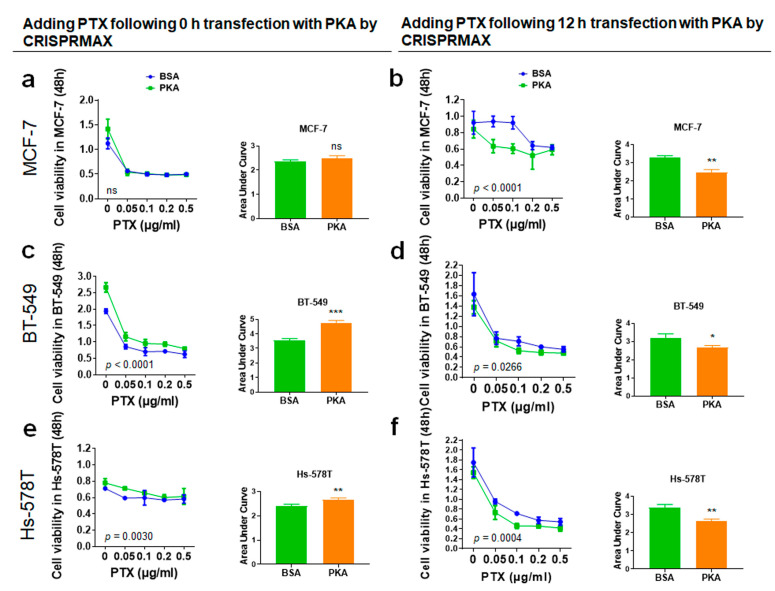
Protein kinase A (PKA) activation has recently been reported to inhibit epithelial-mesenchymal transition (EMT) and cancer stem cell (CSC) ability, which is considered to be responsible for chemoresistance and tumor recurrence in patients. While current studies mainly focus on gene manipulation of the EMT process, the direct delivery of PKA enzymes to cancer cells has never been investigated. Here, we utilize the commercial Lipofectamine CRISPRMAX reagent to directly deliver PKAs to breast cancer cells and evaluate its effects on EMT regulation. We optimized the delivery parameters with fluorescent-labeled bovine serum albumin, and successfully delivered fluorescent PKAs through CRISPRMAX into breast cancer cells. Then, we evaluated the biological effects by immunofluorescence, flow cytometry, mammosphere assay, and chemoresistance assay. Our data showed the expression of EMT-related markers, α-smooth muscle actin and N-cadherin, was downregulated after CRISPRMAX-PKA treatment. Although the CD44+/CD24- population did not change considerably, the size of mammospheres significantly decreased. In paclitaxel and doxorubicin chemoresistance assays, we noticed PKA delivery significantly inhibited paclitaxel resistance rather than doxorubicin resistance. Taken together, these results suggest our direct enzyme delivery can be a potential strategy for inhibiting EMT/CSC-associated traits, providing a safer approach and having more clinical translational efficacy than gene manipulation. This strategy will also facilitate the direct testing of other target enzymes/proteins on their biological functions.

Keywords: CRISPRMAX; cancer stem cells; chemoresistance; drug delivery; epithelial-mesenchymal transition; protein kinase A.


Conflict of interest statement

The authors declare no conflict of interest.

Figures

Figure 1
Figure 1
Characterization of PKAs- and BSAs-loaded CRISPRMAX complexes. (a) TEM images of CRISPRMAX-BSAs, CRISPRMAX-PKAs and null CRISPRMAX; the yellow circles indicate the location of the complexes (scale bars, 500 nm in BSAs and PKAs, and 1 μm in null complexes). (b) CLSM images of BSA-Alexa 680 and CRISPRMAX-BSA-Alexa 680 in a 2-D display under the same parameters; the right panel is a partial enlargement of CRISPRMAX-BSA-Alexa 680 in a 2-D display (scale bars, 20 μm in the left and middle panels; 10 μm in the right panel). (c) A CLSM image of CRISPRMAX-BSA-Alexa 680 in a 3-D display (scale bar, 50 μm). (d) The encapsulation efficiency of CRISPRMAX based on the calculation of loaded BSA-Alexa 680. (e) The release efficiency of CRISPRMAX based on the calculation of loaded BSA-Alexa 680 at the indicated time points.
Figure 2
Figure 2
Establishment of a CRISPRMAX-based protein delivery system using the Alexa 680-labeled BSA as a model protein. (a) Bright-field images of three different mesenchymal breast cancer cell lines were taken at 200× magnification (scale bars, 200 μm). (b) Single-parameter histograms for comparison of the negative control (cells transfected with ddH2O, blue) and the positive population (the cell of interest, red): (left) BT-549 cells were seeded at the density of 8000 cells/well, and FCM was conducted at day 4 after transfection with fluorescent BSAs; (middle) MDA-MB-231 cells were seeded at the density of 4000 cells/well, and FCM was conducted at day 2 after transfection with fluorescent BSAs; (right) Hs-578T cells were seeded at the density of 8000 cells/well, and FCM was conducted at day 2 after transfection with fluorescent BSAs. Each kind of cell was transfected with 500 ng of BSA-Alexa Fluor 680 per well through CRISPRMAX. (c) CLSM analysis of BT-549 cells transfected with fluorescent BSAs delivered by CRISPRMAX. Fluorescent excitation and emission for BSA-Alexa Flour 680 were 633 and 702 nm, respectively. Confocal images were taken at 200× magnification (scale bars, 50 μm). (d) Cellular uptake efficiency of BSA-Alexa Fluor 680 delivered by CRISPRMAX within 24 h in BT-549 cells. CLSM, confocal laser scanning microscopy.
Figure 3
Figure 3
Immunofluorescence analysis of PKA expression in BT-549 cells after CRISPRMAX-based PKA delivery. (a) PKA expression was examined by immunofluorescence analysis using CLSM; 3 days after CRISPRMAX-based PKA delivery vs. CRISPRMAX-based BSA delivery (control) in BT-549 cells. Cell nuclei were visualized by DAPI. Confocal images were taken at 200× magnification (scale bars, 50 μm). (b) Quantitative analysis of the mean of florescence intensity of PKA performed by ImageJ (n = 3), and the mean of fluorescence intensity of PKA was significantly higher compared with BSA group, p = 0.00459, ** p < 0.01. The quantitative data were presented as Mean ± SD.
Figure 4
Figure 4
Expression analysis of E-cadherin, N-cadherin, and α-SMA after PKA delivery observed by CLSM. E-cadherin, N-cadherin, and α-SMA expression were examined by immunofluorescence analysis using confocal laser scanning microscopy 5 days after CRISPRMAX-based delivery, with the control (BSA) (left panel) vs. with PKA (right panel). Cell nuclei were visualized by DAPI. Confocal images were taken at 200× magnification (scale bars, 50 μm).
Figure 5
Figure 5
FCM analysis of the CD44+/CD24 population in breast cancer cells after introducing CRISPRMAX-PKAs or CRISPRMAX-BSAs. (a) MCF-7 cells; (b) MDA-MB-231 cells; (c) BT-549 cells; (d) Hs-578T cells. The CD44+/CD24 antigenic phenotype was shown in the Q3 area (at the right lower corner of the individual image). For isotype group: cells transfected with ddH2O through CRISPRMAX as controls were incubated with the same amount of APC-isotype IgG and PE-isotype IgG with CD44-APC and CD24-PE antibodies; as for the BSA and PKA groups, the cells transfected with BSAs or PKAs were incubated with CD44-APC and CD24-PE antibodies. X-axis presents CD44-APC of the cells; Y-axis shows CD24-PE of the cells. All cells were delivered with PKAs or BSAs for 3 to 5 days. FCM, flow cytometry.
Figure 6
Figure 6
Mammosphere formation analysis of cells after CRISPRMAX-PKAs or CRISPRMAX-BSAs delivery. (a) Typical bright-field images of MSs were taken for each group (CRISPRMAX-PKAs and CRISPRMAX-BSAs) 1 week after culturing in mamosphere culture medium; for 40× and 200× magnification, the scale bar was 1000 and 200 μm, respectively. (b) Whisker-box plot of the number of MSs (diameter > 100 μm) for the CRISPRMAX-BSAs-delivered group and CRISPRMAX-PKAs-delivered group. (c) The bar graph of the number of MSs (diameter > 100 μm) for the CRISPRMAX-BSAs-delivered group and CRISPRMAX-PKAs-delivered group. The number of MSs in the PKA group was significantly lower compared with the BSA group, p = 0.0214, * p < 0.05. Data were presented as Mean ± SD.
Figure 7
Figure 7
Chemoresistance evaluation of DOX in the cells following 0 or 12 h transfection with CRISPRMAX-PKAs. (a,c,e) Adding DOX following 0 h of transfection with CRISPRMAX-PKAs: MCF-7, BT-549, and Hs-578T cells were transfected with PKA by CRISPRMAX and treated with DOX at 0, 0.1, 0.5, 1, and 1.5 μg/mL simultaneously for 48 h; the results of AUC analyses in MCF-7, BT-549, and Hs-578T were compared with the BSA control group (p = 0.02094, p = 0.0002, p = 0.0425, respectively). (b,d,f) Cells were treated with DOX for 48 h following 12 h of transfection with CRISPRMAX-PKAs; the results of AUC analyses in MCF-7, BT-549, and Hs-578T were compared with the BSA control group (p = 0.0067, p = 0.0043, p = 0.8200, respectively). AUC analyses were used to compare the effectiveness of the drug effect between the BSA and PKA group. All treatments were performed with WST-1 cell viability assays and AUC analyses. Data were presented as Mean ± SD (n = 3 replicates for transfection with the PKA and BSA group). In total, 500 ng of PKA and BSA (control) per setup was used, and the PKA group was compared with the BSA control in each setup. Statistical significances were evaluated using unpaired two-tailed t test; * p < 0.05, ** p < 0.01, *** p < 0.001, and ns, not significant. DOX, doxorubicin.
Figure 8
Figure 8
Chemoresistance assay of PTX in the cells following 0 or 12 h of transfection with CRISPRMAX-PKAs. (a,c,e) Adding PTX following 0 h of transfection with CRISPRMAX-PKAs: MCF-7, BT-549, and Hs-578T cells were transfected with PKA by CRISPRMAX and treated with PTX at 0, 0.05, 0.1, 0.2, and 0.5 μg/mL simultaneously for 48 h; the results of AUC analyses in MCF-7, BT-549, and Hs-578T were compared with the BSA control group (p = 0.1652, p = 0.0004, p = 0.0088, respectively). (b,d,f) Cells were treated with PTX for 48 h following 12 h of transfection with CRISPRMAX-PKAs; the results of AUC analyses in MCF-7, BT-549, and Hs-578T were compared with the BSA control group (p = 0.0018, p = 0.0290, p = 0.0031, respectively). AUC analyses were used to compare the effectiveness of drug effect between the BSA and PKA groups. All treatments were performed with WST-1 cell viability assays and AUC analyses. Data were presented as Mean ± SD (n = 3 replicates for transfection with the PKA and BSA group). In total, 500 ng of PKA and BSA (control) per setup was used, and the PKA group was compared with the BSA control in each setup. Statistical significances were evaluated using unpaired two-tailed t test; * p < 0.05, ** p < 0.01, *** p < 0.001, and ns, not significant. PTX, paclitaxel.
Figure 9
Figure 9
Cell viability results of normal breast cells MCF-10A treated with PTX or DOX following 24 h of transfection with CRISPRMAX-PKAs or CRISPRMAX-BSAs. (a) After 24 h of transfection with CRISPRMAX-PKAs, the MCF-10A cells were treated with PTX at 0, 0.01, 0.05, 0.1, and 0.4 μg/mL for 48 h. (b) After 24 h of transfection with CRISPRMAX-PKAs, MCF-10 cells were treated with DOX at 0, 0.01, 0.05, 0.1, and 0.4 μg/mL for 48 h; the results of AUC analyses in the PTX- or DOX-treated MCF-10A cells following 24 h of transfection with CRISPRMAX-PKAs were compared with the BSA control group (p = 0.9619, p = 0.3410, respectively). All treatments were performed with WST-1 cell viability assays and AUC analyses. AUC analyses were used to compare the effectiveness of the drug effect between the BSA and PKA groups. Data were presented as Mean ± SD (n = 3 replicates for transfection with the PKA and BSA group). In total, 500 ng of PKA and BSA (control) per setup was used, and the PKA group was compared with the BSA control in each setup. Statistical significances were evaluated using unpaired two-tailed t test; ns, not significant. PTX, paclitaxel; DOX, doxorubicin.
Figure 10
Figure 10
An overview schematic diagram of the study. PKAs and CRISPRMAX had formed as lipid nanoparticle complexes, and then these complexes were added to breast cancer cells. At the same time, chemotherapy drugs PTX or DOX were added (at 0 h transfection time point) into the cells for 48 h, respectively. The WST-1 assay was performed for testing the cell viability. The results showed that compared with the CRISPRMAX-BSAs control group added with the same drug, cell viability increased regardless of whether PTX or DOX was added. When CRISPRMAX-PKAs were added into cells for 12 h, the chemotherapy drug (PTX or DOX) was also added (at 12 h), respectively; the cells were treated for 48 h. WST-1 cell viability results showed that compared with the CRISPRMAX-BSAs control group added with the same drug, the cell viability of the PTX group was significantly decreased compared to the DOX group. Then, 24 h after CRISPRMAX-PKAs delivery into the cells, these cells were digested with trypsin and seeded in a confocal dish for 3 days, followed by immunofluorescence analysis of PKA expression. The results showed that the expression of PKAs was upregulated compared with the CRISPRMAX-BSAs control group; the expression of EMT mesenchymal markers, N-cadherin and α-SMA, was downregulated. Part of the cells were seeded in an ultra-low attachment dish at low density and subjected to mammosphere formation assay; these cells were cultured in mammosphere culture medium and continued to grow for 7 days, the results showed that CRISPRMAX-PKAs-delivered cells-derived mammospheres were decreased in size compared with the CRISPRMAX-BSAs control group.

Similar articles

Cited by

References

    1. Desai A., Yan Y., Gerson S.L. Concise Reviews: Cancer Stem Cell Targeted Therapies: Toward Clinical Success. Stem Cells Transl. Med. 2019;8:75–81. doi: 10.1002/sctm.18-0123. - DOI - PMC - PubMed
    1. Mani S.A., Guo W., Liao M.-J., Eaton E.N., Ayyanan A., Zhou A.Y., Brooks M., Reinhard F., Zhang C.C., Shipitsin M., et al. The Epithelial-Mesenchymal Transition Generates Cells with Properties of Stem Cells. Cell. 2008;133:704–715. doi: 10.1016/j.cell.2008.03.027. - DOI - PMC - PubMed
    1. Polyak K., Weinberg R.A. Transitions between epithelial and mesenchymal states: Acquisition of malignant and stem cell traits. Nat. Rev. Cancer. 2009;9:265–273. doi: 10.1038/nrc2620. - DOI - PubMed
    1. Voon D.C.-C., Huang R.Y., Jackson R.A., Thiery J.P. The EMT spectrum and therapeutic opportunities. Mol. Oncol. 2017;11:878–891. doi: 10.1002/1878-0261.12082. - DOI - PMC - PubMed
    1. Vellard M. The enzyme as drug: Application of enzymes as pharmaceuticals. Curr. Opin. Biotechnol. 2003;14:444–450. doi: 10.1016/S0958-1669(03)00092-2. - DOI - PubMed