. 2020 Dec 22;13(1):4.
doi: 10.3390/cancers13010004.

A Comprehensive Molecular and Clinical Analysis of the piRNA Pathway Genes in Ovarian Cancer

Affiliations

A Comprehensive Molecular and Clinical Analysis of the piRNA Pathway Genes in Ovarian Cancer

Eunice Lee et al. Cancers (Basel). .

Abstract

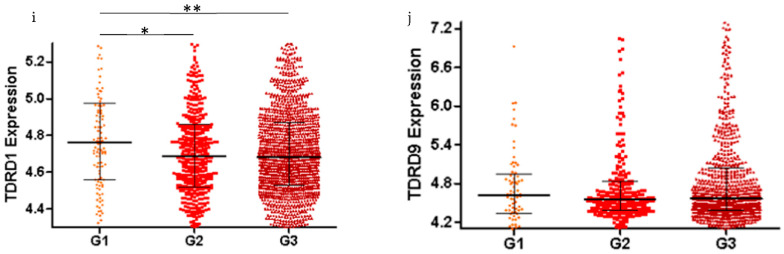
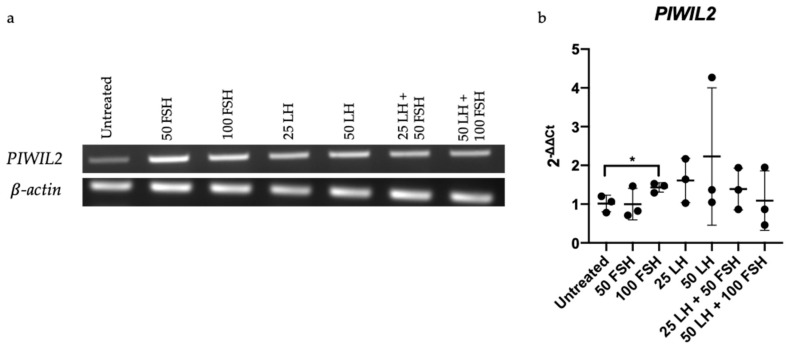
Ovarian cancer (OC) is one of the most lethal gynecological malignancies, yet molecular mechanisms underlying its origin and progression remain poorly understood. With increasing reports of piRNA pathway deregulation in various cancers, we aimed to better understand its role in OC through a comprehensive analysis of key genes: PIWIL1-4, DDX4, HENMT1, MAEL, PLD6, TDRD1,9 and mutants of PIWIL1 (P1∆17) and PIWIL2 (PL2L60). High-throughput qRT-PCR (n = 45) and CSIOVDB (n = 3431) showed differential gene expression when comparing benign ovarian tumors, low grade OC and high grade serous OC (HGSOC). Significant correlation of disparate piRNA pathway gene expression levels with better progression free, post-progression free and overall survival suggests a complex role of this pathway in OC. We discovered PIWIL3 expression in chemosensitive but not chemoresistant primary HGSOC cells, providing a potential target against chemoresistant disease. As a first, we revealed that follicle stimulating hormone increased PIWIL2 expression in OV-90 cells. PIWIL1, P1∆17, PIWIL2, PL2L60 and MAEL overexpression in vitro and in vivo decreased motility and invasion of OVCAR-3 and OV-90 cells. Interestingly, P1∆17 and PL2L60, induced increased motility and invasion compared to PIWIL1 and PIWIL2. Our results in HGSOC highlight the intricate role piRNA pathway genes play in the development of malignant neoplasms.

Keywords: chemoresistance; follicle stimulating hormone; invasion; ovarian cancer; patient survival; piRNA pathway; therapeutic targets.


Conflict of interest statement

The authors declare no conflict of interest. The funders had no role in the design of the study; in the collection, analyses, or interpretation of data; in the writing of the manuscript, or in the decision to publish the results.

Figures

Figure 1
Figure 1
Workflow diagram of this study showing analysis performed for investigating expression differences and effects of the piRNA pathway genes in multiple aspects of OC.
Figure 2
Figure 2
piRNA pathway gene expression in benign serous cystadenoma and high grade serous ovarian cancer (HGSOC) tumors. (ad) Among the 4 PIWIL genes, only PIWIL3 had no significant difference between benign and cancerous tumors. PIWIL1 had increased expression while PIWIL2 and PIWIL4 had decreased expression between benign and cancerous samples. (ej) Comparing expression of benign to cancerous tumors, HENMT1 and MAEL had significantly increased expression while TDRD1 expression was significantly decreased. DDX4, PLD6 and TDRD9 presented similar expression levels across benign and cancerous tumors. All Ct scores were normalized to the geomean of housekeepers, TBP and GUSB. A median line was used to plot the respective dataset. Benign (n = 16), cancer (early and late HGSOC, n = 29), early HGSOC (stages 1,2, n = 12) and late HGSOC (stage 3, n = 17). Statistical tests Mann−Whitney U was used to analyze benign versus cancer while Kruskal−Wallis (non-normal distribution) or one-way ANOVA (normal distribution) were used accordingly when comparing expression differences in benign, early and late stage HGSOC. * p < 0.05; ** p < 0.005; *** p < 0.0005; **** p < 0.0001.
Figure 3
Figure 3
Using the CSIOVDB public microarray database (n = 3431) to determine piRNA pathway gene expression in grades 1, 2 and 3 (G1, G2 and G3) of all ovarian cancer subtypes. (ad) Among the 4 PIWIL genes, PIWIL1 and PIWIL3 showed significantly lower expression in the high grade (G2/G3) disease as compared to low grade (G1). PIWIL2 and PIWIL4 had similar expression levels in G1, G2 and G3 ovarian cancer samples. (e,gj) PLD6 and TDRD1 also had significantly decreased expression when comparing low grade to high grade. DDX4, MAEL and TDRD9 had no significant difference in expression across G1, G2 and G3. (f) HENMT1, in contrast, had significantly higher expression in G2 and G3 as compared to G1. Mann−Whitney U test was used to assess significance. * p < 0.05; ** p < 0.005; *** p < 0.0005; **** p < 0.0001.
Figure 3
Figure 3
Using the CSIOVDB public microarray database (n = 3431) to determine piRNA pathway gene expression in grades 1, 2 and 3 (G1, G2 and G3) of all ovarian cancer subtypes. (ad) Among the 4 PIWIL genes, PIWIL1 and PIWIL3 showed significantly lower expression in the high grade (G2/G3) disease as compared to low grade (G1). PIWIL2 and PIWIL4 had similar expression levels in G1, G2 and G3 ovarian cancer samples. (e,gj) PLD6 and TDRD1 also had significantly decreased expression when comparing low grade to high grade. DDX4, MAEL and TDRD9 had no significant difference in expression across G1, G2 and G3. (f) HENMT1, in contrast, had significantly higher expression in G2 and G3 as compared to G1. Mann−Whitney U test was used to assess significance. * p < 0.05; ** p < 0.005; *** p < 0.0005; **** p < 0.0001.
Figure 4
Figure 4
piRNA pathway gene expression in chemosensitive (n = 5) and chemoresistant (n = 7) primary HGSOC cells. (c) PIWIL3 was not expressed in chemoresistant cells but was expressed in most of the chemosensitive cells (n = 4). (a,b,dj) While the other genes had no significant change in expression, it was observed that they had varying degrees of differential expression. All Ct scores were normalized to the geomean of housekeepers, TBP and GUSB. Either a median (non-normal distribution) or mean (normal distribution) line was plotted. Statistical tests Mann−Whitney U (non-normal distribution) or unpaired t-test (normal distribution) were used accordingly. * p < 0.05.
Figure 5
Figure 5
PIWIL2 expression in OV-90 cells before and after a 24-h follicle stimulating hormone (FSH) and luteinizing hormone (LH) treatment. (a) RT-PCR: PIWIL2 expression increased upon individual and combination treatment of FSH and LH. (b) qRT-PCR: PIWIL2 had a significant increase in expression after 100 mIU/mL FSH treatment. Ct scores were normalized to housekeeper, HPRT1 and the average of untreated cells for 2−∆∆CT. Each colored circle represents one biological replicate with technical duplicate where three biological replicates were carried out per treatment group. Labels with numerical values indicate concentration (mIU/mL) of hormone used. Mean with standard deviation was plotted. Unpaired t-test was used to assess significance. * p < 0.05.
Figure 6
Figure 6
In vitro motility and invasion of OVCAR-3 and OV-90 cells after overexpressing piRNA pathway genes and its mutants (n = 21–24 per cell line per transfection). (a,b) Motility: PIWIL1 and PL2L60 (PIWIL2 mutant) overexpression significantly decreased OVCAR-3 motility while PIWIL2 overexpression significantly decreased motility in both OVCAR-3 and OV-90. OVCAR-3 cells overexpressing P1∆17 (PIWIL1 mutant) had increased motility compared to empty vector and was significantly more motile than PIWIL1 overexpression. (c,d) Invasion: overexpression of PIWIL1, PIWIL2, PL2L60 and MAEL significantly decreased OVCAR-3 invasion while PIWIL2 overexpression significantly decreased OV-90 invasion. OV-90 cells overexpressing PL2L60 had significantly increased invasion compared to PIWIL2 overexpression. All fold changes were calculated relative to empty vector. Three biological replicates were carried out per cell line per transfection group. Bar represents median values plotted for all the datasets. Statistical tests Mann−Whitney U (non-normal distribution) or unpaired t-test (normal distribution) were used accordingly. * p < 0.05; ** p < 0.005; *** p < 0.0005; **** p < 0.0001.
Figure 7
Figure 7
The in vivo invasion analysis using the chicken chorioallantoic membrane (CAM) assay. (af) CD44 stained OV-90 cells transfected with (a) empty vector (pcDNA3.1(+)) and overexpression constructs, (b) PIWIL1, (c) P1∆17, (d) PIWIL2, (e) PL2L60 and (f) MAEL. CAMs were counterstained with haematoxylin. Invasion was quantified by the number of OV-90 cells that successfully breached the ECT and beyond (* marked next to breached area). CM = cancer cells mixed with matrigel, ECT = ectoderm, MES = mesoderm, END = endoderm. Scale bar = 100 µm. (g) Significantly more CAM area was invaded by P1∆17 and PL2L60 overexpressing OV-90 cells. Both mutants were more invasive than its respective wildtype form where only overexpression of P1∆17 was significant. n = 4–18 per construct transfected and carried out in biological duplicates. Statistical tests Mann−Whitney U (non-normal distribution) or unpaired t-test (normal distribution) were used accordingly. * p < 0.05; *** p < 0.0005.

Similar articles

Cited by

References

    1. Bray F., Ferlay J., Soerjomataram I., Siegel R.L., Torre L.A., Jemal A. Global cancer statistics 2018: GLOBOCAN estimates of incidence and mortality worldwide for 36 cancers in 185 countries. CA A Cancer J. Clin. 2018;68:394–424. doi: 10.3322/caac.21492. - DOI - PubMed
    1. Torre L.A., Trabert B., DeSantis C.E., Miller K.D., Samimi G., Runowicz C.D., Gaudet M.M., Jemal A., Siegel R.L. Ovarian cancer statistics, 2018. CA A Cancer J. Clin. 2018;68:284–296. doi: 10.3322/caac.21456. - DOI - PMC - PubMed
    1. Kurman R.J., Visvanathan K., Roden R., Wu T.C., Shih I.-M. Early Detection and Treatment of Ovarian Cancer: Shifting from Early Stage to Minimal Volume of Disease Based on a New Model of Carcinogenesis. Am. J. Obstet. Gynecol. 2008;198:351–356. doi: 10.1016/j.ajog.2008.01.005. - DOI - PMC - PubMed
    1. Mertens-Walker I., Baxter R.C., Marsh D.J. Gonadotropin signalling in epithelial ovarian cancer. Cancer Lett. 2012;324:152–159. doi: 10.1016/j.canlet.2012.05.017. - DOI - PubMed
    1. Gharwan H., Bunch K.P., Annunziata C.M. The role of reproductive hormones in epithelial ovarian carcinogenesis. Endocr. Relat. Cancer. 2015;22:R339–R363. doi: 10.1530/ERC-14-0550. - DOI - PubMed