. 2020 Dec 22;10(1):2.
doi: 10.3390/antiox10010002.

Chronic Metabolic Acidosis Elicits Hypertension via Upregulation of Intrarenal Angiotensin II and Induction of Oxidative Stress

Affiliations

Chronic Metabolic Acidosis Elicits Hypertension via Upregulation of Intrarenal Angiotensin II and Induction of Oxidative Stress

Dinesh Aryal et al. Antioxidants (Basel). .

Abstract

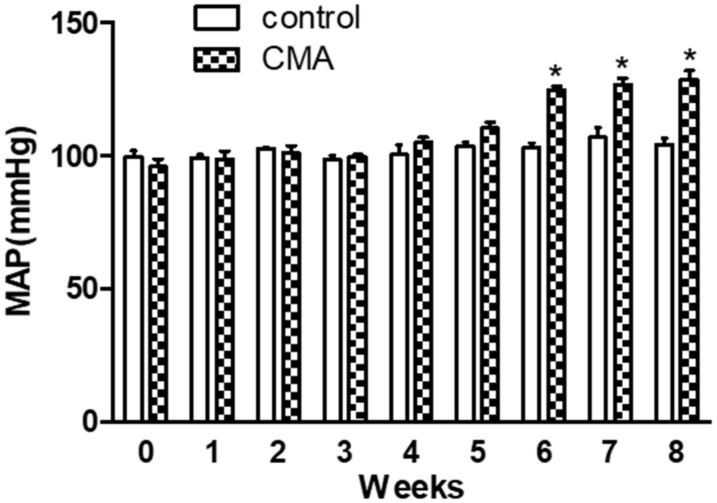
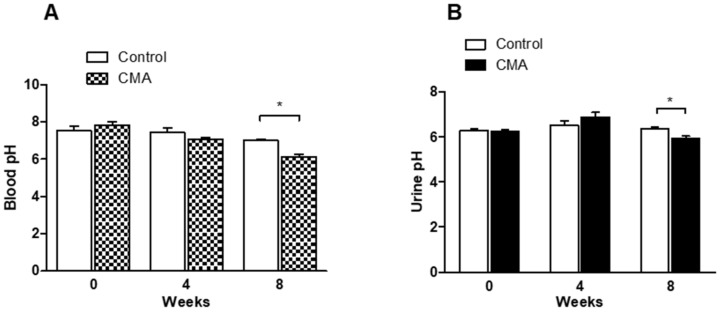
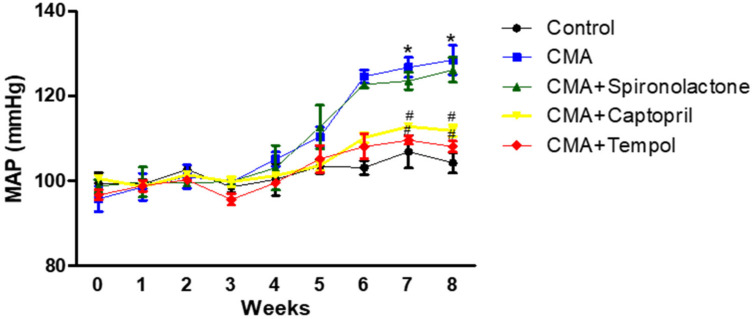
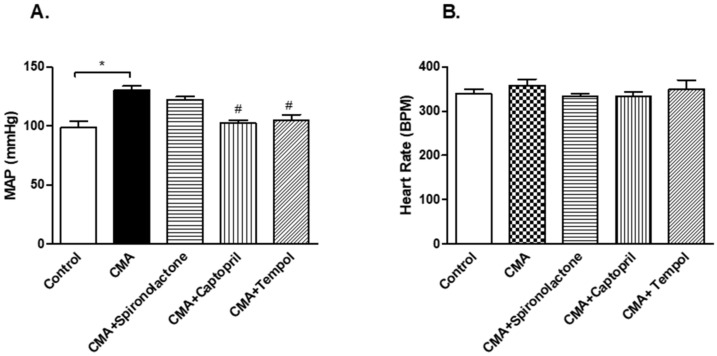
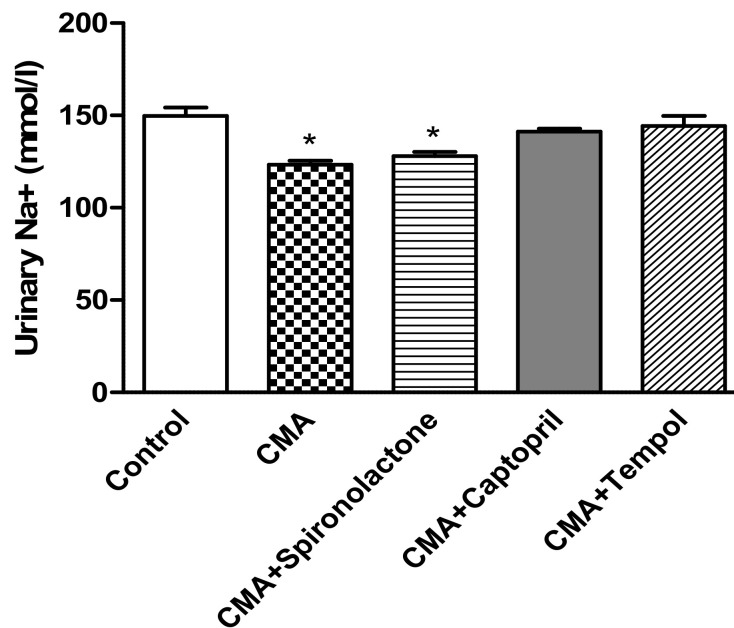
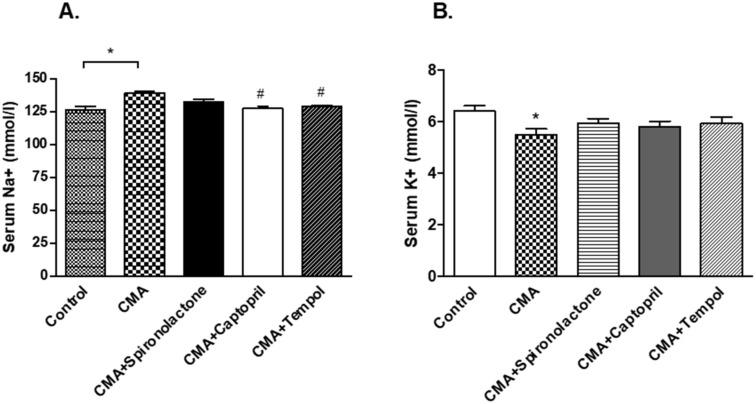
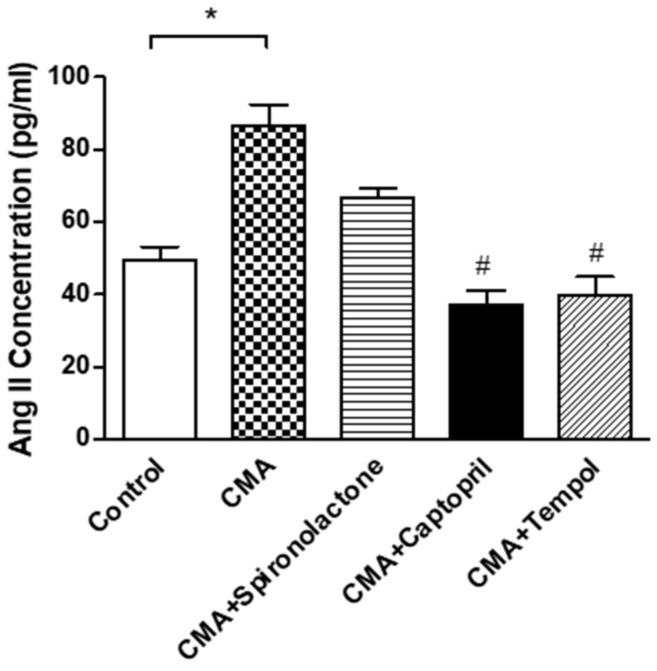
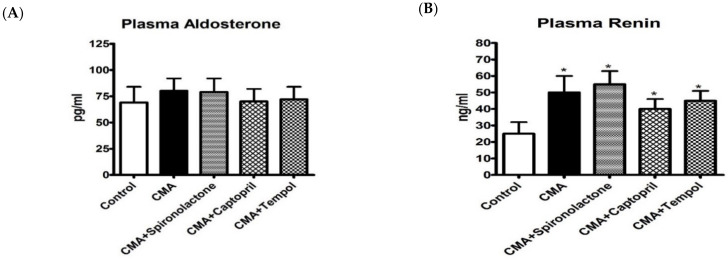
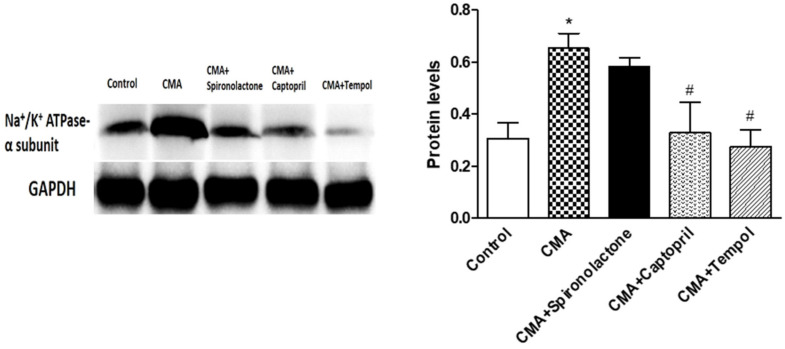
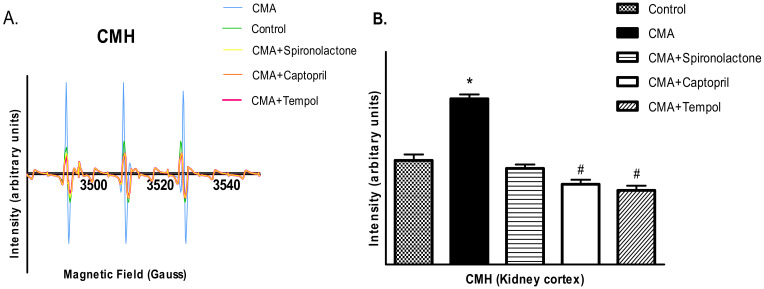
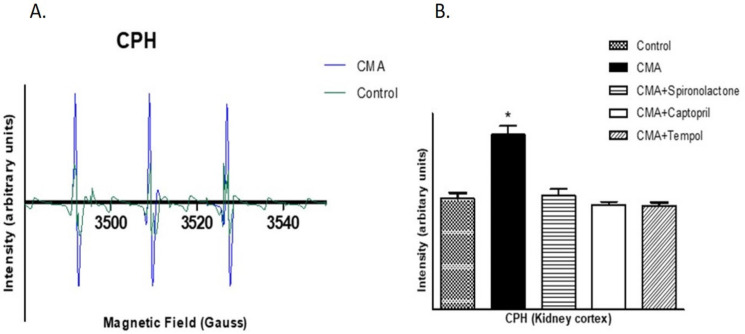
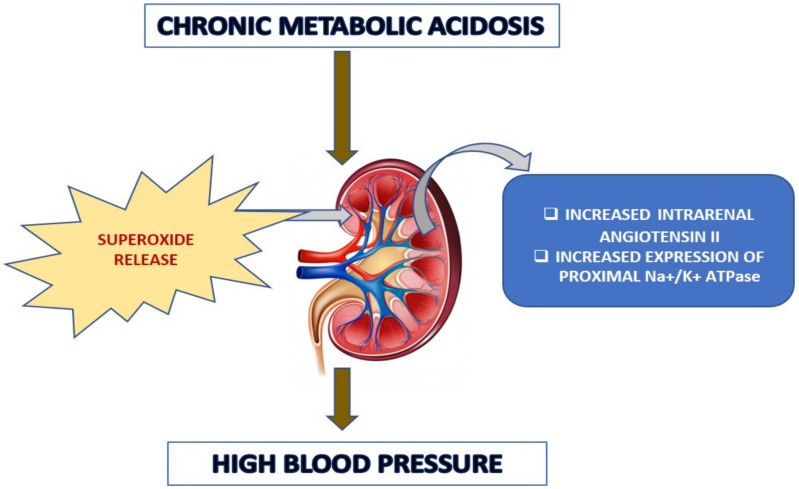
Chronic metabolic acidosis (CMA) can be a consequence of persistent hypertension but could potentially play a role in invoking hypertension. Currently, there is a scarcity of studies examining the outcome of induced chronic acidosis on blood pressure regulation. This study investigates CMA as a cause of hypertension. Chronic acidosis was induced in Sprague Dawley rats (100-150 g) by providing a weak acid solution of 0.28 M ammonium chloride (NH4Cl) in tap water for 8 weeks. To determine whether the rats were acidotic, blood pH was measured, while blood pressure (BP) was monitored by tail-cuff plethysmography weekly. Rats were divided into five groups: control, CMA, CMA ± spironolactone, captopril, and tempol. Serum sodium and potassium; renal interstitial fluid (for Angiotensin II concentration); and kidney proximal tubules (for Na+/K+ ATPase- α1 concentration) were analyzed. Reactive oxygen species (ROS) were detected in renal cortical homogenates using electron paramagnetic resonance (EPR). In the CMA rats, a sustained elevation in mean arterial pressure (MAP) associated with a significant decrease in blood pH was observed compared to that of control over the 8 weeks. A significant decrease in MAP was observed in acidotic rats treated with captopril/tempol, whereas spironolactone treatment caused no decrease in MAP as compared to that of the CMA group. The interstitial angiotensin II was increased in the CMA group but decreased in the CMA with captopril and tempol groups. In addition, the urinary sodium was decreased, and the serum sodium levels increased significantly in the CMA groups as compared to that of control. However, the acidotic groups with captopril and tempol showed reduced levels of serum sodium and an elevation in urinary sodium as compared to that of the CMA group. In addition, there was a significant increase in plasma renin and no change in plasma aldosterone in the CMA group with no significant differences in plasma renin or aldosterone observed during spironolactone, captopril, or tempol treatments. The increased expression of Na+/K+ ATPase-α1 in the CMA group suggests that active transport of Na+ to the blood could be causative of the observed hypertension. Furthermore, the EPR analysis confirmed an elevation in superoxide (O2-) radical levels in the CMA group, but the tempol/captopril treated acidotic groups showed less (O2-) compared to that of either the CMA group or control. Taken together, our data suggest that induction of CMA could potentially be causative of hypertension, while the mechanisms underlying the increased BP could be through the activation of intrarenal Ang II and induction of oxidative stress.

Keywords: angiotensin II; hypertension; metabolic acidosis.


Conflict of interest statement

The authors declare there is no conflict of interest regarding the publication of this paper. The funders had no role in the design of the study; in the collection, analyses, or interpretation of data; in the writing of the manuscript, or in the decision to publish the results.

Figures

Figure 1
Figure 1
Blood pressure measurement (tail-cuff). Each bar represents values expressed as mean ± SEM. The change in mean arterial pressure (MAP) was considered significant (*) when p < 0.05 between two groups. The data were analyzed using two-way ANOVA followed by Bonferroni posttests.
Figure 2
Figure 2
Blood (A) and urine (B) pH measurements. Each bar represents values expressed as mean ± SEM. The change in pH was considered significant (*) when p < 0.05 between two groups. The data were analyzed using two-way ANOVA followed by Bonferroni posttests. Measurement of blood pH (A) and urine pH (B) in control and chronic metabolic acidosis (CMA) animals.
Figure 3
Figure 3
Blood pressure measurements for treatment groups (tail-cuff). Each plot represents values expressed as mean ± SEM. The change in MAP was considered significant (*) when p < 0.05 (control vs. CMA) groups and (#) p < 0.05 (CMA vs. CMA + captopril or CMA + tempol) groups. The data were analyzed using two-way ANOVA followed by Bonferroni multiple comparison test among all five groups.
Figure 4
Figure 4
Inline-pressure transducer readings for MAP and heart rate. Each bar represents values expressed as mean ± SEM. (A) The change in MAP was considered significant when * p < 0.05 (control vs CMA) groups and # p < 0.05 (CMA vs. CMA + captopril or CMA + tempol) groups. (B) No significant changes in heart rates among the groups. The data were analyzed using one-way ANOVA followed by Tukey’s multiple comparison test among all five groups. t-test was performed to compare two individual groups.
Figure 5
Figure 5
Urinary sodium analysis. Each bar represents values expressed as mean ± SEM. The change in urine sodium levels were considered significant (*) when p < 0.05 between groups. The data were analyzed using one-way ANOVA followed by Tukey’s multiple comparison test among all five groups.
Figure 6
Figure 6
Serum sodium and potassium levels. Each bar represents values expressed as mean ± SEM. (A) The changes in serum sodium levels were considered significant when * p < 0.05 (control vs. CMA) groups and # p < 0.05 (CMA vs. CMA + captopril or CMA + tempol) groups. (B) The changes in serum potassium levels were significant when * p < 0.05 (Control vs. CMA) groups. The data were analyzed using one-way ANOVA followed by Tukey’s multiple comparison test among all five groups.
Figure 7
Figure 7
Interstitial fluid analysis for Angiotensin II concentration. Each bar represents values expressed as mean ± SEM. The changes in interstitial Ang II concentrations were considered significant when * p < 0.05 (control vs. CMA) groups and # p < 0.05 (CMA vs. CMA + captopril or CMA + tempol) groups. The data were analyzed using one-way ANOVA followed by Tukey’s multiple comparison test among all five groups.
Figure 8
Figure 8
Plasma aldosterone (A) and plasma renin (B) analysis. Each bar represents values expressed as mean ± SEM. The changes in plasma aldosterone and renin were considered significant when * p < 0.05 (control vs. CMA) groups. The data were analyzed using one-way ANOVA followed by Tukey’s multiple comparison test among all five groups.
Figure 9
Figure 9
Periodic acid-Schiff (PAS) staining of kidney cortex sections.
Figure 10
Figure 10
The protein expression of Na+/K+ ATPase in the renal proximal tubule. Each bar represents values expressed as mean ± SEM. The changes in protein concentrations were considered significant (*) when p < 0.05 (control vs. CMA) groups and (#) p < 0.05 (CMA vs. CMA + captopril or CMA + tempol) groups. The data were analyzed using one-way ANOVA followed by Tukey’s multiple comparison tests among all five groups.
Figure 11
Figure 11
Electron paramagnetic resonance (EPR) analysis for the detection of superoxide and peroxynitrite free radicals. (A,B) show the EPR signal intensities and relative EPR signal area quantification (arbitrary units), respectively, for superoxide radicals.
Figure 12
Figure 12
EPR analysis for peroxynitrite. (A,B) show the EPR intensities and the quantified EPR signal area of the first derivative signals, respectively, for peroxynitrite.
Figure 13
Figure 13
Schematic representation of possible pathophysiological routes of acidosis-induced increased blood pressure.

References

    1. Foëx P., Sear J. Hypertension: Pathophysiology and treatment. Contin. Educ. Anaesth. Crit. Care Pain. 2004;4:71–75. doi: 10.1093/bjaceaccp/mkh020. - DOI
    1. Beevers G., Lip G.Y., O’Brien E. ABC of hypertension: The pathophysiology of hypertension. BMJ. 2001;322:912–916. doi: 10.1136/bmj.322.7291.912. - DOI - PMC - PubMed
    1. Murakami K., Sasaki S., Takahashi Y., Uenishi K. Association between dietary acid-base load and cardiometabolic risk factors in young Japanese women. Br. J. Nutr. 2008;100:642–651. doi: 10.1017/S0007114508901288. - DOI - PubMed
    1. Boedtkjer E., Aalkjaer C. Disturbed acid-base transport: An emerging cause of hypertension. Front. Physiol. 2013;4:388. doi: 10.3389/fphys.2013.00388. - DOI - PMC - PubMed
    1. Bhagavan N.V., Ha C.E. Essentials of Medical Biochemistry. 2nd ed. Elsevier Inc.; Amsterdam, The Netherlands: 2015. p. 752.

LinkOut - more resources