. 2020 Dec 22;11(1):2.
doi: 10.3390/diagnostics11010002.

Hydrophilic Biocompatible Poly(Acrylic Acid-co-Maleic Acid) Polymer as a Surface-Coating Ligand of Ultrasmall Gd2O3 Nanoparticles to Obtain a High r1 Value and T1 MR Images

Affiliations

Hydrophilic Biocompatible Poly(Acrylic Acid-co-Maleic Acid) Polymer as a Surface-Coating Ligand of Ultrasmall Gd2O3 Nanoparticles to Obtain a High r1 Value and T1 MR Images

Yeong-Ji Jang et al. Diagnostics (Basel). .

Abstract

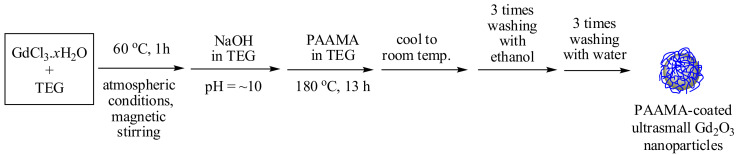
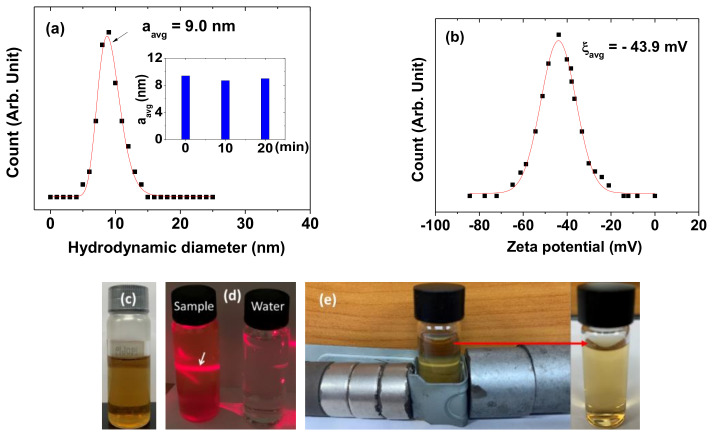
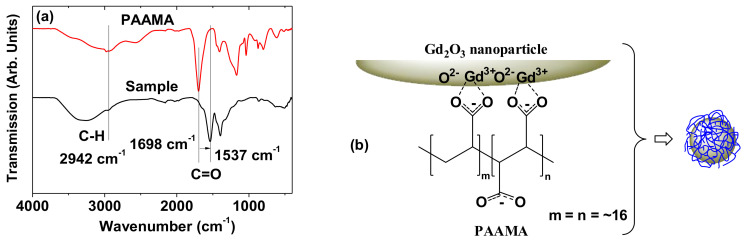
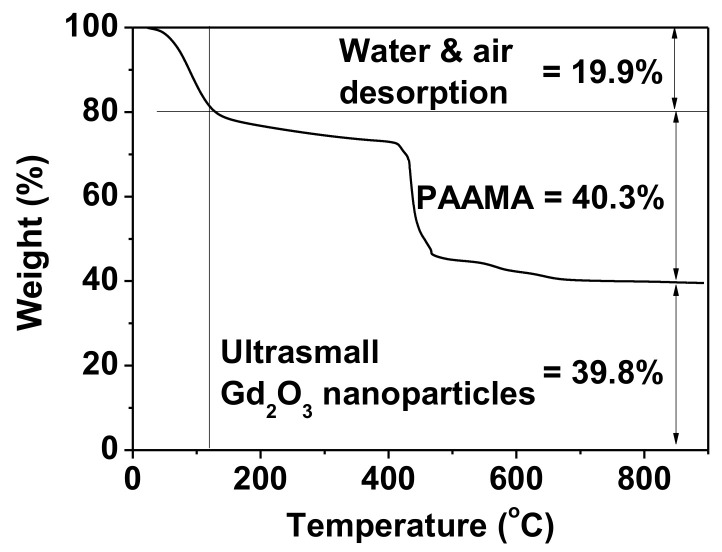
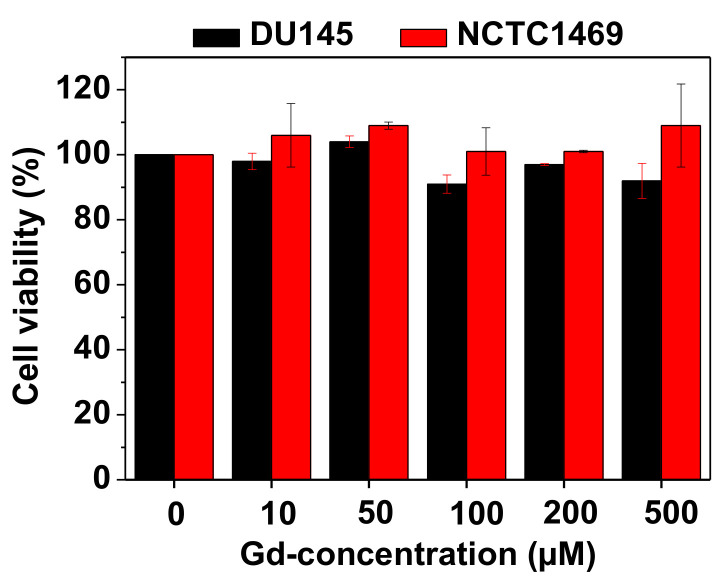
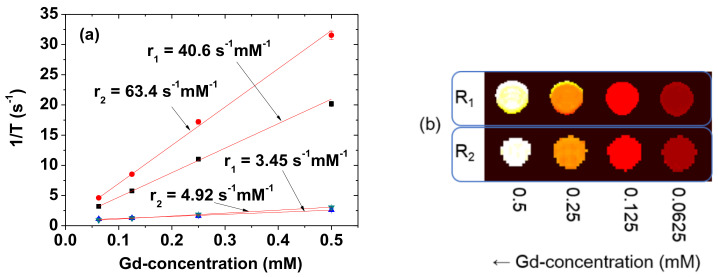
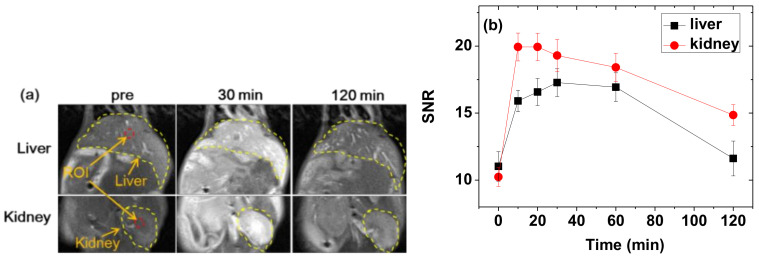
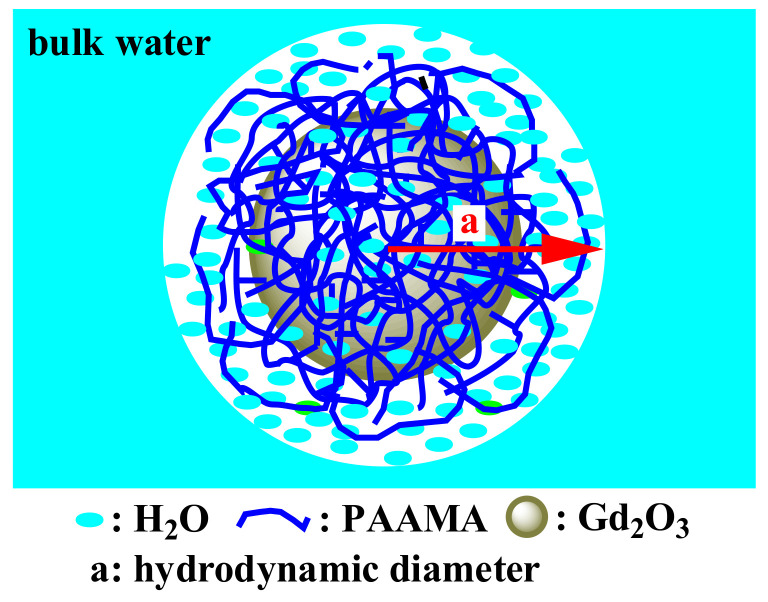
The water proton spin relaxivity, colloidal stability, and biocompatibility of nanoparticle-based magnetic resonance imaging (MRI) contrast agents depend on the surface-coating ligands. Here, poly(acrylic acid-co-maleic acid) (PAAMA) (Mw = ~3000 amu) is explored as a surface-coating ligand of ultrasmall gadolinium oxide (Gd2O3) nanoparticles. Owing to the numerous carboxylic groups in PAAMA, which allow its strong conjugation with the nanoparticle surfaces and the attraction of abundant water molecules to the nanoparticles, the synthesized PAAMA-coated ultrasmall Gd2O3 nanoparticles (davg = 1.8 nm and aavg = 9.0 nm) exhibit excellent colloidal stability, extremely low cellular toxicity, and a high longitudinal water proton spin relaxivity (r1) of 40.6 s-1mM-1 (r2/r1 = 1.56, where r2 = transverse water proton spin relaxivity), which is approximately 10 times higher than those of commercial molecular contrast agents. The effectiveness of PAAMA-coated ultrasmall Gd2O3 nanoparticles as a T1 MRI contrast agent is confirmed by the high positive contrast enhancements of the in vivo T1 MR images at the 3.0 T MR field.

Keywords: biocompatibility; colloidal stability; magnetic resonance imaging agent; poly(acrylic acid-co-maleic acid); relaxivity; ultrasmall Gd2O3 nanoparticle.


Conflict of interest statement

The authors declare no conflict of interest.

Figures

Figure 1
Figure 1
Reaction scheme (one-pot polyol synthesis) of the poly(acrylic acid-co-maleic acid) (PAAMA)-coated ultrasmall Gd2O3 nanoparticles. TEG = triethylene glycol.
Figure 2
Figure 2
(a) High-angle annular dark field-scanning transmission electron microscope (HAADF-STEM) elemental mapping image exhibiting the dispersions of the PAAMA-coated ultrasmall Gd2O3 nanoparticles. (b) High-resolution transmission electron (HRTEM) image of the PAAMA-coated ultrasmall Gd2O3 nanoparticles [red dotted circle is magnified at the top (as indicated with an arrow) as an inset on a 2 nm scale with a (222) plane lattice distance (labeled as dotted lines and arrows) of 0.30 ± 0.01 nm]. (c) Particle diameter distribution and a log-normal function fit to obtain davg (Nparticle is the total number of nanoparticles used for the fit).
Figure 3
Figure 3
(a) Dynamic light-scattering (DLS) pattern and a log-normal function fit to obtain aavg. Inset is a plot of the aavg measured as a function of time (min). (b) Zeta potential curve and a Gaussian function fit to obtain ξavg. (c) Photograph of an aqueous nanoparticle solution sample showing the good colloidal dispersion without precipitation of PAAMA-coated ultrasmall Gd2O3 nanoparticles in solution. (d) The Tyndall effect (laser-light scattering) confirming the colloidal dispersion of PAAMA-coated ultrasmall Gd2O3 nanoparticles in solution. The effect (indicated with an arrow) was only observed in the nanoparticle solution sample (left vial); it was not observed in triple-distilled water (right vial). (e) Test for the colloidal stability in a magnetic field with no precipitation of the nanoparticles (experimental set-up (left) and a photograph of the solution sample after the experiment (right)).
Figure 4
Figure 4
XRD patterns of the powder sample before (bottom spectrum) and after (top spectrum) thermogravimetric analysis (TGA). All the peaks after TGA could be assigned the (hkl) Miller indices of cubic Gd2O3, and only the intense peaks were representatively assigned in the XRD pattern. “L” = lattice constant.
Figure 5
Figure 5
(a) FT-IR absorption spectra of the powder sample (bottom spectrum) and free PAAMA (top spectrum). The arrow indicates the red-shift of the C=O stretch. (b) Coating structure of PAAMA on the ultrasmall Gd2O3 nanoparticle surface. Each PAAMA was strongly bonded to the ultrasmall Gd2O3 nanoparticle surface through many coordination bonds between many COO- groups of PAAMA and many Gd3+ on the nanoparticle surface (approximately six PAAMA polymers were coated per nanoparticle, as estimated from TGA).
Figure 6
Figure 6
TGA curve of the powder sample exhibiting wt.% of PAAMA (40.3%) and that of the ultrasmall Gd2O3 nanoparticles (39.8%) after assessing wt.% of water and air desorption (19.9%) from the sample.
Figure 7
Figure 7
In vitro cell viabilities of the PAAMA-coated ultrasmall Gd2O3 nanoparticles on the DU145 and NCTC1469 cells as a function of Gd-concentration, which showed extremely low cellular toxicities.
Figure 8
Figure 8
M-H curve of the PAAMA-coated ultrasmall Gd2O3 nanoparticles at 300 K, showing paramagnetism. The M value is the net M value of the ultrasmall Gd2O3 nanoparticles only (without PAAMA), which was estimated from the net mass of the ultrasmall Gd2O3 nanoparticles that was obtained by TGA.
Figure 9
Figure 9
(a) Plots of 1/T1 and 1/T2 of the solution sample and the reference (Dotarem) as a function of the Gd-concentration. The slopes correspond to the r1 and r2 values, respectively. (b) The R1 and R2 map images showing clear dose-dependent contrast changes.
Figure 10
Figure 10
(a) In vivo T1 MR images of the liver and kidneys before and after the intravenous administration of the aqueous solution sample to the mice tails. Small red dotted circles = ROI and yellow dotted lines = liver or kidney. (b) Plots of SNR of ROI as a function of time (p-values between 0 timepoint and the other timepoints: p-value = 0.029 * for 10, 20, 30, and 60 min for both the liver and kidneys, p-value = 0.486 for 120 min for the liver, and p-value = 0.032 * for 120 min for the kidneys). “pre” = before administration, “SNR” = signal-to-noise ratio, and “ROI” = region-of-interest.
Figure 11
Figure 11
Model picture showing the numerous water molecules that were attracted by the PAAMA polymers coating the ultrasmall Gd2O3 nanoparticle surface, which availed a large hydrodynamic diameter (a) and, as a result, a very high r1 value and good colloidal stability.

Similar articles

Cited by

References

    1. Hashemi R.H., Bradley W.G., Lisanti C.J. MRI the Basics. Lippincott Williams & Wilkins; New York, NY, USA: 2004.
    1. Lauffer R.B. Paramagnetic metal complexes as water proton relaxation agents for NMR imaging: Theory and design. Chem. Rev. 1987;87:901–927. doi: 10.1021/cr00081a003. - DOI
    1. Caravan P., Ellison J.J., McMurry T.J., Lauffer R.B. Gadolinium(III) chelates as MRI contrast agents: Structure, dynamics, and applications. Chem. Rev. 1999;99:2293–2352. doi: 10.1021/cr980440x. - DOI - PubMed
    1. Xiao Y.-D., Paudel R., Liu J., Ma C., Zhang Z.-S., Zhou S.-K. MRI contrast agents: Classification and application (Review) Int. J. Mol. Med. 2016;38:1319–1326. doi: 10.3892/ijmm.2016.2744. - DOI - PubMed
    1. Greenwood N.N., Earnshaw A. Chemistry of the Elements. Butterworth-Heinemann; Oxford, UK: 1997. p. 1243.

LinkOut - more resources