. 2020 Dec 25;22(1):156.
doi: 10.3390/ijms22010156.

Sounds Stimulation on In Vitro HL1 Cells: A Pilot Study and a Theoretical Physical Model

Affiliations

Sounds Stimulation on In Vitro HL1 Cells: A Pilot Study and a Theoretical Physical Model

Carlo Dal Lin et al. Int J Mol Sci. .

Abstract

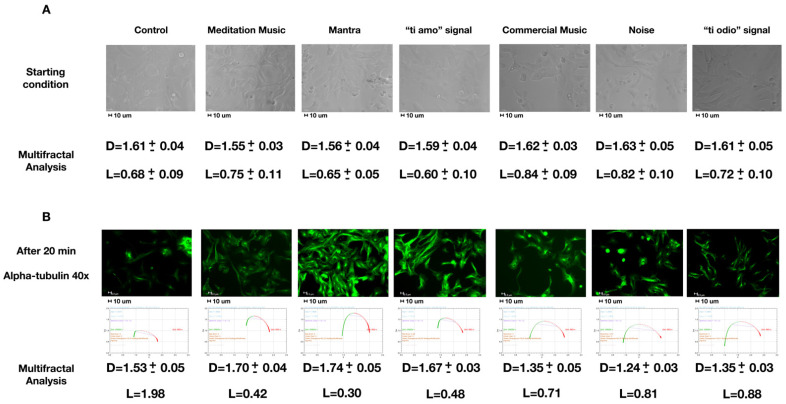
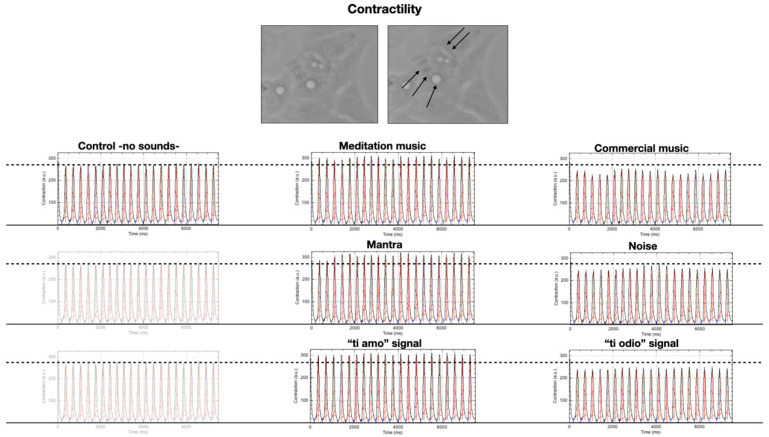
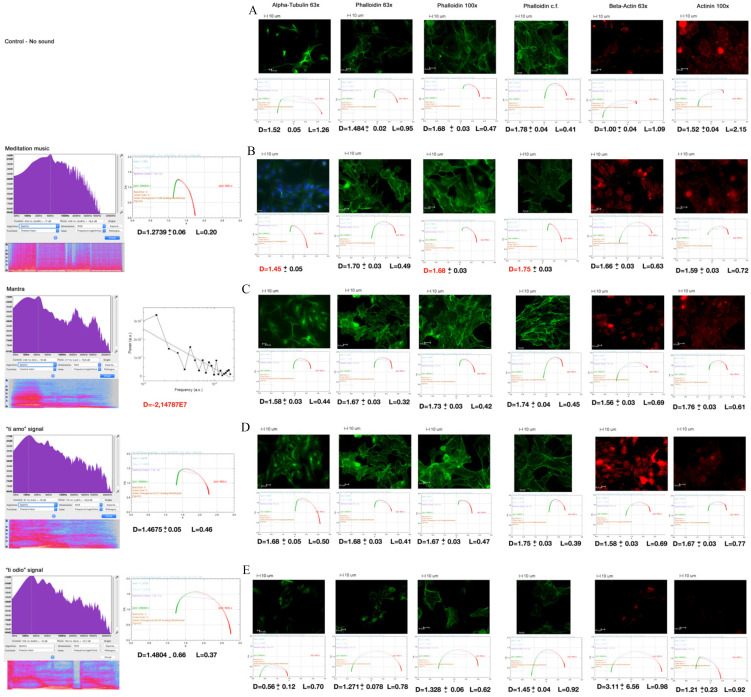
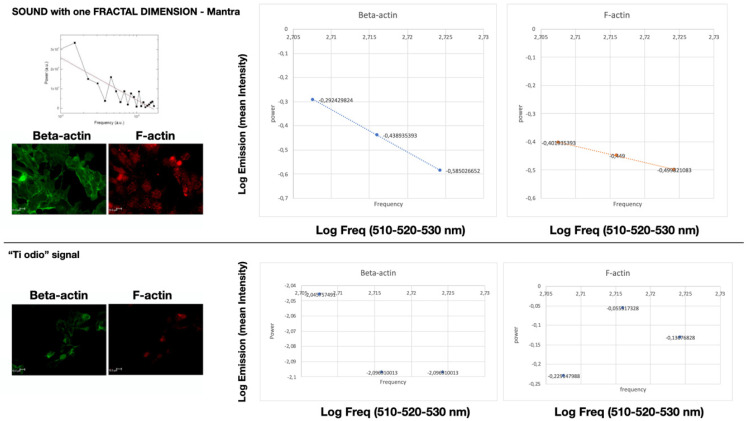
Mechanical vibrations seem to affect the behaviour of different cell types and the functions of different organs. Pressure waves, including acoustic waves (sounds), could affect cytoskeletal molecules via coherent changes in their spatial organization and mechano-transduction signalling. We analyzed the sounds spectra and their fractal features. Cardiac muscle HL1 cells were exposed to different sounds, were stained for cytoskeletal markers (phalloidin, beta-actin, alpha-tubulin, alpha-actinin-1), and studied with multifractal analysis (using FracLac for ImageJ). A single cell was live-imaged and its dynamic contractility changes in response to each different sound were analysed (using Musclemotion for ImageJ). Different sound stimuli seem to influence the contractility and the spatial organization of HL1 cells, resulting in a different localization and fluorescence emission of cytoskeletal proteins. Since the cellular behaviour seems to correlate with the fractal structure of the sound used, we speculate that it can influence the cells by virtue of the different sound waves' geometric properties that we have photographed and filmed. A theoretical physical model is proposed to explain our results, based on the coherent molecular dynamics. We stress the role of the systemic view in the understanding of the biological activity.

Keywords: cardiomyocytes; coherent states; cytoskeletal proteins; fractals; mechano-transduction; sound waves.


Conflict of interest statement

The authors declare no conflict of interest.

Figures

Figure 1
Figure 1
(A) Starting condition, description in the text. (B) Alpha-tubulin staining after the different 20-min sounds stimulation with a graph below representing ƒ(α) vs. α (the typical pattern for multifractals) and the results of the multifractal analysis reporting the average fractal dimension (D) and lacunarity (L). In (B), all L parameters vary less than ± 0.002. All the photos are representative images selected from 5 positions and 6 experimental repetitions. Images were acquired with 40×/0.60 dry objective. Scale bar 10 μm.
Figure 2
Figure 2
Contractility analysis of the same cell (at the top of the panel, black arrows indicate the contraction—magnification 63×) under the different acoustic stimulations. The graphics represent Contraction (a.u.) vs. Time (ms).
Figure 3
Figure 3
Sound analysis (left side of the panel) and the multifractal analysis of the immunofluorescent images of cytoskeletal markers (on the right). (A) Control cells, (B) Meditation music, (C) Mantra, (D) “ti amo” signal, (E) “ti odio” signal. On the left: the sound analysis (FFT on the top, underlying spectrum graphical depiction and spectral multifractal analysis next). On the right, in order: Alpha-tubulin 63× (and Hoecst in B), Phalloidin 63×, 100×, confocal (cf.), Beta-actin 63× and Alpha-actinin-1 (Actinin) 100× stainings after 20 min of each sound stimulation. Below a graph representing ƒ(α) vs. α (the typical pattern for multifractals) and the results of the multifractal analysis reporting the average fractal dimension (D) and lacunarity (L) of all the experiments. All L parameters vary less than ± 0.002. All the photos are representative images selected from 5 positions and 6 experimental repetitions. Scale bar 10 μm.
Figure 4
Figure 4
Linear LOG–LOG relationship between mean fluorescent intensity and laser frequency of Beta-actin and F-actin within cells stimulated with “mantra” signal for 20 min (on the top). This does not happen in the other cases: on the bottom is reported the results of the LOG–LOG plot of the signal “ti odio” as example. Scale bar 10 μm.
Figure 5
Figure 5
Our laboratory set up for the experiment. A laptop computer with the audio tracks (A) is connected to an amplifier (B) positioned nearby the microscope (C) and its incubator (E). With a phonimeter we calibrated the volume of the amplifier so that the intensity of the sound in the point where the cells are positioned (E) is about 60 dB, which corresponds to a normal vocal conversation. (D1) CO2 controller, (D2) heating unit, temperature control unit (D3). We remark that also “control cells” were exposed to the speaker plugged to energy without any sound produced in order to exclude that our findings could be the result of any small vibration produced by the speaker itself instead of the sound. Finally, the vocal sounds used were pronounced by 3 different people, giving the same results.

References

    1. Davis M.T., Holmes S.E., Pietrzak R.H., Esterlis I. Neurobiology of Chronic Stress-Related Psychiatric Disorders: Evidence from Molecular Imaging Studies. Chronic Stress. 2017;1:247054701771091. doi: 10.1177/2470547017710916. - DOI - PMC - PubMed
    1. Dal Lin C., Tona F., Osto E. The Heart as a Psychoneuroendocrine and Immunoregulatory Organ. Adv. Exp. Med. Biol. 2018;1065:225–239. doi: 10.1007/978-3-319-77932-4_15. - DOI - PubMed
    1. De Hert M., Detraux J., Vancampfort D. The intriguing relationship between coronary heart disease and mental disorders. Dialogues Clin. Neurosci. 2018;20:31–40. doi: 10.31887/DCNS.2018.20.1/mdehert. - DOI - PMC - PubMed
    1. Harvard Heart Letter From Irritated to Enraged: Anger’s Toxic Effect on the Heart. [(accessed on 1 December 2020)]; Available online: https://www.health.harvard.edu/heart-health/from-irritated-to-enraged-an....
    1. Posternak M.A., Zimmerman M. Anger and Aggression in Psychiatric Outpatients. J. Clin. Psychiatry. 2002;63:665–672. doi: 10.4088/JCP.v63n0803. - DOI - PubMed

LinkOut - more resources