. 2021 Mar 1;81(5):1293-1307.
doi: 10.1158/0008-5472.CAN-20-1377. Epub 2020 Dec 29.

PLK1 Induces Chromosomal Instability and Overrides Cell-Cycle Checkpoints to Drive Tumorigenesis

Affiliations

PLK1 Induces Chromosomal Instability and Overrides Cell-Cycle Checkpoints to Drive Tumorigenesis

Lilia Gheghiani et al. Cancer Res. .

Abstract

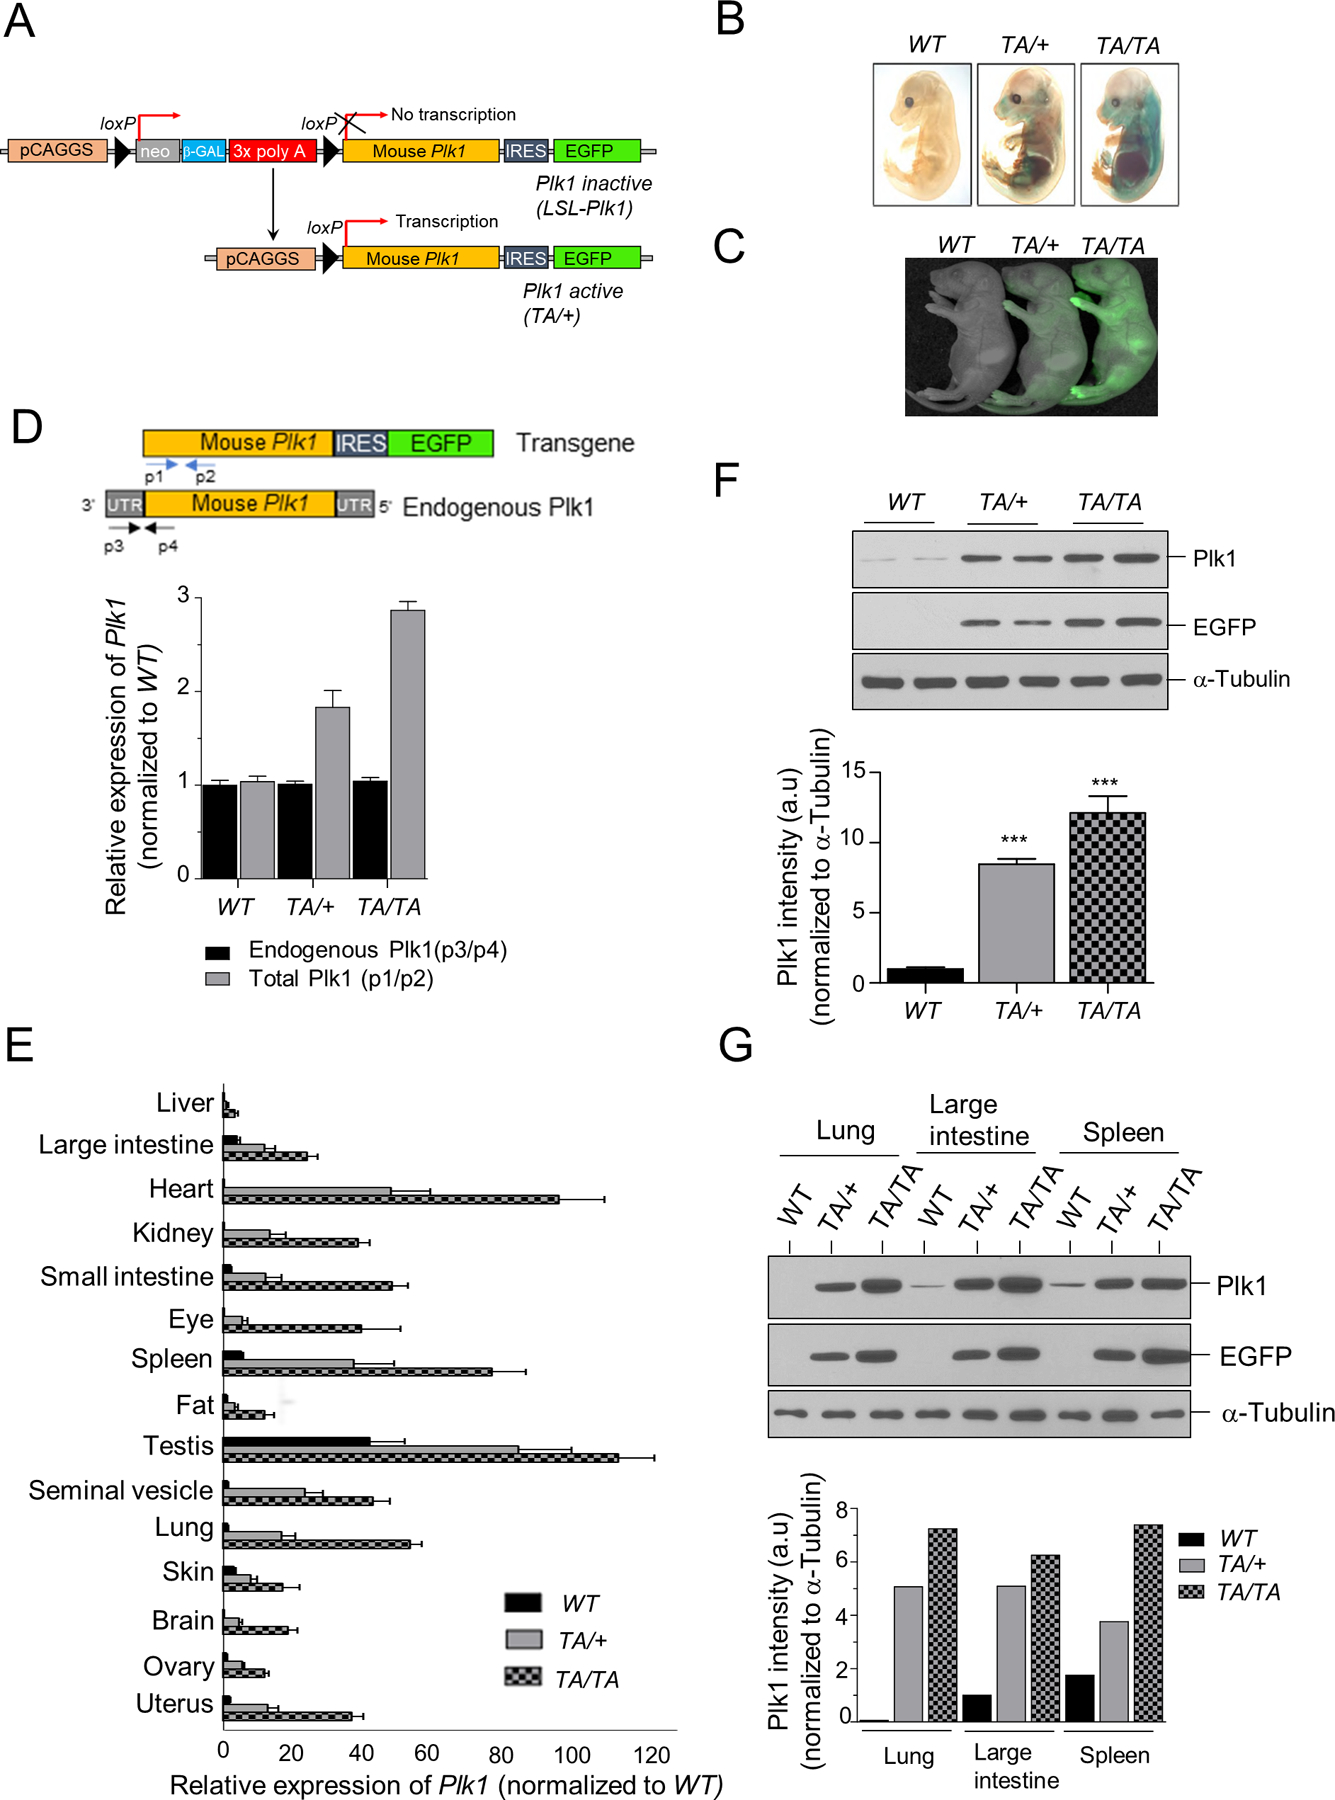
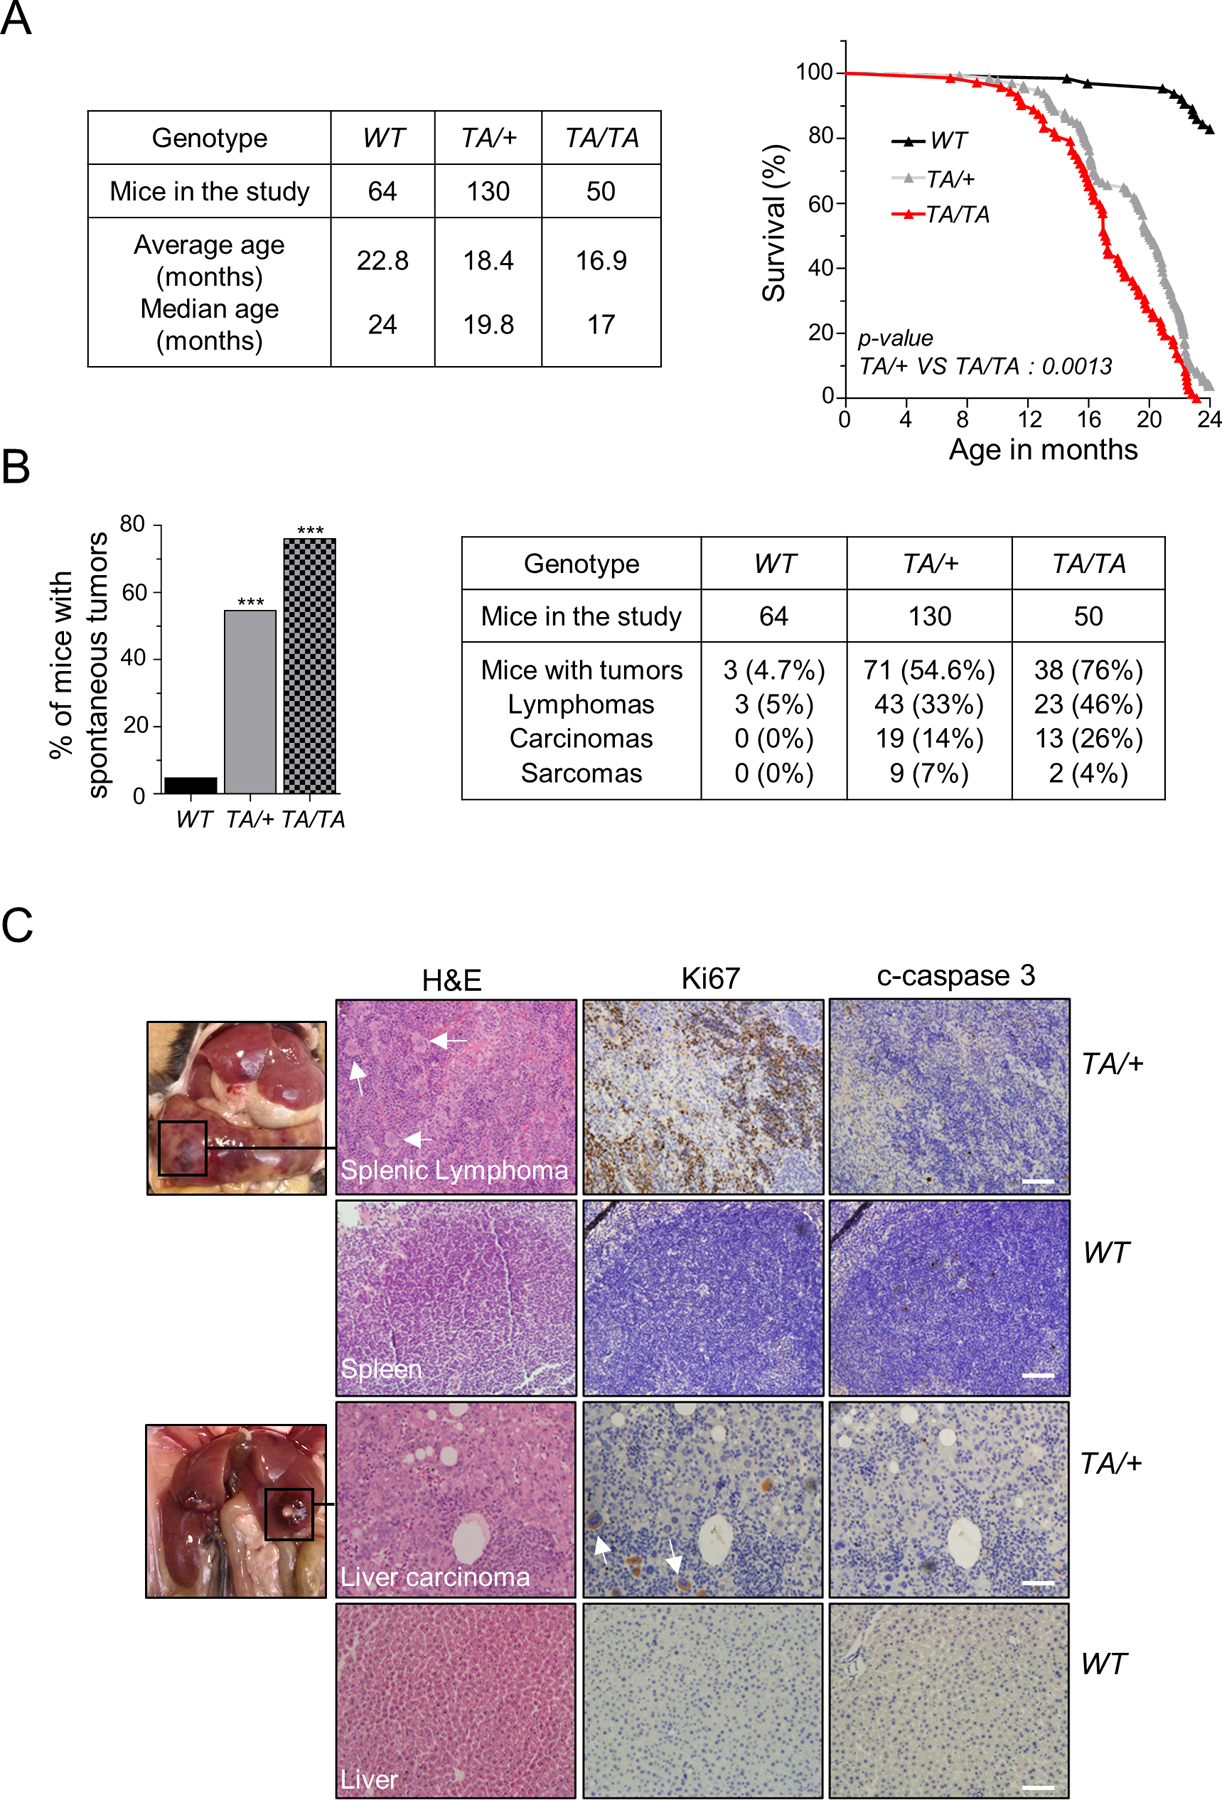
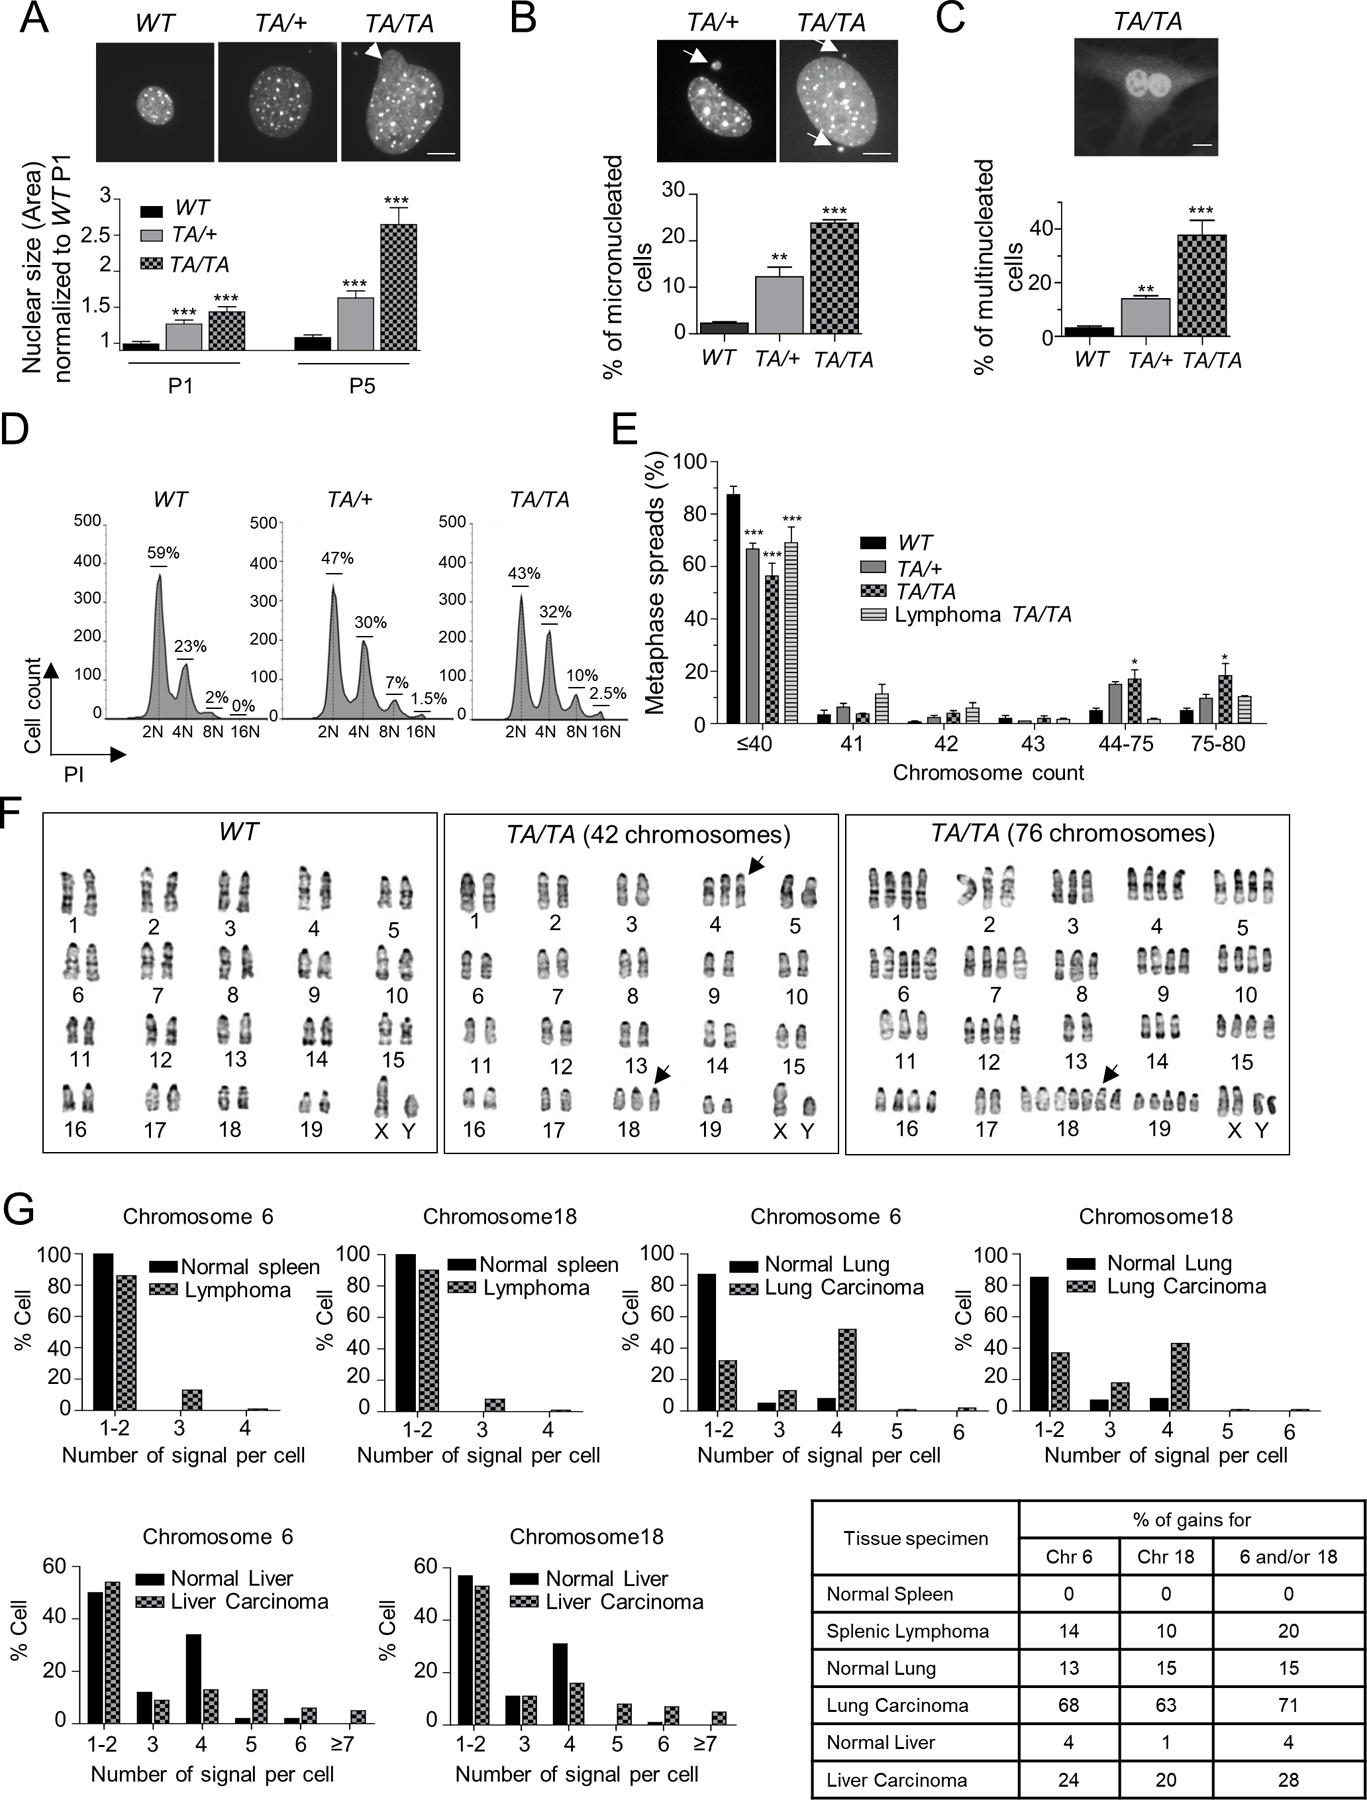
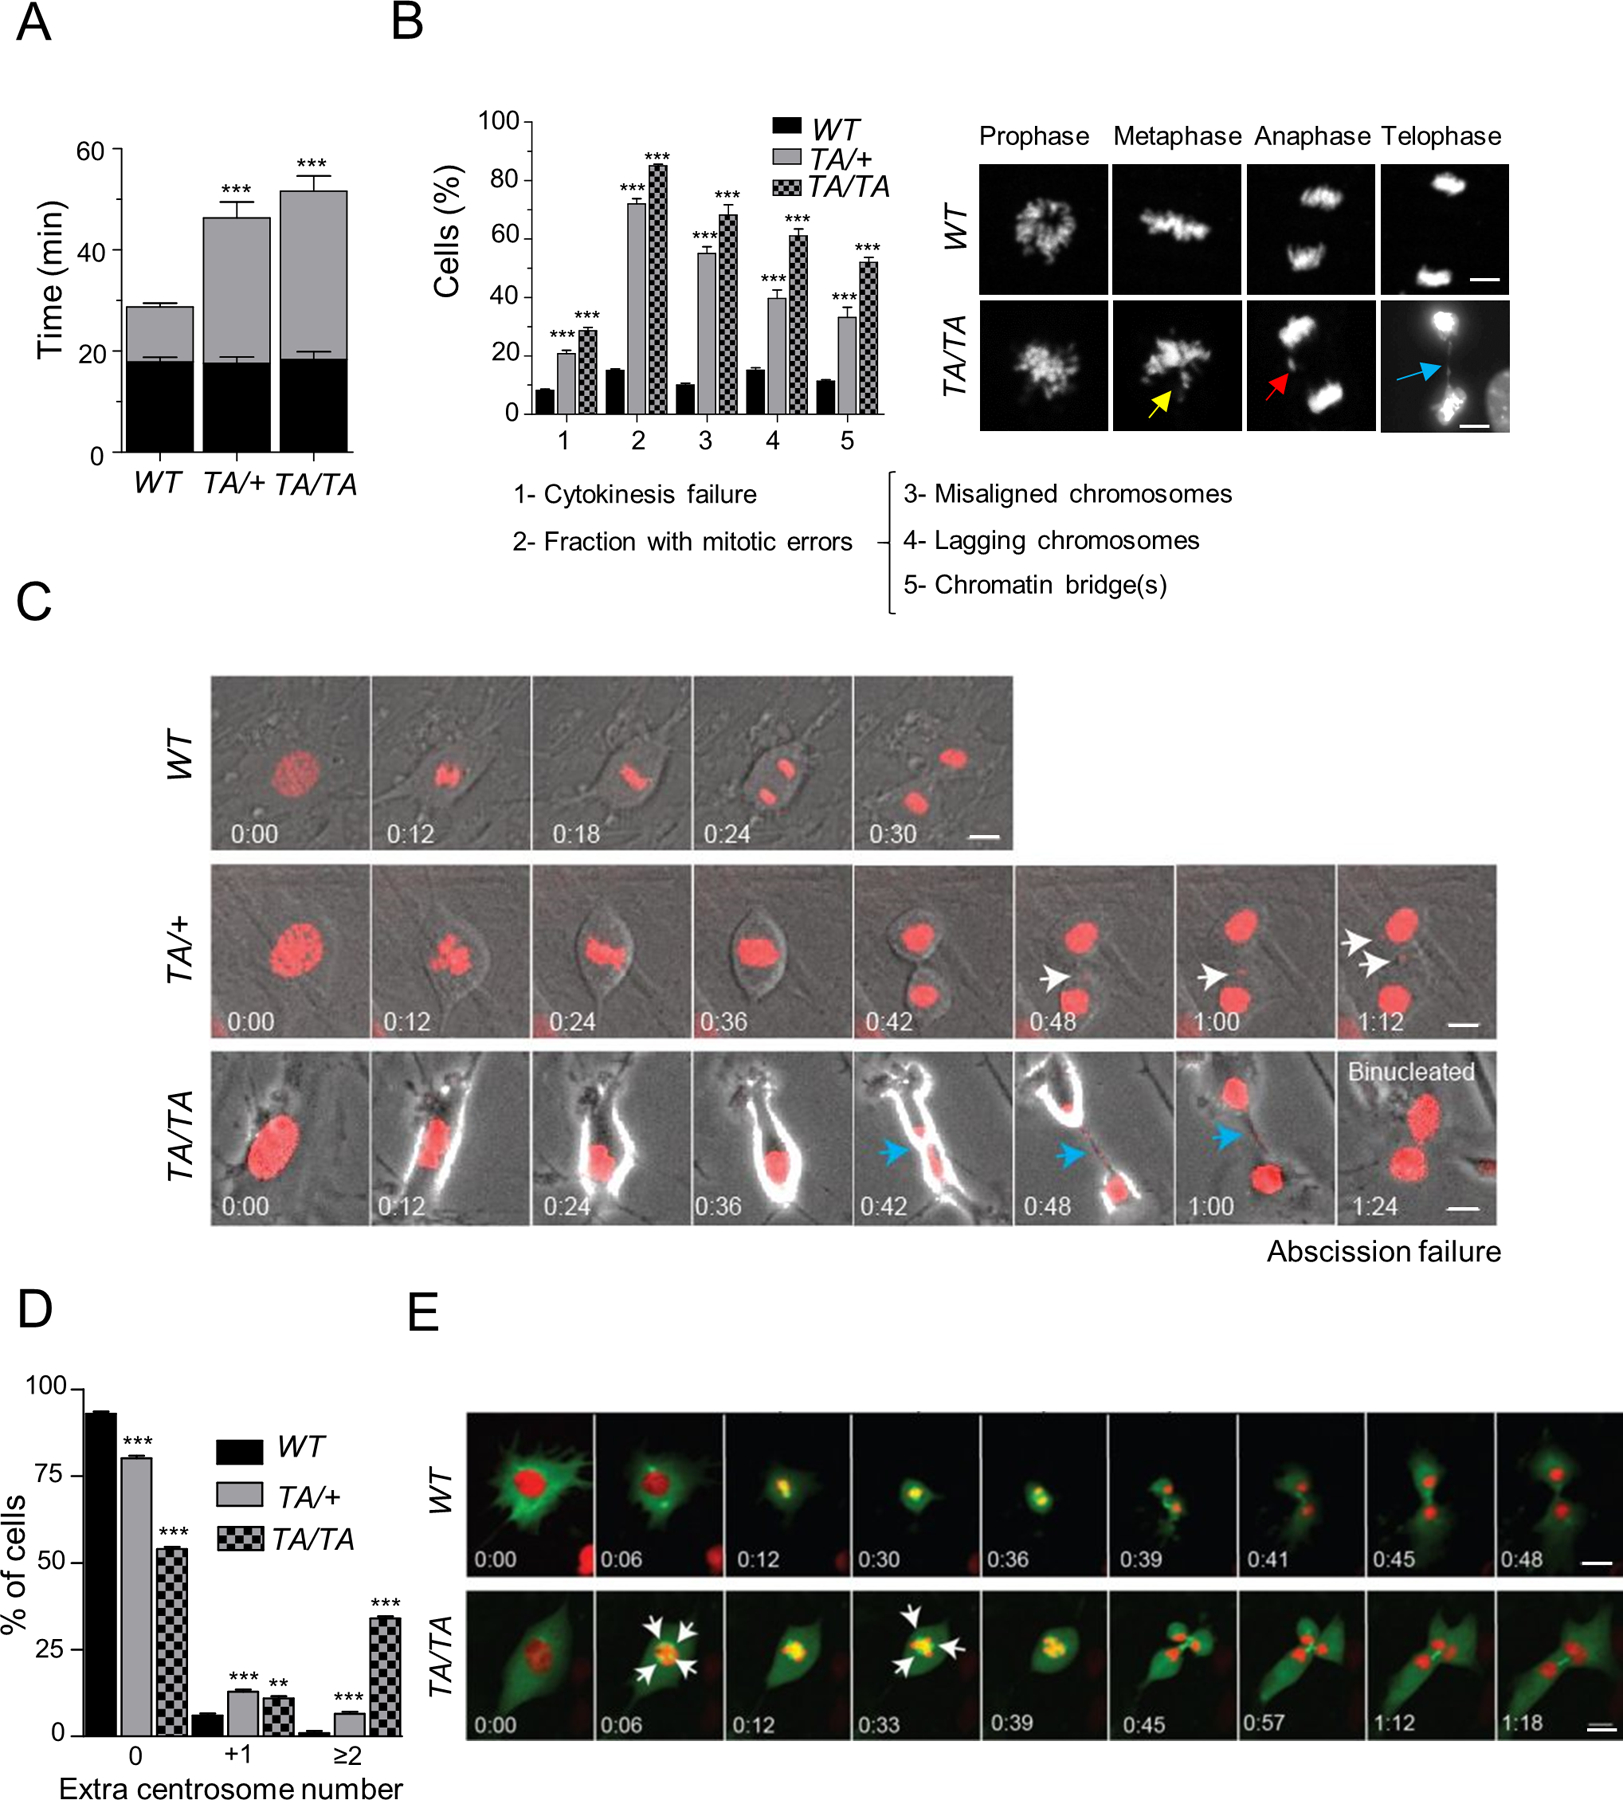
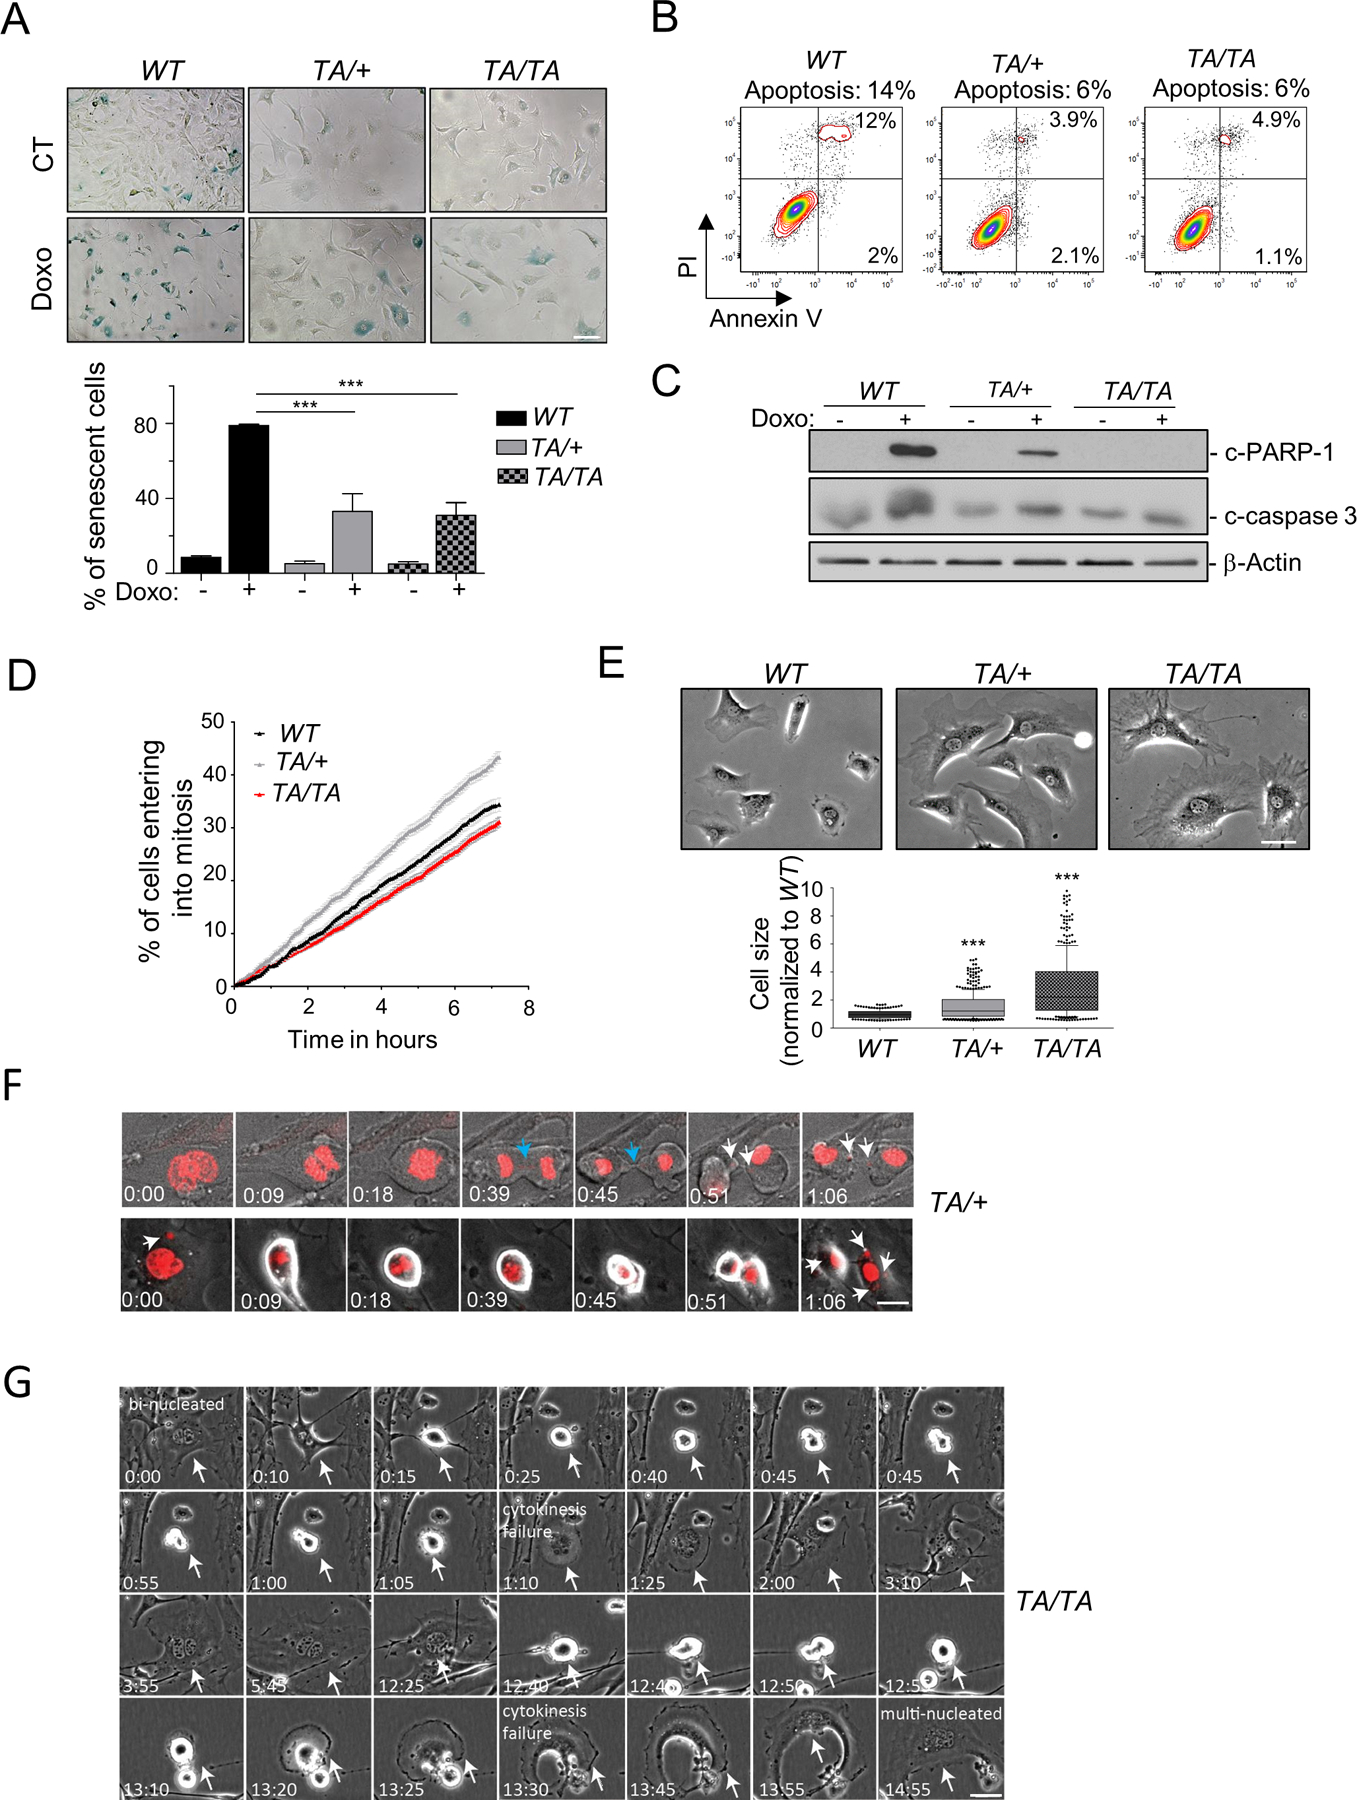
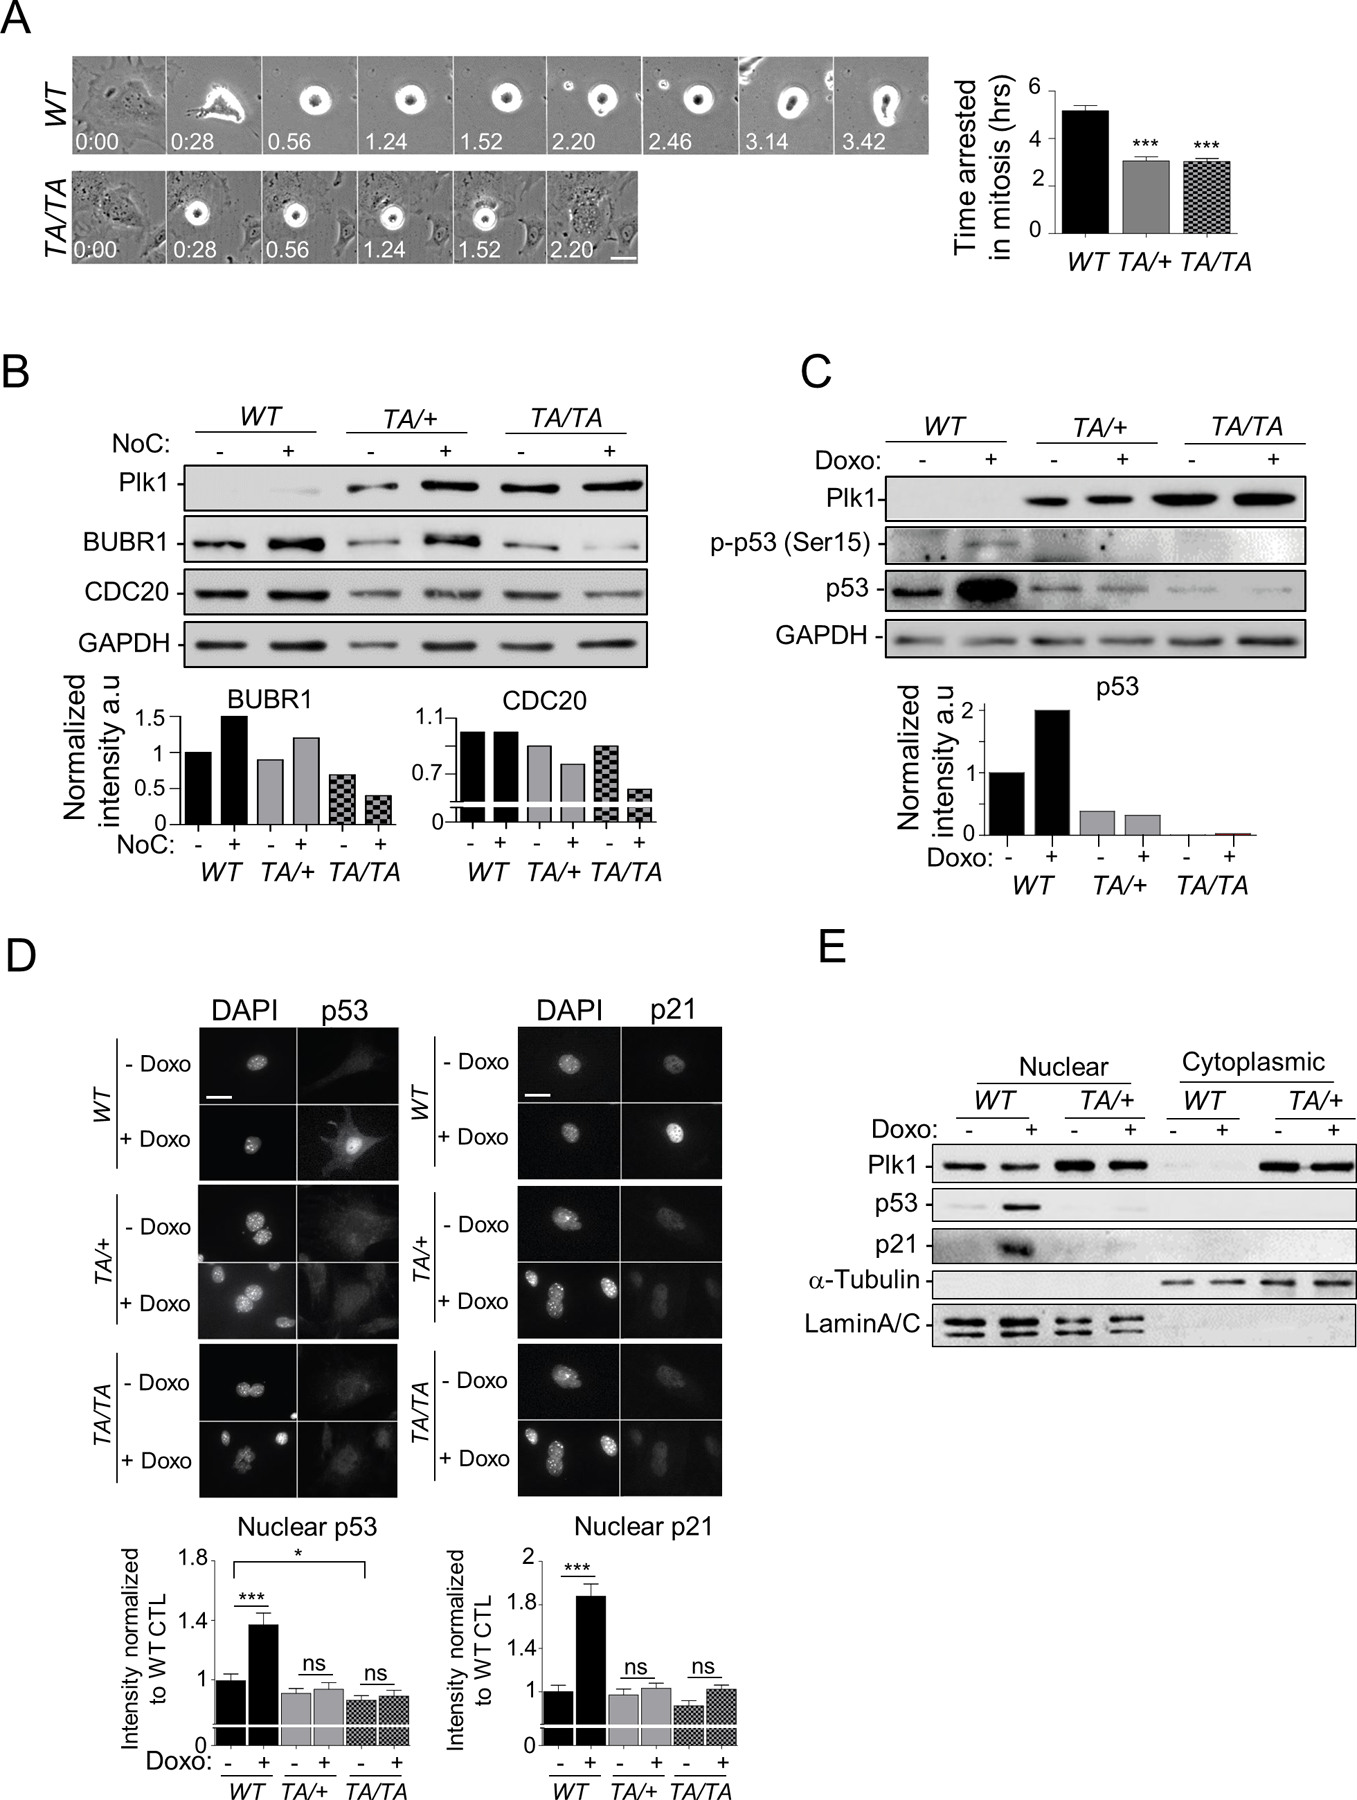
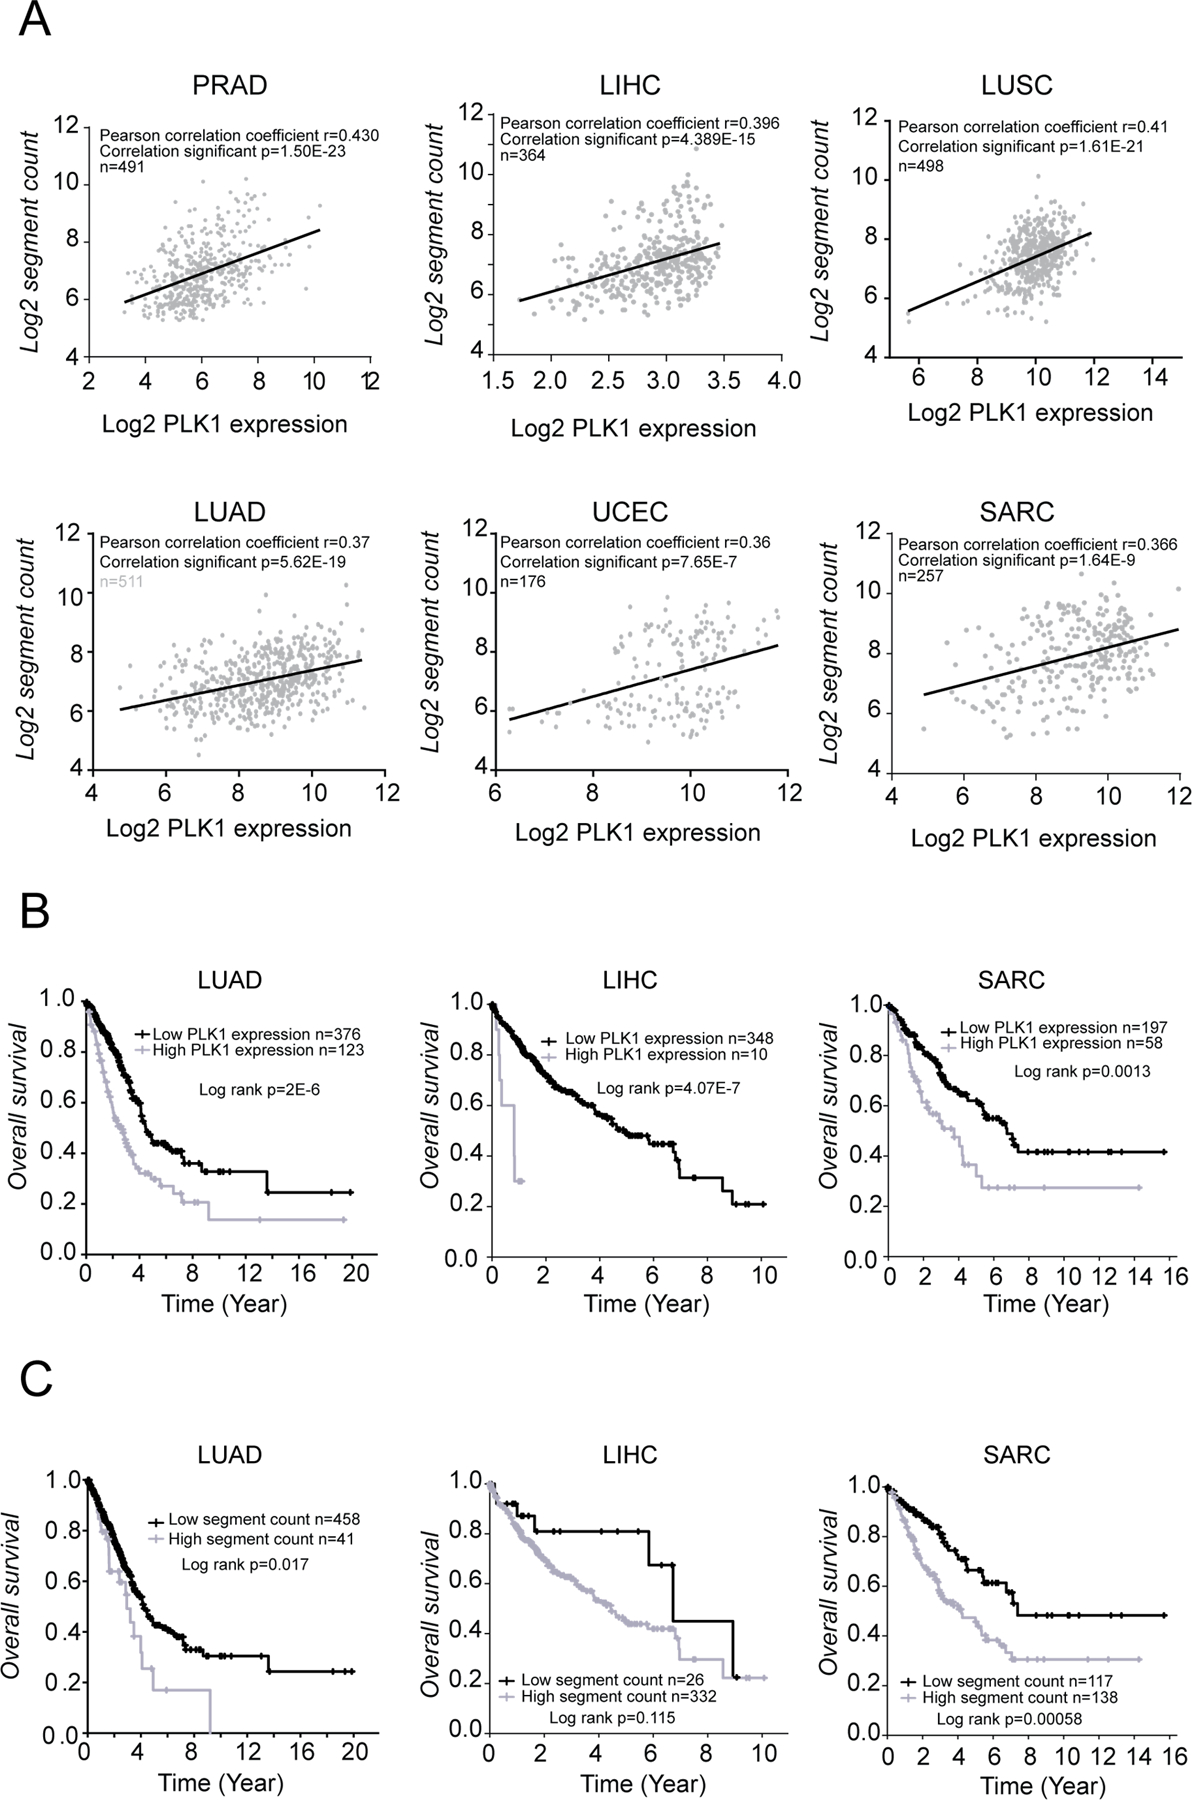
Polo-like kinase 1 (PLK1) is an essential cell-cycle regulator that is frequently overexpressed in various human cancers. To determine whether Plk1 overexpression drives tumorigenesis, we established transgenic mouse lines that ubiquitously express increased levels of Plk1. High Plk1 levels were a driving force for different types of spontaneous tumors. Increased Plk1 levels resulted in multiple defects in mitosis and cytokinesis, supernumerary centrosomes, and compromised cell-cycle checkpoints, allowing accumulation of chromosomal instability (CIN), which resulted in aneuploidy and tumor formation. Clinically, higher expression of PLK1 positively associated with an increase in genome-wide copy-number alterations in multiple human cancers. This study provides in vivo evidence that aberrant expression of PLK1 triggers CIN and tumorigenesis and highlights potential therapeutic opportunities for CIN-positive cancers. SIGNIFICANCE: These findings establish roles for PLK1 as a potent proto-oncogene and a CIN gene and provide insights for the development of effective treatment regimens across PLK1-overexpressing and CIN-positive cancers.


Conflict of interest statement

Conflict of Interest

The authors have declared that no conflict of interest exists.

Figures

Figure 1:
Figure 1:. Generation and characterization of Plk1 transgenic mice.
(A) Schematic of Plk1 transgenic mice generation. (B) β-galactosidase staining of WT: wild-type; TA/+: Plk1TA/+; TA/TA: Plk1TA/TA E13.5 mouse embryos. (C) EGFP fluorescence from 1d-old pups of the indicated genotypes. (D-E) qRT-PCR for Plk1 transcripts in PMEFs (D); tissues from transgenic mice (E) of indicated genotypes. Blue and black arrows show primer positions for analysis of the total p1/p2) and endogenous (p3/p4) Plk1 transcript, respectively. (F-G) Western blot (WB) analysis of PMEF cell extracts (F); tissue extracts (G) from transgenic mice. Plk1 and EGFP WB with α-Tubulin loading control. Bottom panel: Plk1 protein quantification of this WB.
Figure 2:
Figure 2:. Plk1 overexpression promotes spontaneous tumorigenesis.
(A) (Left) Mouse cohort information, between 0 to 24 months. (Right) Survival curves for WT, TA/+, and TA/TA mice (TA/+ vs TA/TA: p = 0.0013, log-rank test). (B) (Left) Spontaneous tumor incidence in WT, TA/+, and TA/TA mice. (***: p < 0.001, Chi-squared test) (Right) Distinct neoplasm incidence in transgenic mice. (C) Examples of spontaneous tumors from TA/+ mice and corresponding immunohistochemistry (IHC) staining of Ki67 and cleaved-caspase 3 (c-caspase 3), and H&E in paraffin-embedded tissues. Below: Staining of respective WT tissue. Scale bar: 100 µm. White arrows indicate neoplastic polyploid cells. See Supplementary Fig. S1.
Figure 3:
Figure 3:. Overexpression of Plk1 induces aneuploidy.
(A, B) (Top) Representative WT, TA/+ and TA/TA PMEFs stained with DAPI. (Bottom) (A) Nuclear size of WT, TA/+ and TA/TA P1 and P5 PMEFs, normalized to P1 WT PMEFs (B) Percentage of micronucleated WT, TA/+ and TA/TA PMEFs. Fifty cells/genotype, repeated 3x. (Mean ± SEM, **: p <0.01; ***: p< 0.001). Scale bar: 10 µm. Arrow head: nuclear buds; arrow: micronuclei. (C) (Top) Representative binucleated TA/TA PMEFs stained with DAPI and Plk1. (Bottom) Percentage of multinucleated cells per genotype. Fifty cells/genotype, repeated 3x. (Mean ± SEM, **: p < 0.01; *** p < 0.001). Scale bar: 10 μm. (D) DNA content in asynchronous WT, TA/+ and TA/TA PMEFs via flow cytometry. (E) Chromosome counts of WT, TA/+ and TA/TA PMEFs, and TA/TA lymphomas metaphase spreads. One hundred metaphases/genotype; repeated 3x. (Mean ± SEM, WT vs TA/+ or TA/TA, *: p < 0. 05; *** p < 0.001, t-test). (F) WT and TA/TA PMEFs karyograms. (Left) Representative GTG-banding of chromosomes from WT cells, showing a typical mouse complement of 40 chromosomes. (Middle) Representative metaphase spread from TA/TA PMEFs showing a cell with a total of 42 chromosomes (additional chromosome 4 and 18 [highlighted by arrows]). (Right) Representative TA/TA PMEF metaphase spread showing a cell with a near-tetraploid complement (76 chromosomes), including 7 copies of chromosome 18. (G) Interphase FISH analysis of 5-µm paraffin sections of a splenic lymphoma and lung and liver carcinomas from Plk1 transgenic mice and their respective WT tissues, hybridized to both peri-centromeric chromosome 6 and 18 probes. 100 cells/section. Percent gain in lung and spleen specimens represent gains of ≥1 signal in each cell; in liver, gains of >2 signals due to the physiological hepatocyte tetraploidy. See Supplementary Fig. S2.
Figure 4:
Figure 4:. Plk1-overexpressing cells display numerous mitotic aberrations, cytokinesis defects, and centrosome amplification.
(A) Mitotic duration between prophase to metaphase (P → M) and metaphase to cytokinesis (M → C) in WT, TA/+ and TA/TA PMEFs expressing H2B-mcherry. Fifty cells/genotype, repeated 3x. (Mean ± SEM, ***: p < 0.001). (B) (Left) Percentage of cell division defects in WT, TA/+ and TA/TA PMEFs. Fifty cells/genotype, repeated 3x. (Mean ± SEM, WT vs TA/+ or TA/TA ***: p < 0.001). (Right) Representative PMEFs in each phase. Arrows – yellow: misaligned chromosome; red: lagging chromosome; blue: chromatin bridge. Scale, 10 µm. (C) Time-lapse images of PMEFs expressing H2B-mCherry monitored (3 min/image) as cells enter mitosis. Arrows – white: micronuclei; blue: chromatin bridge. Scale, 10 µm. (D) Centrosome count of G2 PMEF cells immunostained for γ-Tubulin. One hundred metaphases/genotype, repeated 3x. (Mean ± SEM, WT vs TA/+ or TA/TA, **: p < 0.01; *** p < 0.001, t-test). (E) Time-lapse images (3 min/image) of WT and TA/TA PMEFs co-expressing H2B-mCherry and EGFP-α-Tubulin as cells enter mitosis. White arrow - extra centrosome and multipolar spindle. Scale bar: 10 μm. See Supplementary Fig. S3.
Figure 5:
Figure 5:. Plk1 overexpression promotes proliferation of giant polyploidy and micronucleated cells.
(A) (Top) Representative senescence-associated (SA) β-galactosidase activity in unperturbed PMEFs (P5) and 48 hrs post-treatment with doxorubicin (Doxo) (0.5μM, 8 hrs). Scale bar: 20 μm. (Bottom) Quantification of SA β-galactosidase positive cells. 200 cells/genotype, repeated 3x. (Mean ± SEM, ***: p < 0.001, t-test). (B) Unperturbed WT and Plk1 transgenic PMEFs (P5) were stained with Annexin V and PI and analyzed by flow cytometry. Numbers indicate percentage of apoptotic cells in the total population. (C) WB of untreated or Doxo (0.5μM, 8 hrs) treated WT and Plk1 transgenic PMEFs. Loading control: β-Actin. (D) Entry into mitosis (defined by nuclear envelope break down) of asynchronous PMEFs of indicated genotypes recorded by phase-contrast video-microscopy (5 min/image). Graph represents cumulative percentage of cells that have entered mitosis over time, normalized to cell density. 200 cells/genotype, repeated 3x. (Mean ± SEM). (E) (Top) Representative phase images of WT and Plk1 transgenic PMEFs. (Bottom) Cell size quantification, normalized to WT. 200 cells/genotype, repeated 3x (Mean ± SEM, ***: p < 0.001, t-test). Scale bar: 20 μm. (F) Representative images of binucleated and micronucleated TA/+ PMEFs expressing H2B-mCherry monitored during mitotic entry progression. Arrows – white: micronuclei; blue: chromatin bridge. Scale. Scale bar: 10 μm. (G) Representative binucleated TA/TA PMEFs monitored during 2 cell divisions. White arrow: binucleated cell. Scale bar: 10 μm. See Supplementary Fig. S4.
Figure 6:
Figure 6:. Plk1 overexpression impairs the cell cycle checkpoints.
(A) Synchronized G2 WT and Plk1 transgenic PMEFs were treated with nocodazole (NoC) (200 ng/ml) and tracked through mitotic entry and progression by phase-contrast video-microscopy (4 min/image). (Left) Time-lapse images of WT and TA/TA PMEFs arrested in mitosis by NoC treatment. (Right) Duration of mitotic arrest induced by NoC treatment in PMEFs. Fifty cells/genotype; repeated 3x. (Mean ± SEM, WT vs TA/+ or WT vs TA/TA ***: p < 0.001 t-test). (B) (Top) WB of untreated or Noc (200 ng/ml, 6 hours) treated WT and Plk1 transgenic PMEFs, Loading control: GAPDH. (Bottom) Quantification of BUBR1 and CDC20 expression levels normalized to GAPDH (C) (Top) Analysis of p53 expression and activity (p-p53 [Ser15]) in untreated or doxorubicin (Doxo) (0.5 mM for 2 hrs) treated WT and Plk1 transgenic PMEFs synchronized in G2. (Bottom) Quantification of p53 expression level normalized to GAPDH (D) (Top) Representative images of cells treated as in (C), and immunostained for p53 or p21. (Bottom) Quantification of p53 and p21 nuclear intensity using ImageJ software. 50 cells/genotype, repeated 3x. (Mean ± SEM, *: p < 0.05; ***: p < 0.001). Scale, 10 µm. (E) Nuclear and cytoplasmic p53 and p21 levels analyzed by WB from synchronous G2 PMEFs of indicated genotype treated as in (A). Loading and fractionation controls: α-Tubulin and Lamin A/C. See Supplementary Fig.S5/56/7.
Figure 7:
Figure 7:. PLK1 overexpression is associated with increased genome-wide copy numbers and poorer prognosis in human cancers.
(A) Correlations between CNAs and PLK1 expression levels using TCGA cohort datasets. (B) Association between PLK1 expression and prognosis. Mean PLK1 expression levels was used to divide patients into high/low expression groups. (C) Association between genome segmentation counts and prognosis. Patients were divided into high/low segment count groups, using optimal segment count mean. Optimal split cutoff was defined using Cutoff finder. See Supplementary Fig. S8.

Similar articles

Cited by

References

    1. Zitouni S, Nabais C, Jana SC, Guerrero A, Bettencourt-Dias M. Polo-like kinases: structural variations lead to multiple functions. Nat Rev Mol Cell Biol, 2014. - PubMed
    1. Liu Z, Sun Q, Wang X. PLK1, A Potential Target for Cancer Therapy. Transl Oncol, 2016. - PMC - PubMed
    1. Strebhardt K, Ullrich A. Targeting polo-like kinase 1 for cancer therapy. Nat. Rev. Cancer, 2006. - PubMed
    1. van Vugt MATM, van de Weerdt BCM, Vader G, Janssen H, Calafat J, Klompmaker R, et al. Polo-like kinase-1 is required for bipolar spindle formation but is dispensable for anaphase promoting complex/Cdc20 activation and initiation of cytokinesis. J Biol Chem, 2004. - PubMed
    1. Wu J, Ivanov AI, Fisher PB, Fu Z. Polo-like kinase 1 induces epithelial-to-mesenchymal transition and promotes epithelial cell motility by activating CRAF/ERK signaling. Elife, 2016. - PMC - PubMed

Publication types

MeSH terms