. 2020 Dec 29;4(3):e202000897.
doi: 10.26508/lsa.202000897. Print 2021 Mar.

Tissue-selective alternate promoters guide NLRP6 expression

Affiliations

Tissue-selective alternate promoters guide NLRP6 expression

Nathan A Bracey et al. Life Sci Alliance. .

Abstract

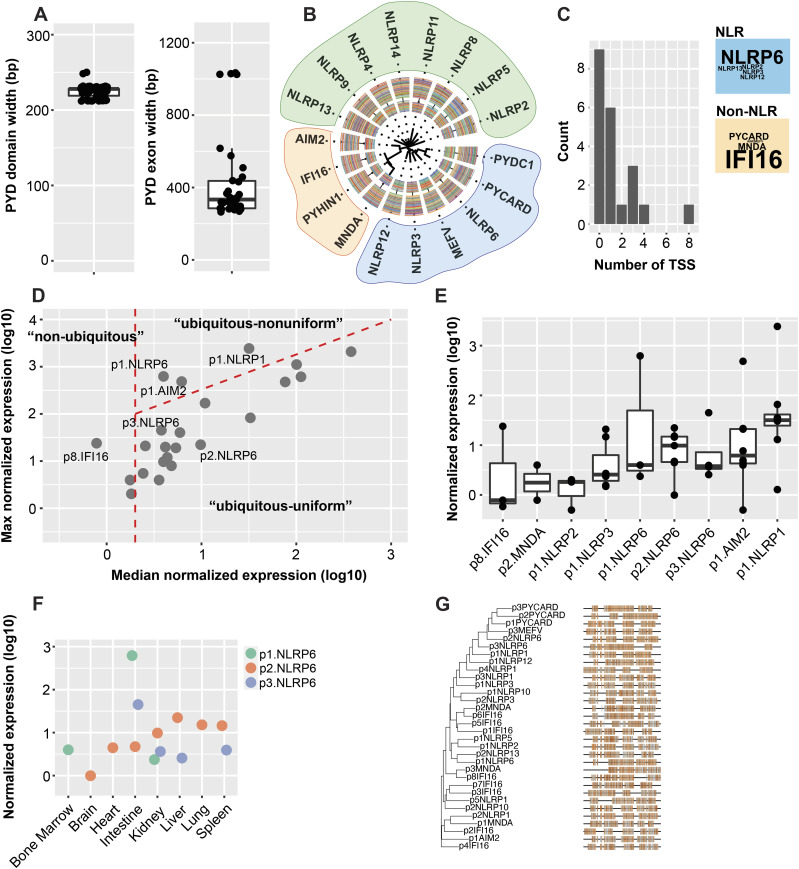
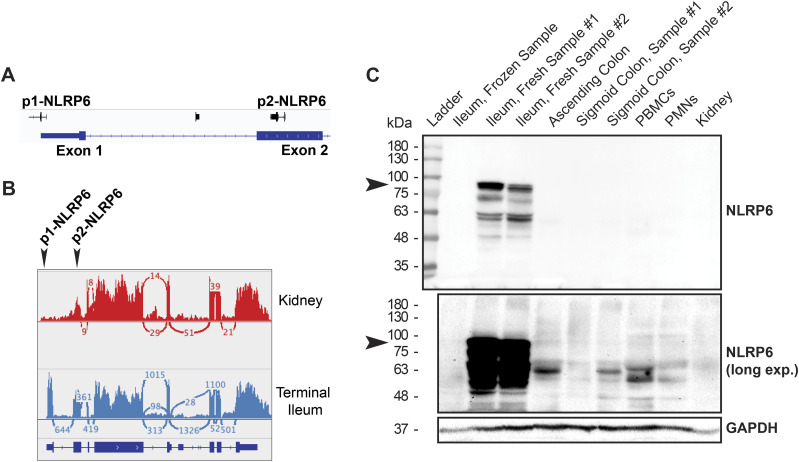
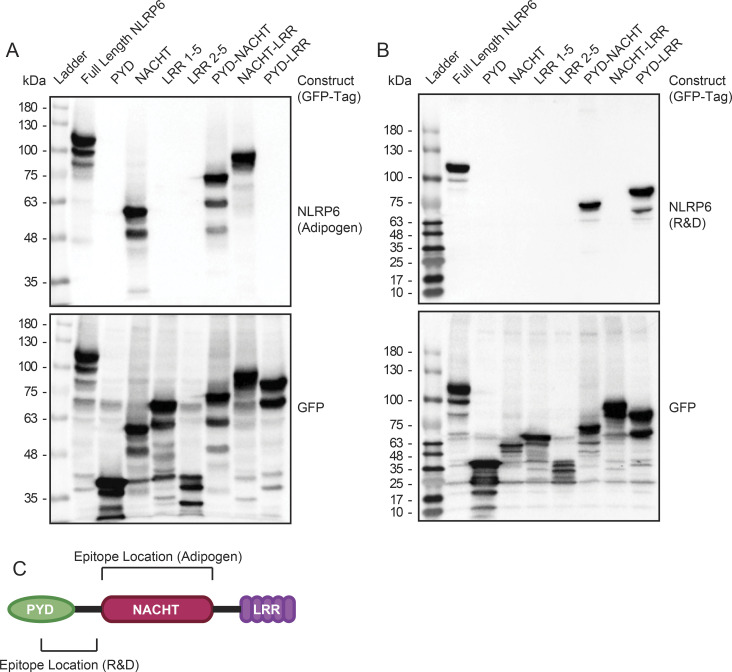
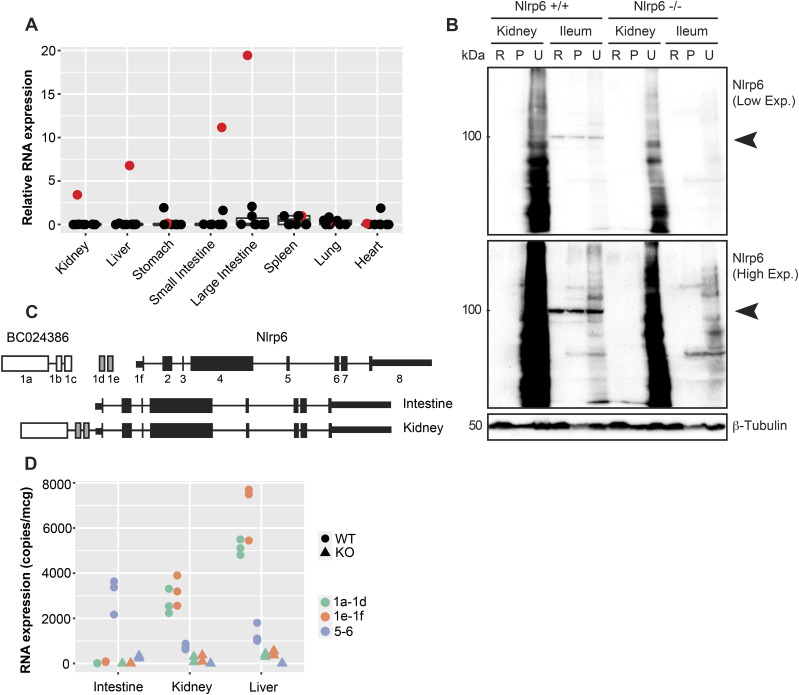
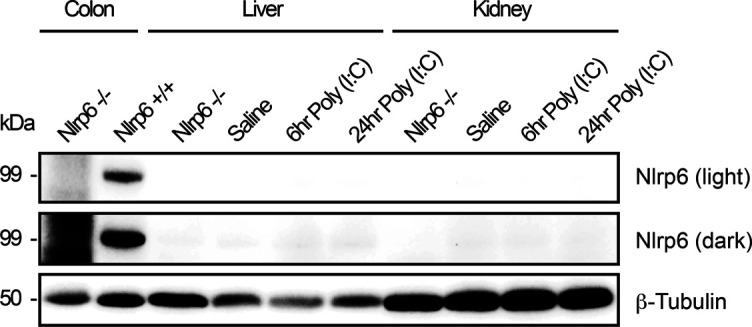
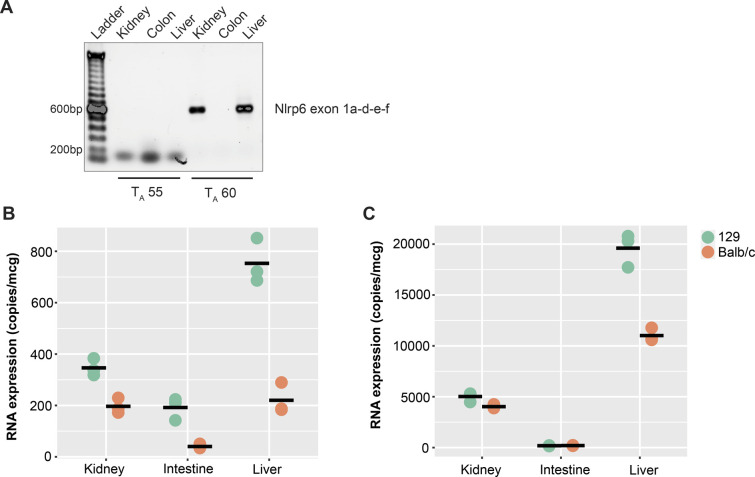
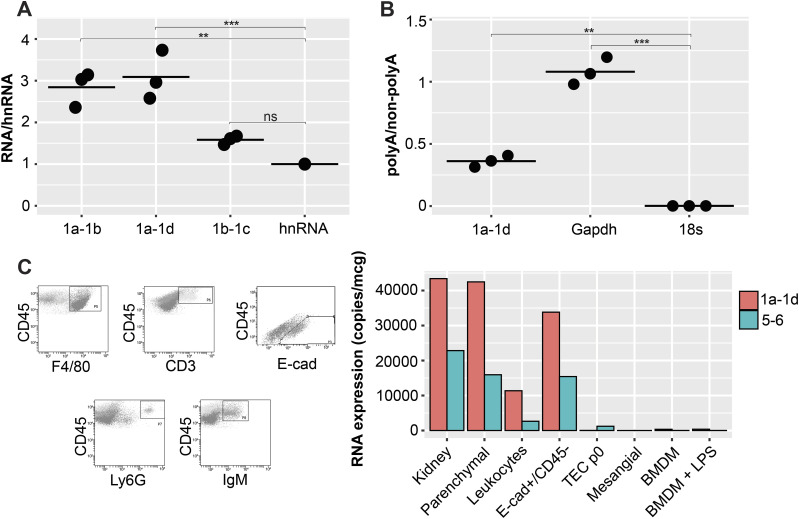
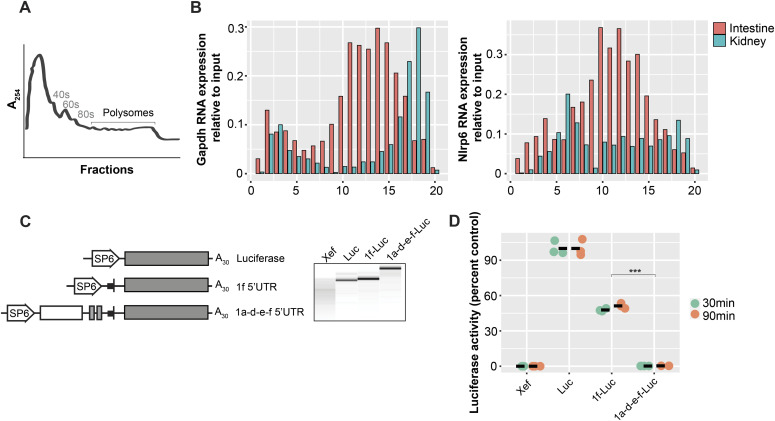
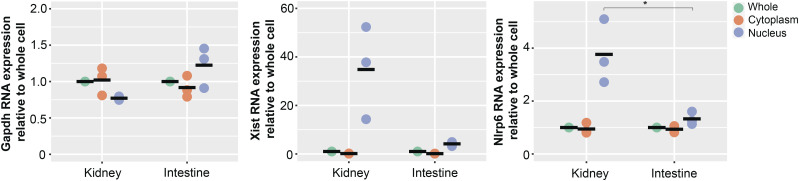
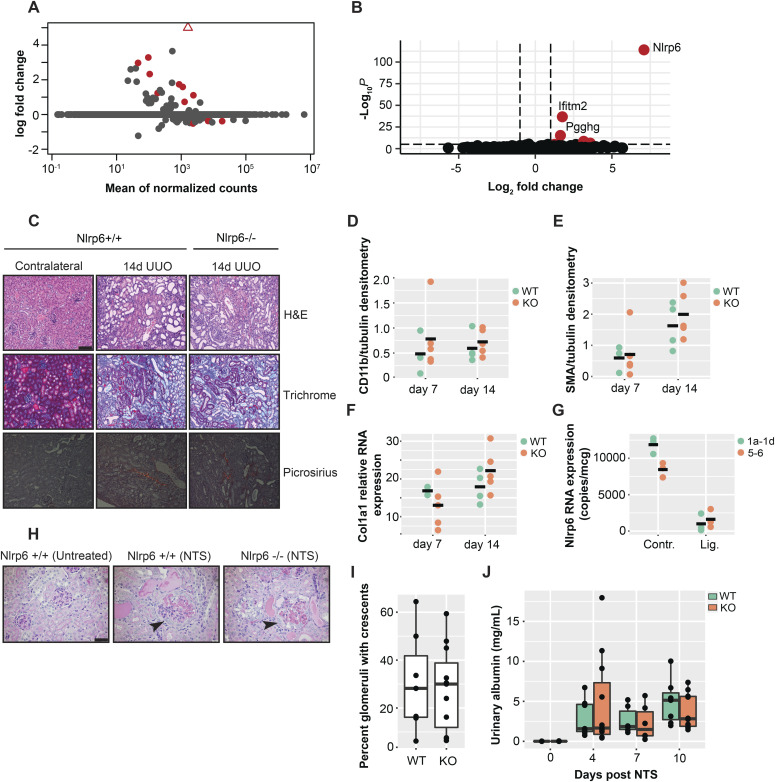
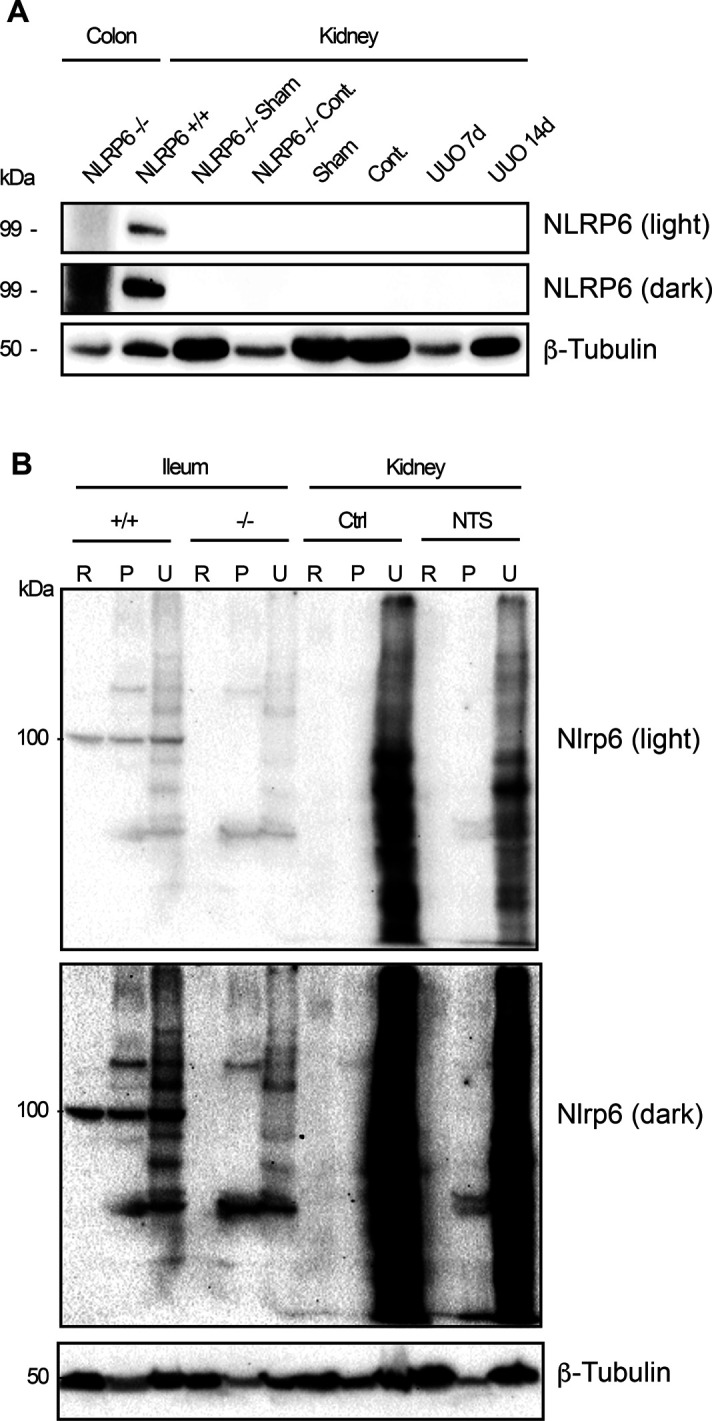
The pryin domain (PYD) domain is involved in protein interactions that lead to assembly of immune-sensing complexes such as inflammasomes. The repertoire of PYD-containing genes expressed by a cell type arms tissues with responses against a range of stimuli. The transcriptional regulation of the PYD gene family however is incompletely understood. Alternative promoter utilization was identified as a mechanism regulating the tissue distribution of human PYD gene family members, including NLRP6 that is translationally silenced outside of intestinal tissue. Results show that alternative transcriptional promoters mediate NLRP6 silencing in mice and humans, despite no upstream genomic synteny. Human NLRP6 contains an internal alternative promoter within exon 2 of the PYD, resulting in a truncated mRNA in nonintestinal tissue. In mice, a proximal promoter was used that expanded the 5' leader sequence restricting nuclear export and abolishing translational efficiency. Nlrp6 was dispensable in disease models targeting the kidney, which expresses noncanonical isoforms. Thus, alternative promoter use is a critical mechanism not just for isoform modulation but for determining expression profile and function of PYD family members.


Conflict of interest statement

The authors declare that they have no conflict of interest.

Figures

Figure 1.
Figure 1.. PYD-containing genes are transcribed by sets of promoters with diverse tissue distributions.
(A) Distribution of Pfam domain (left) and their corresponding exon (right) widths for human PYD-containing genes. (B) Phylogenetic tree for all PYD-containing genes aligned by PYD domain. (C) Distribution of transcription start site (TSS) consensus cluster counts for all PYD genes in FANTOM5 cap analysis of gene expression data. Word cloud highlights the PYD genes with the most TSS consensus clusters. (D) Distribution of normalized maximum and median expression values for PYD-containing gene TSS clusters across tissues extracted from the FANTOM5 database. Dashed red lines indicate boundaries established from initial FANTOM5 analysis of all peak data; to the left of vertical red line are TSS peaks detected with median expression <0.2 tags per million. Below the diagonal line are TSS peaks where maximum <10× median, and above red diagonal are TSS peaks where maximum >10× median. (E) Distribution of normalized expression values for select promoter clusters across various tissue types from FANTOM5 data. Note 3 distinct promoters for NLRP6 with diverse tissue distribution profiles. (F) Distribution of NLRP6 promoters across various tissue types in FANTOM5 datasets. (G) Phylogenetic tree and alignments for PYD gene promoters (consensus clusters +100 bp upstream).
Figure S1.
Figure S1.. Maximum likelihood and bootstrap analysis of PYD-gene promoters.
Consensus transcription start site sequences including +100 bp upstream were aligned, and the phylogenetic tree was constructed using a JTT matrix–based model. Nodes show bootstrap support values from 100 pseudoreplicates.
Figure 2.
Figure 2.. Human NLRP6 is regulated by tissue-selective alternate promoters.
(A) Gene-like representation of NLRP6 transcription start site clusters from FANTOM database. (B) Sashimi plot for NLRP6 showing alternative promoter use of p1.NLRP6 in the representative human small intestine (blue) and p2.NLRP6 in human kidney (red). (C) Immunoblot for NLRP6 protein in human fresh and frozen samples (ileum only) for low and high exposures. Arrows indicate predicted NLRP6 size. Source data are available for this figure. Source data are available for this figure.
Figure S2.
Figure S2.. Mapping the epitope binding sites of commercially available human NLRP6 antibodies.
(A, B) Protein immunoblot for (A) adipogen (Clint-1) anti-human NLRP6 antibody or (B) R&D anti-human NLRP6 antibody for GFP-tagged human NLRP6 gene constructs transiently transfected in 293T cells. Immunoblotting for the common GFP tag serves as expression control (lower panels). (C) Mapped epitope locations for human NLRP6 antibodies.
Figure 3.
Figure 3.. Murine Nlrp6 is regulated by tissue-selective alternate promoters.
(A) Tissue distribution of PYD-containing RNA transcripts in organs relative to the spleen (red = Nlrp6). (B) Immunoblot for Nlrp6 protein in mouse kidney and intestine (R, RIPA; P, insoluble pellet; U, urea). Nlrp6 protein is only detectable in intestine. (C) (Top) Genomic organization and reannotation for mouse Nlrp6 locus. (Bottom) Transcript map for novel Nlrp6 exons and splicing of tissue-selective 5′UTR leaders in the kidney and intestine. (D) Absolute RNA expression of Nlrp6 amplicons corresponding to different 5′UTR leaders in WT and KO mouse organs. n = 3 biological replicates from littermate mice. Source data are available for this figure.
Figure S3.
Figure S3.. Nlrp6 protein expression and inducibility.
Protein immunoblot for endogenous Nlrp6 in the colon, liver, and kidney from Nlrp6+/+ mice treated with saline or Poly (I:C) for indicated time points. Nlrp6−/− mice serve as negative control and colonic tissue from Nlrp6+/+ mice as positive control for antibody specificity. Light and dark exposures of the same membrane are shown. Source data are available for this figure.
Figure S4.
Figure S4.. Identification of the novel Nlrp6 5′ UTR in mouse kidney and liver.
(A) Agarose gel for PCR products generated from mouse tissues for an amplicon covering predicted Nlrp6∆5′UTR (exon 1a-d-e-f) under indicated annealing temperatures. PCR products were verified by Sanger’s sequencing. (B, C) Absolute RNA expression for Nlrp6 exon 5–6 (B) and Nlrp6∆5′UTR exon 1a–1d (C) in kidney, intestine (colon), and liver from 129 and Balb/c mice. n = 3 technical replicates of one animal from each strain.
Figure 4.
Figure 4.. Nlrp6∆5′UTR variant is spliced and polyadenylated in kidney epithelial cells.
(A) Nlrp6∆5′UTR RNA expression relative to Nlrp6 hnRNA in nuclei isolated from whole kidney. (B) Nlrp6∆5′UTR RNA expression in polyA versus non-polyA whole-cell kidney RNA preparations. n = 3 biological replicates, P-values *0.05, **0.01, ***0.001, ****0.0001 by ANOVA with Tukey’s multiple comparison. (C) Density gradient separation and flow sorting of kidney cells. (Left) Hierarchical gating for macrophages (CD45+ F4/80+), neutrophils (CD45+Ly6G+), T lymphocytes (CD45+ CD3+), B lymphocytes (CD45+ IgM+), and epithelial cells (CD45− E-cadherin+). (Right) Absolute RNA expression for Nlrp6 amplicons in various cell populations. TEC, tubular epithelial cells in 2D culture; BMDM, bone marrow–derived macrophages in 2D culture; mesangial cells in 2D culture. Representative experiment from n = 6 pooled kidneys. hnRNA, heteronuclear RNA.
Figure 5.
Figure 5.. Nlrp6∆5′UTR isoform has reduced translational efficiency.
(A) Representative tracing for polyribosome profiling of mouse kidney tissue. (B) Nlrp6 RNA expression in polysome fractions from mouse kidney and intestine. Gapdh is comparison for an actively translating mRNA. (C) Chimeric RNA constructs and transcripts (right panel) used for in vitro translation. All were 5′ capped and contained the SP6 promoter, designated leader sequences, luciferase reporter, and poly A tail. (D) In vitro translation of capped and tailed Nlrp6 5′ leader RNA constructs. Xef RNA is negative control. Results are expressed as percent of luciferase control containing no leader sequence, n = 3 biological replicates translated in separate reactions. P-values *0.05, **0.01, ***0.001, and ****0.0001 by ANOVA with Tukey’s multiple comparisons test.
Figure 6.
Figure 6.. Nlrp6∆5′UTR is associated with tissue-selective Nlrp6 nuclear retention.
Nuclear/cytoplasmic fractionation and absolute Nlrp6 RNA expression in mouse kidney and intestine. Gapdh serves as control for cytoplasmic RNA, and Xist for nuclear RNA. Note the scale for Xist as 10-fold greater than the others reflecting high nuclear concentration in both kidney and intestine. *P < 0.05 by ANOVA with Tukey’s multiple comparison test, n = 3 biological replicates from littermate mice.
Figure 7.
Figure 7.. Nlrp6 is dispensable in kidney epithelium.
(A) MA plot showing differential gene expression in the kidney from Nlrp6+/+ and Nlrp6−/− littermates. Red signifies adjusted P-values < 0.1, triangle is Nlrp6. (B) Volcano plot highlighting similarities between Nlrp6+/+ and Nlrp6−/− kidney gene expression. All represent n = 3 littermate mice per group. (C) Representative histological sections from Nlrp6+/+ and Nlrp6−/− mice at 14 d showing H&E (top), Trichrome (middle), and Picrosirius Red for contralateral controls and unilateral ureteric obstruction (UUO) kidneys. Bar is 80 μm. (D, E) CD11b and ⍺SMA quantitative densitometry of protein expression by immunoblotting. (F) Col1a1 relative RNA expression in Nlrp6+/+ and Nlrp6−/− kidneys following UUO. (G) Absolute Nlrp6 RNA expression in contralateral control and ligated Nlrp6+/+ mouse kidneys at day 14 UUO. (H) Representative PAS-stained kidney sections from Nlrp6+/+ and Nlrp6−/− mice at 10 d following nephrotoxic serum (NTS). Black arrows point to glomeruli with crescents. Bar is 40 μm. (I) Percent of crescentic glomeruli for NTS mice at 10 d. (J) Urinary albumin from mice following NTS injury. All represent n = 3–7 mice per group for F1 littermate mice.
Figure S5.
Figure S5.. Nlrp6 protein is not induced during experimental kidney injury.
(A) Protein immunoblot from Nlrp6+/+ unilateral ureteric obstruction, sham, and contralateral control kidneys at indicated time points. Nlrp6−/− mice serve as negative control and colonic tissue from Nlrp6+/+ mice as positive control for antibody specificity. (B) Protein immunoblot for Nlrp6 in kidneys from Nlrp6+/+ mice treated with nephrotoxic serum (NTS) or untreated controls (Ctrl). Ileum from Nlrp6+/+ and Nlrp6−/− mice are used as positive and negative controls. R, RIPA and U, urea protein preparation buffers; p, centrifuged insoluble pellet. Both high and low exposures of the same membrane are shown. Source data are available for this figure.

References

    1. Ahn AH, Kunkel LM (1993) The structural and functional diversity of protein phosphatase 2A. Nat Genet 3: 283–291. 10.1038/ng0493-283 - DOI - PubMed
    1. Akira S, Uematsu S, Takeuchi O (2006) Pathogen recognition and innate immunity. Cell 124: 783–801. 10.1016/j.cell.2006.02.015 - DOI - PubMed
    1. Anand P, Subbarao Malireddi RK, Lukens J, Vogel P, Bertin J, Lamkanfi M, Kanneganti TD (2012) NLRP6 negatively regulates innate immunity and host defense against bacterial pathogens. Nature 488: 389–393. 10.1038/nature11250 - DOI - PMC - PubMed
    1. Arzalluz-Luqueángeles A, Conesa A (2018) Single-cell RNAseq for the study of isoforms-how is that possible? Genome Biol 19: 1–19. 10.1186/s13059-018-1496-z - DOI - PMC - PubMed
    1. Bahar Halpern K, Caspi I, Lemze D, Levy M, Landen S, Elinav E, Ulitsky I, Itzkovitz S (2015) Nuclear retention of mRNA in mammalian tissues. Cell Rep 13: 2653–2662. 10.1016/j.celrep.2015.11.036 - DOI - PMC - PubMed

Publication types

MeSH terms

Substances

LinkOut - more resources