

Geo-social gradients in predicted COVID-19 prevalence in Great Britain: results from 1 960 242 users of the COVID-19 Symptoms Study app
- PMID: 33376145
- PMCID: PMC8223682
- DOI: 10.1136/thoraxjnl-2020-215119
Geo-social gradients in predicted COVID-19 prevalence in Great Britain: results from 1 960 242 users of the COVID-19 Symptoms Study app
Abstract
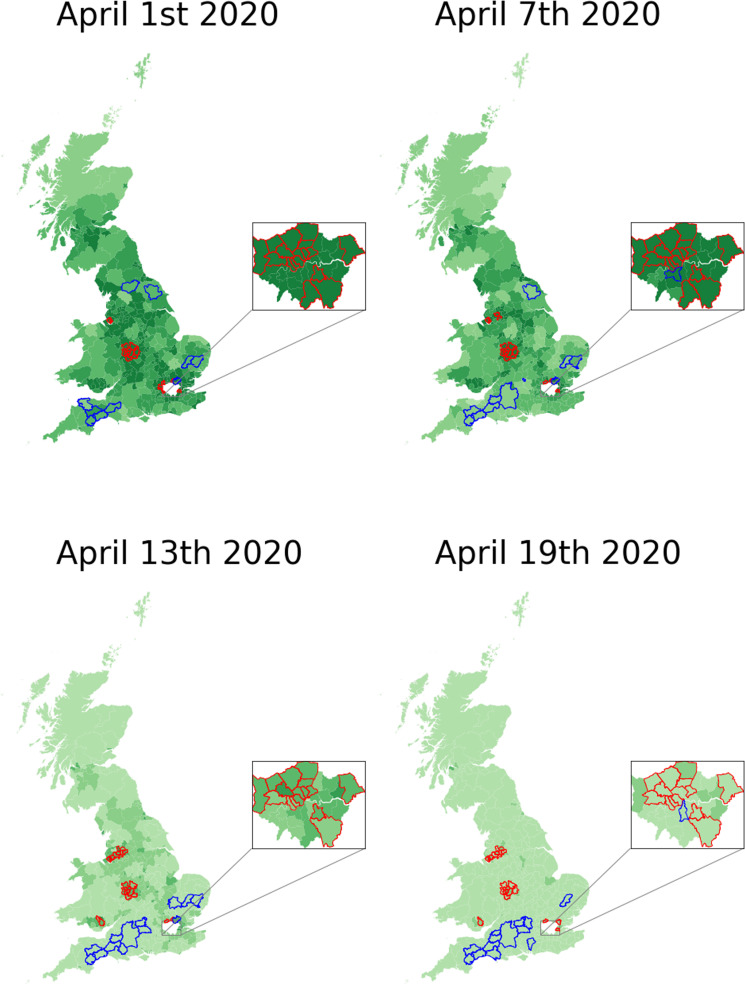
Understanding the geographical distribution of COVID-19 through the general population is key to the provision of adequate healthcare services. Using self-reported data from 1 960 242 unique users in Great Britain (GB) of the COVID-19 Symptom Study app, we estimated that, concurrent to the GB government sanctioning lockdown, COVID-19 was distributed across GB, with evidence of 'urban hotspots'. We found a geo-social gradient associated with predicted disease prevalence suggesting urban areas and areas of higher deprivation are most affected. Our results demonstrate use of self-reported symptoms data to provide focus on geographical areas with identified risk factors.
Keywords: clinical epidemiology; infection control.
© Author(s) (or their employer(s)) 2021. Re-use permitted under CC BY. Published by BMJ.
Conflict of interest statement
Competing interests: TDS is a consultant to Zoe Global Ltd ('Zoe'). SG, JC, EB, RD and JW are or have been employees of Zoe Global Limited. Other authors have no conflict of interest to declare.
Figures
Similar articles
-
Risk factors and disease profile of post-vaccination SARS-CoV-2 infection in UK users of the COVID Symptom Study app: a prospective, community-based, nested, case-control study.Lancet Infect Dis. 2022 Jan;22(1):43-55. doi: 10.1016/S1473-3099(21)00460-6. Epub 2021 Sep 1. Lancet Infect Dis. 2022. PMID: 34480857 Free PMC article.
-
Syndromic Surveillance Insights from a Symptom Assessment App Before and During COVID-19 Measures in Germany and the United Kingdom: Results From Repeated Cross-Sectional Analyses.JMIR Mhealth Uhealth. 2020 Oct 9;8(10):e21364. doi: 10.2196/21364. JMIR Mhealth Uhealth. 2020. PMID: 32997640 Free PMC article.
-
Current smoking and COVID-19 risk: results from a population symptom app in over 2.4 million people.Thorax. 2021 Jul;76(7):714-722. doi: 10.1136/thoraxjnl-2020-216422. Epub 2021 Jan 5. Thorax. 2021. PMID: 33402392
-
Mobile Health Apps on COVID-19 Launched in the Early Days of the Pandemic: Content Analysis and Review.JMIR Mhealth Uhealth. 2020 Sep 16;8(9):e19796. doi: 10.2196/19796. JMIR Mhealth Uhealth. 2020. PMID: 32609622 Free PMC article. Review.
-
The COronavirus Pandemic Epidemiology (COPE) Consortium: A Call to Action.Cancer Epidemiol Biomarkers Prev. 2020 Jul;29(7):1283-1289. doi: 10.1158/1055-9965.EPI-20-0606. Epub 2020 May 5. Cancer Epidemiol Biomarkers Prev. 2020. PMID: 32371551 Free PMC article. Review.
Cited by
-
Abortion care in a pandemic: an analysis of the number and social profile of people requesting and receiving abortion care during the first COVID-19 lockdown (March 16 to June 14, 2020) in Flanders, Belgium.Arch Public Health. 2021 Aug 4;79(1):140. doi: 10.1186/s13690-021-00665-6. Arch Public Health. 2021. PMID: 34344468 Free PMC article.
-
Household transmission of seasonal coronavirus infections: Results from the Flu Watch cohort study.Wellcome Open Res. 2020 Jun 19;5:145. doi: 10.12688/wellcomeopenres.16055.1. eCollection 2020. Wellcome Open Res. 2020. PMID: 33553677 Free PMC article.
-
Inequalities in SARS-CoV-2 case rates by ethnicity, religion, measures of socioeconomic position, English proficiency, and self-reported disability: cohort study of 39 million people in England during the alpha and delta waves.BMJ Med. 2023 Feb 27;2(1):e000187. doi: 10.1136/bmjmed-2022-000187. eCollection 2023. BMJ Med. 2023. PMID: 37063237 Free PMC article.
-
Symptom prevalence, duration, and risk of hospital admission in individuals infected with SARS-CoV-2 during periods of omicron and delta variant dominance: a prospective observational study from the ZOE COVID Study.Lancet. 2022 Apr 23;399(10335):1618-1624. doi: 10.1016/S0140-6736(22)00327-0. Epub 2022 Apr 7. Lancet. 2022. PMID: 35397851 Free PMC article.
-
Detecting COVID-19 infection hotspots in England using large-scale self-reported data from a mobile application: a prospective, observational study.medRxiv [Preprint]. 2020 Nov 17:2020.10.26.20219659. doi: 10.1101/2020.10.26.20219659. medRxiv. 2020. Update in: Lancet Public Health. 2021 Jan;6(1):e21-e29. doi: 10.1016/S2468-2667(20)30269-3. PMID: 33140073 Free PMC article. Updated. Preprint.
References
-
- Stier A, Berman M, Bettencourt L. COVID-19 attack rate increases with City size, 2020. Available: https://papersssrncom/sol3/paperscfm?abstract_id=3564464