. 2021 Jan 12;118(2):e2016034118.
doi: 10.1073/pnas.2016034118.

Altered Cl- homeostasis hinders forebrain GABAergic interneuron migration in a mouse model of intellectual disability

Affiliations

Altered Cl- homeostasis hinders forebrain GABAergic interneuron migration in a mouse model of intellectual disability

Andrea Maset et al. Proc Natl Acad Sci U S A. .

Abstract

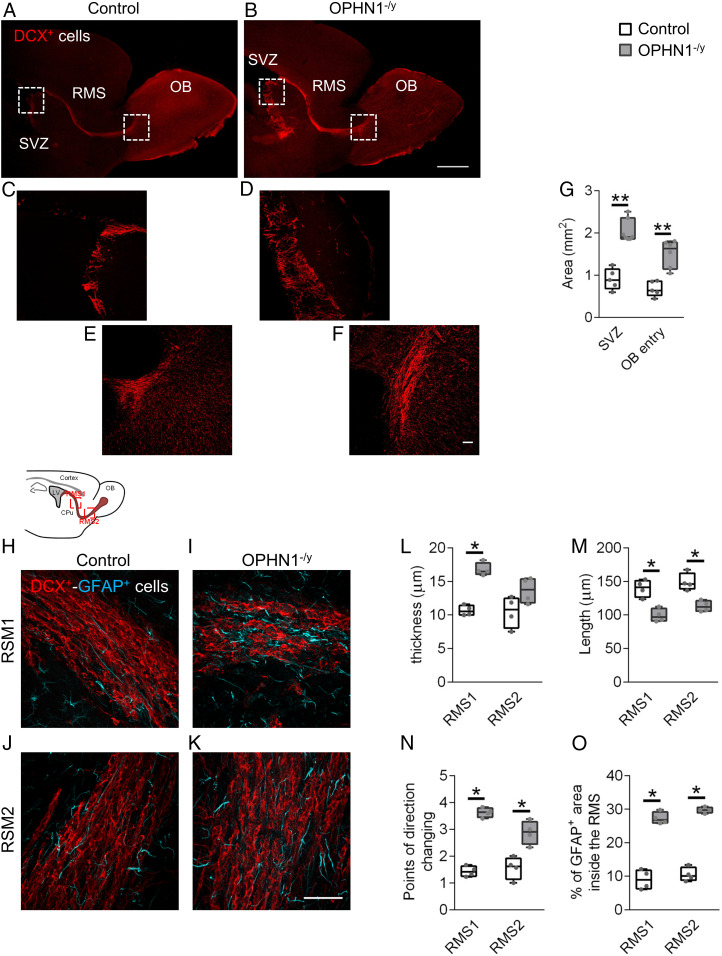
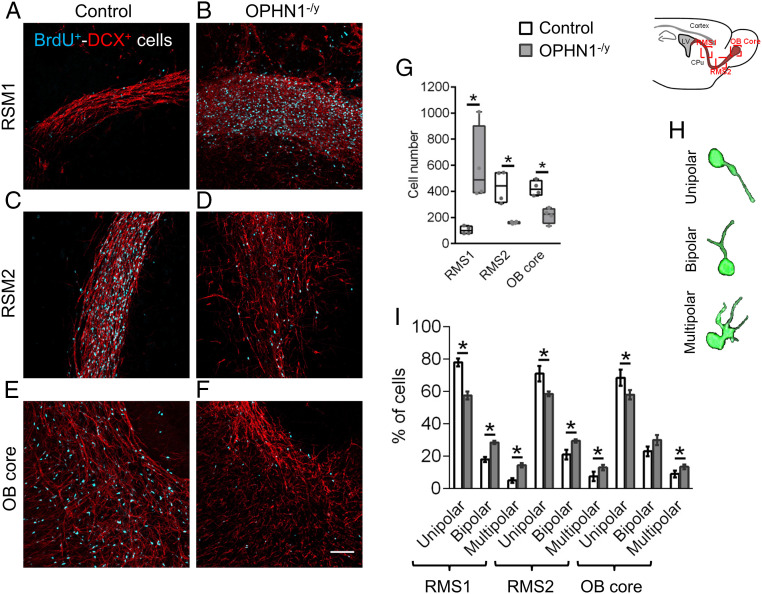
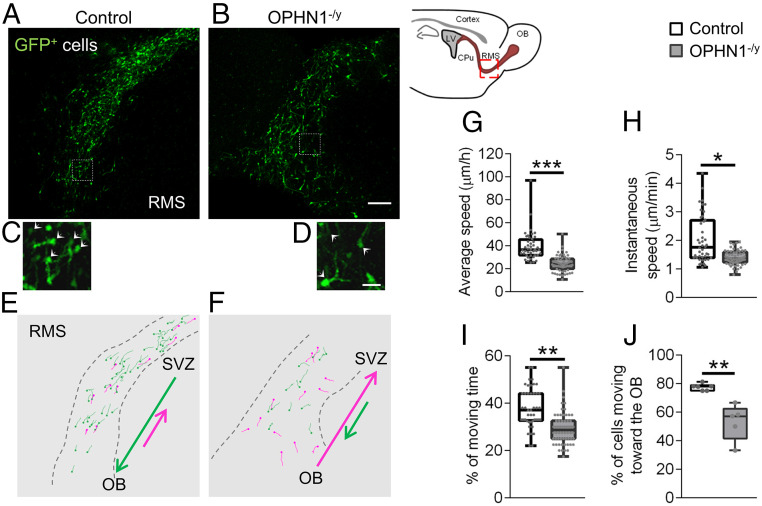
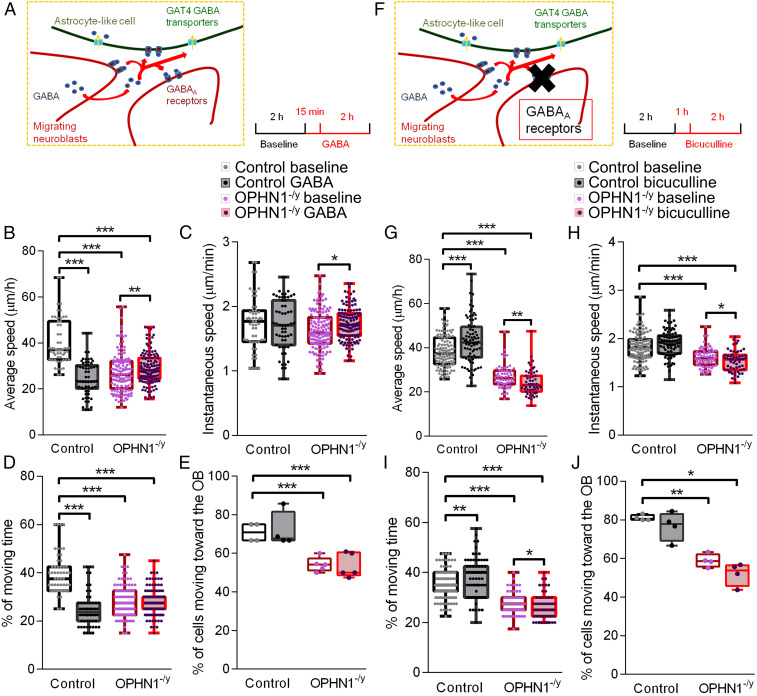
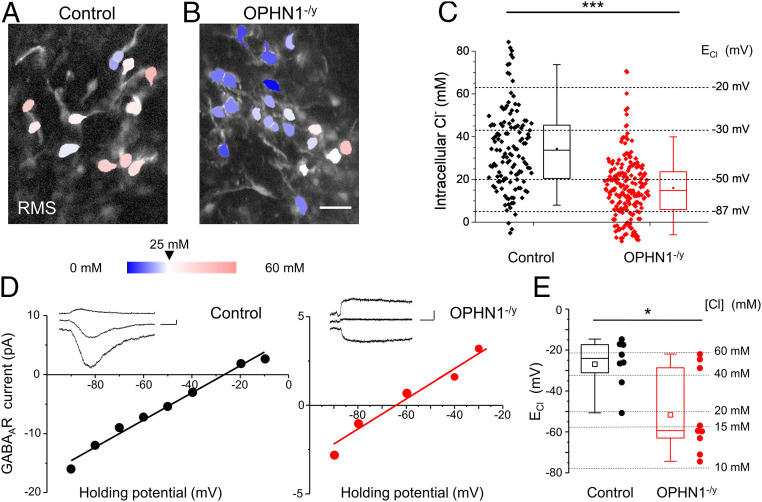
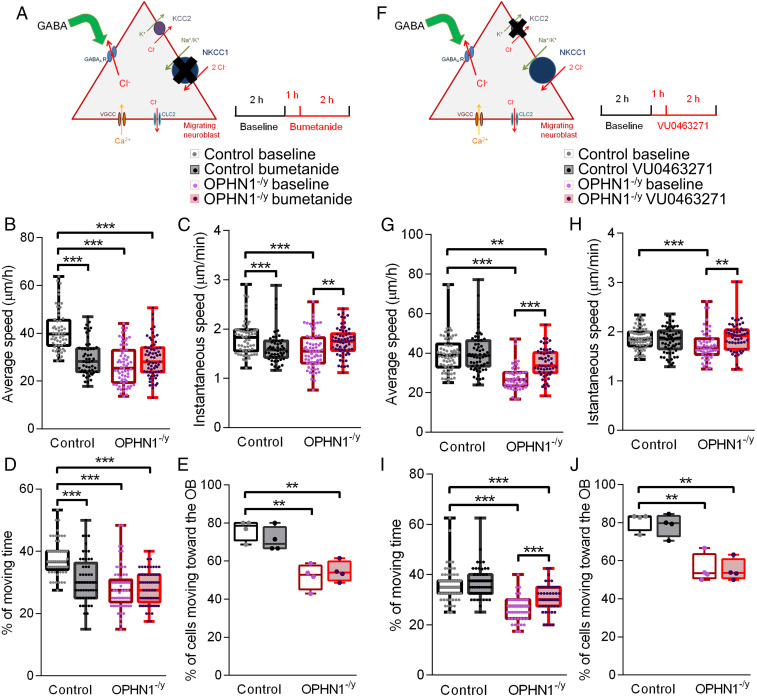
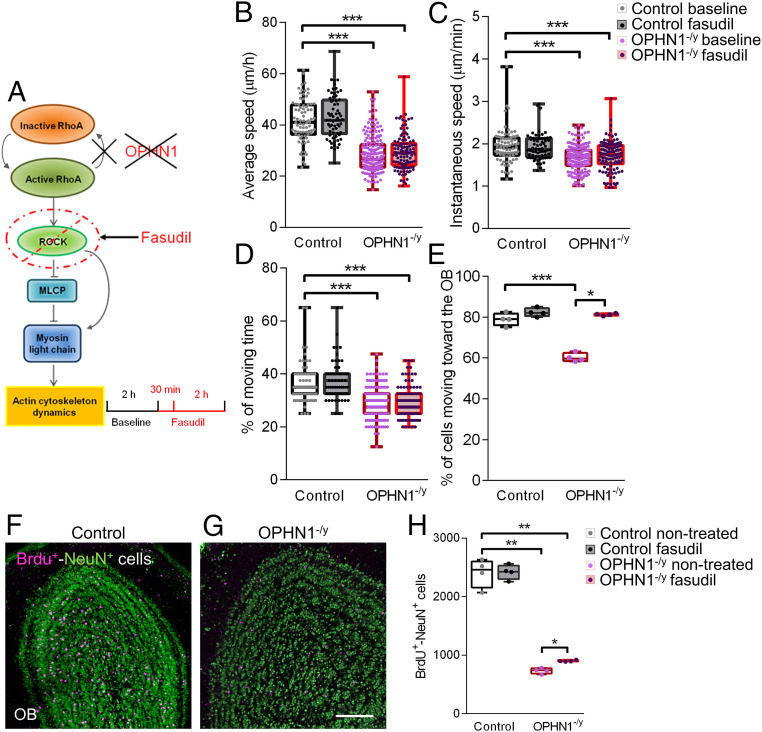
Impairments of inhibitory circuits are at the basis of most, if not all, cognitive deficits. The impact of OPHN1, a gene associate with intellectual disability (ID), on inhibitory neurons remains elusive. We addressed this issue by analyzing the postnatal migration of inhibitory interneurons derived from the subventricular zone in a validated mouse model of ID (OPHN1-/y mice). We found that the speed and directionality of migrating neuroblasts were deeply perturbed in OPHN1-/y mice. The significant reduction in speed was due to altered chloride (Cl-) homeostasis, while the overactivation of the OPHN1 downstream signaling pathway, RhoA kinase (ROCK), caused abnormalities in the directionality of the neuroblast progression in mutants. Blocking the cation-Cl- cotransporter KCC2 almost completely rescued the migration speed while proper directionality was restored upon ROCK inhibition. Our data unveil a strong impact of OPHN1 on GABAergic inhibitory interneurons and identify putative targets for successful therapeutic approaches.

Keywords: 2P imaging; Cl homeostasis; OPHN1; intellectual disability; interneuron migration.


Conflict of interest statement

The authors declare no competing interest.

Figures

Fig. 1.
Fig. 1.
Spatial organization of neuronal precursors along the RMS is altered in OPHN1−/y mice. (A and B) Low-magnification images of sagittal forebrain sections containing the SVZ, the RMS, and the OB. Migrating neuroblasts along the RMS are labeled with DCX (in red) in WT mice (A) and in OPHN1−/y mice (B). In OPHN1−/y mice the spatial distribution of the neuroblasts along the RMS is disrupted with respect to littermate controls. (CF) High magnification of the regions highlighted in the dotted squares: the SVZ in WT mice (C) and OPHN1−/y mice (D) and the entry of the RMS into the OB in WT mice (E) and OPHN1−/y mice (F). The orderly arrangement of chains (Left) is deeply subverted in OPHN1−/y mice (Right). (Scale bars: A and B, 1 mm; CF, 100 µm.) (G) Quantification of the areas highlighted in CF in OPHN1−/y mice and WT mice. Bars = minimum to maximum. P values: 0.001 < ** < 0.01. (HK) High-magnification images of the caudal (RMS1; H, I) and central (RMS2; J, K) portion of the RMS in control and OPHN1−/y mice. Migrating neuroblasts are labeled with DCX (in red), astrocytic processes are labeled with GFAP (in cyan). (Scale bar: 50 µm.) In controls, astrocytic processes run parallel to the orderly distributed chains of migrating cells, while in OPHN1−/y mice they appear thicker and invade untidy chains of migrating neuroblasts. (LO) Quantification of the geometrical arrangement of neuroblasts’ chains along the RMS in control mice and in OPHN1−/y mice in the two regions of interest. (L) Chains’ thickness in RMS1 and in RMS2. (M) Chains’ length in RMS1 and in RMS2. (N) Number of breaking points in RMS1 and in RMS2. (O) Areas occupied by astrocytic processes in RMS1 and in RMS2. Bars = minimum to maximum. P values: 0.01 < * < 0.05.
Fig. 2.
Fig. 2.
Neuronal precursors distribution and morphology are perturbed in OPHN1−/y mice. (AF) Distinct distribution of the complement of newly generated cells, stained with BrdU (in cyan) along the stream of migrating labeled with DCX (in red) in control mice (A, C, and E) and OPHN1−/y mice (B, D, and F) (Scale bar: 200 µm.) (G) Quantitative analysis of neuronal precursors distribution in control and in OPHN1−/y mice in RMS1, in RMS2 and in the core of the OB. Bars = minimum to maximum. P values: 0.01 < * < 0.05. (H and I) Morphological types of migrating neuroblasts. Examples of different neuroblast types in which the green fluorescence was enhanced to saturation, offline (H), and their quantification (I) along the RMS at 7 dpi in control mice and OPHN1−/y mice in RMS1, RMS2, and in the core of the OB. Bars = SEM. P values: 0.01 < * < 0.05.
Fig. 3.
Fig. 3.
Migration of neuronal precursors along the RMS is deeply hampered in OPHN1−/y mice. (A and B) Stop frames of time-lapse imaging of GFP-labeled neuroblasts in sagittal forebrain sections in control (A) and OPHN1−/y mice (B). (Scale bar: 100 µm.) (C and D) High magnification of the areas in the dotted squares in A and B, respectively. Neuroblasts, indicated by arrows, migrate toward the OB (C) and away from the OB (D). The direction of migration is dictated by the orientation of the leading processes. (Scale bar: 10 µm.) (E and F) Drawings of the cells in A and B, respectively. In green: cells migrating toward the OB; in magenta: cells migrating away from the OB. (GJ) Quantitative analysis of the migration along the RMS in control mice and in OPHN1−/y mice. (G) Average migration speed. (H) Instantaneous speed. (I) Percentage of moving time. (J) Directionality of migration. Bars = minimum to maximum. P values: 0.01 < * < 0.05; 0.001 < ** < 0.01; *** < 0.001.
Fig. 4.
Fig. 4.
GABA elicits opposite effects on the motility of neuronal precursors in control and OPHN1−/y mice. (A and F) Schematic of the source and targets of GABA along the RMS. GABA is produced by neuronal precursors (outlined in dark red) on which it acts, via GABAA receptors, in a paracrine and autocrine manner. The level of ambient GABA in the RMS is thought to be maintained through a balance between GABA secretion by neuroblasts and GABA uptake, by specialized astrocytes (outlined in dark green). The insets show the timing of drug delivery to the slices during time-lapse imaging. (BE) Effects of acute GABA application on slices during time-lapse imaging of migrating neuroblasts in WT mice (black boxes) and in OPHN1−/y mice (red boxes). (B) GABA reduces the average speed of neuroblasts in WT mice, while increases neuroblast motility in OPHN1−/y mice. (C) GABA increases instantaneous speed in OPHN1−/y mice but not in WT mice, whereas (D) it reduces the percentage of moving time only in controls. (E) Directionality of migration is not affected by GABA. (GJ) Impact of the GABA competitive antagonist, bicuculline, on migrating cells in WT mice (black boxes) and in OPHN1−/y mice (red boxes). (G) Acute bicuculline application increases average migration speed in controls, while it reduces the average speed in OPHN1−/y mice. (H) Bicuculline decreases instantaneous speed in OPHN1−/y mice, with no effect on WT mice, whereas (I) it lowers the percentage of moving time in control and in mutant mice. (J) Directionality of migration is not affected by bicuculline. Bars = minimum to maximum. P values: 0.01 < * < 0.05; 0.001 < ** < 0.01; *** < 0.001.
Fig. 5.
Fig. 5.
Low intracellular chloride concentration ([Cl]i) in neuroblasts in OPHN1−/y mice. (A and B) Representative pseudocolor two-photon images of LssClopHensor-labeled migrating neuroblasts along the RMS, in control mice (A) and OPHN1−/y mice (B), at 910-nm laser wavelength, and the relative lookup table. Cells with lower [Cl]i in blue, cells with higher [Cl]i in light red. (Scale bar: 200 µm.) (C) [Cl]i values (left y axis) and calculated ECl (right y axis) in neuronal precursors along the RMS in WT mice (black box) and in OPHN1−/y mice (red box). Bars = SD. P value: *** < 0.001. The intracellular chloride concentration is significantly lower in neuronal precursors in OPHN1−/y mice with respect to littermate controls. (D) Examples of current–voltage relationships of GABAA-mediated currents recorded in RMS neuroblasts by gramicidin-perforated patch-clamp experiments in slices from WT (D, Left) and OPHN1−/y (D, Right) mice. Chloride reversal potential (ECl) value is measured as x-axis intercept of linear fit. Insets show sample traces of muscimol induced GABAAR mediated currents at −90, −60, and −10 mV for WT and −90, −60, and −30 mV for OPHN1−/y. (Scale bars: 1 s, 2 pA.) (E) ECl values (left y axis) and calculated Cl intracellular concentrations ([Cl]i) (right y axis) for WT and OPHN1−/y mice. Migrating neuroblasts in OPHN1−/y mice show lower ECl that in WT mice. Bars = minimum to maximum. P value: 0.01 < * < 0.05.
Fig. 6.
Fig. 6.
Blocking the chloride cotransporters has opposite effects on the motility of neuroblasts in controls and OPHN1−/y mice. (A) Schematic of an immature neuron that mostly expresses the cotransporter NKCC1 which favors high intracellular Cl concentration ([Cl]i). The inset shows the scheme of bumetanide, a blocker of NKCC1, delivery in perfusion during time-lapse imaging. (BE) Impact of acute administration of bumetanide on neuroblast migration in controls (black boxes) and in OPHN1−/y mice (red boxes). (B) Bumetanide reduces average migration speed in WT mice, with no effect on OPHN1−/y mice. (C) Upon bumetanide application, instantaneous speed is reduced in controls while it is increased in mutants. (D) Bumetanide decreases the percentage of moving time in WT mice, with no effect on OPHN1−/y mice. (E) Directionality of migration is not affected by bumetanide. (F) Schematic of a mature neuron that mostly expresses the Cl cotransporter KCC2, which leads to low [Cl]i. The inset shows the scheme of VU0463271, a blocker of KCC2, delivery in perfusion during time-lapse imaging. (GJ) Effects of the blocker of KCC2 on the progression of migrating neuroblasts in controls (black boxes) and in OPHN1−/y mice (red boxes). Acute administration of VU0463271 has no effect on migration in controls; however, it significantly increases (G) average migration speed, (H) instantaneous speed, and (I) percentage of moving time in OPHN1−/y mice. (J) Directionality of migration is not affected by VU0463271. Bars = minimum to maximum. P values: 0.001 < ** < 0.01; *** < 0.001.
Fig. 7.
Fig. 7.
The ROCK inhibitor fasudil rescues the directionality, without affecting the speed of neuronal precursors in OPHN1−/y mice. (AE) (A) Schematic of fasudil target: Fasudil inhibits the ROCK, thus blocking the overactivation of the RhoA/ROCK pathway caused by the loss of function of OPHN1. Bars = minimum to maximum. P values: 0.01 < * < 0.05; *** < 0.001. (BE) Effect of acute fasudil administration on the migration of neuroblasts in control mice (black boxes) and OPHN1−/y mice (red boxes). (B) Average migration speed. (C) Instantaneous speed. (D) Percentage of moving time. (E) Directionality of migration. Acute fasudil treatment does not affect any of the analyzed parameters of migration in controls; however, in OPHN1−/y mice it completely rescues the directionality of migration of neuronal precursors, without affecting the speed of migration. (F and G) Representative confocal images of coronal sections of the OB labeled with neuronal nuclei (NeuN, in green) and BrdU (in magenta) in WT mice (F) and in OPHN1−/y mice (G). (Scale bar: 200 µm.) (H) Quantification of newly generated granule cells in the OB at 9 dpi of BrdU upon chronic fasudil treatment in controls and in OPHN1−/y mice. Chronic fasudil treatment did not rescue the complement of adult-born immature interneurons at 9 dpi in the OB of OPHN1−/y mice. Bars = minimum to maximum. P values: 0.01 < * < 0.05; 0.001 < ** < 0.01.

Similar articles

Cited by

References

    1. Billuart P., et al. , Oligophrenin 1 encodes a rho-GAP protein involved in X-linked mental retardation. Pathol. Biol. (Paris) 46, 678 (1998). - PubMed
    1. Fauchereau F., et al. , The RhoGAP activity of OPHN1, a new F-actin-binding protein, is negatively controlled by its amino-terminal domain. Mol. Cell. Neurosci. 23, 574–586 (2003). - PubMed
    1. Govek E. E., et al. , The X-linked mental retardation protein oligophrenin-1 is required for dendritic spine morphogenesis. Nat. Neurosci. 7, 364–372 (2004). - PubMed
    1. Billuart P., Chelly J., Gilgenkrantz S., [X-linked mental retardation]. Med. Sci. (Paris) 21, 947–953 (2005). - PubMed
    1. Khelfaoui M., et al. , Loss of X-linked mental retardation gene oligophrenin1 in mice impairs spatial memory and leads to ventricular enlargement and dendritic spine immaturity. J. Neurosci. 27, 9439–9450 (2007). - PMC - PubMed

Publication types

MeSH terms