. 2020 Dec 29;117(52):33586-33596.
doi: 10.1073/pnas.2011870117. Epub 2020 Dec 21.

Hidden proteome of synaptic vesicles in the mammalian brain

Affiliations

Hidden proteome of synaptic vesicles in the mammalian brain

Zacharie Taoufiq et al. Proc Natl Acad Sci U S A. .

Abstract

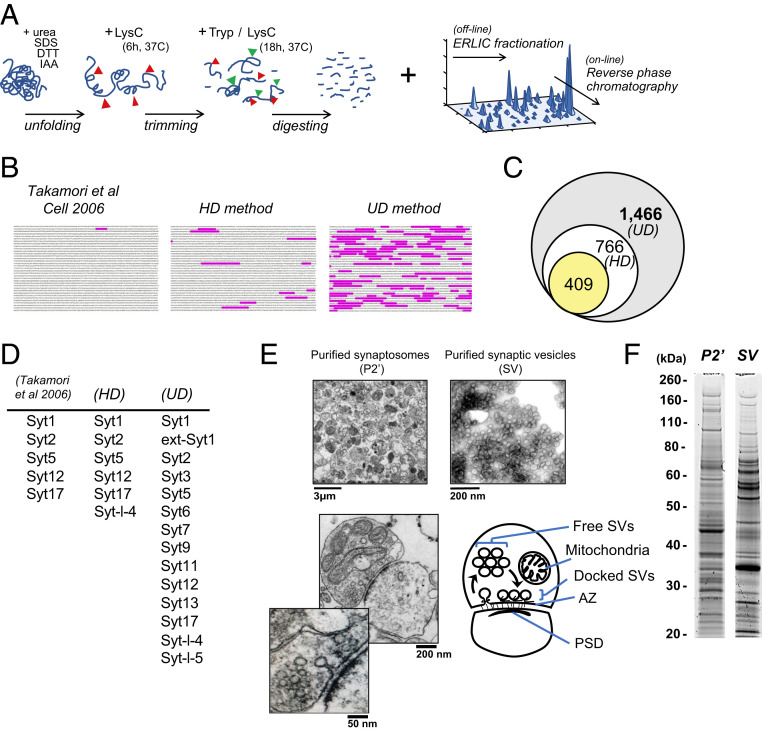
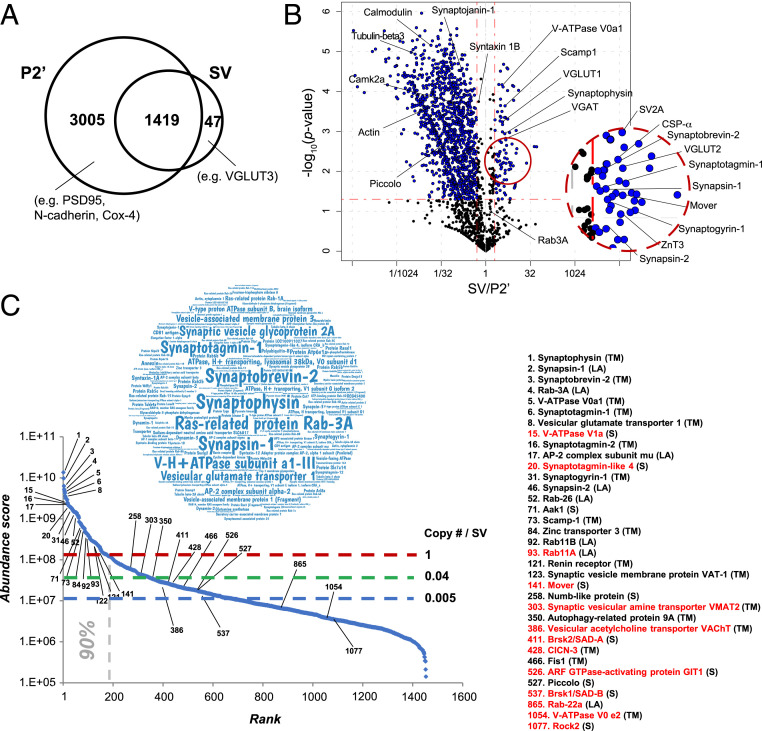
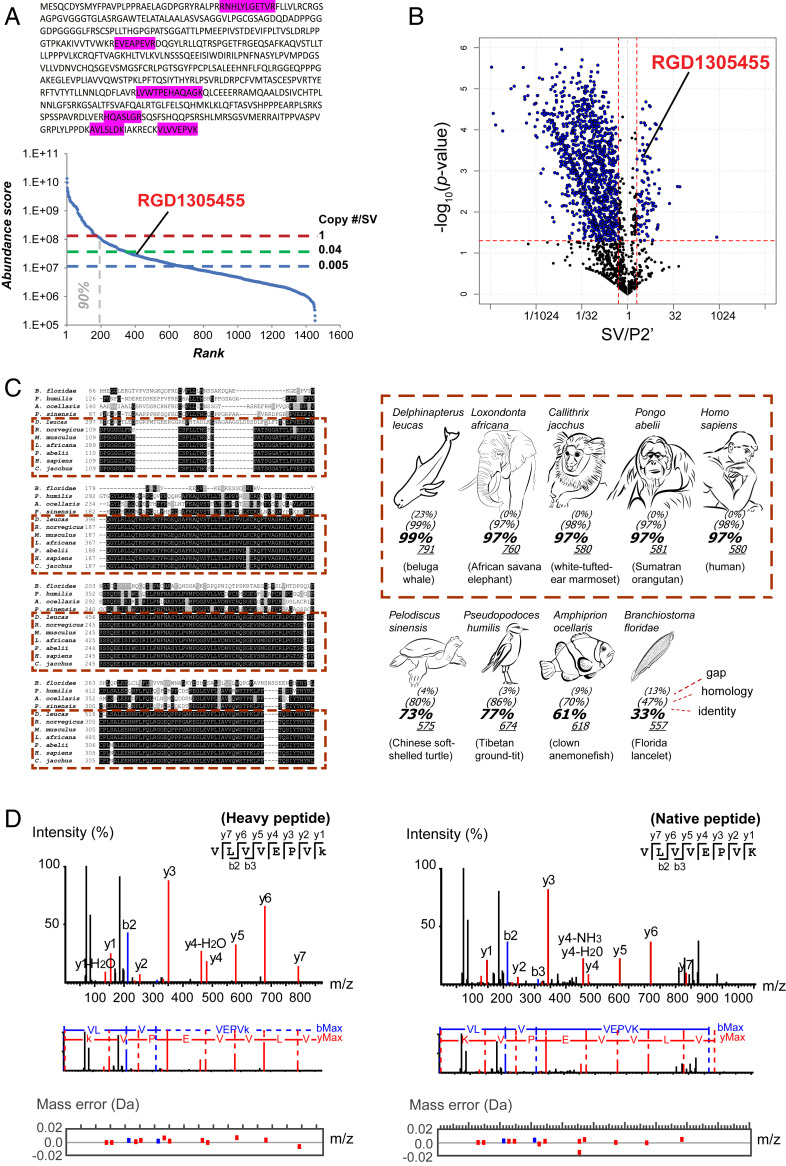
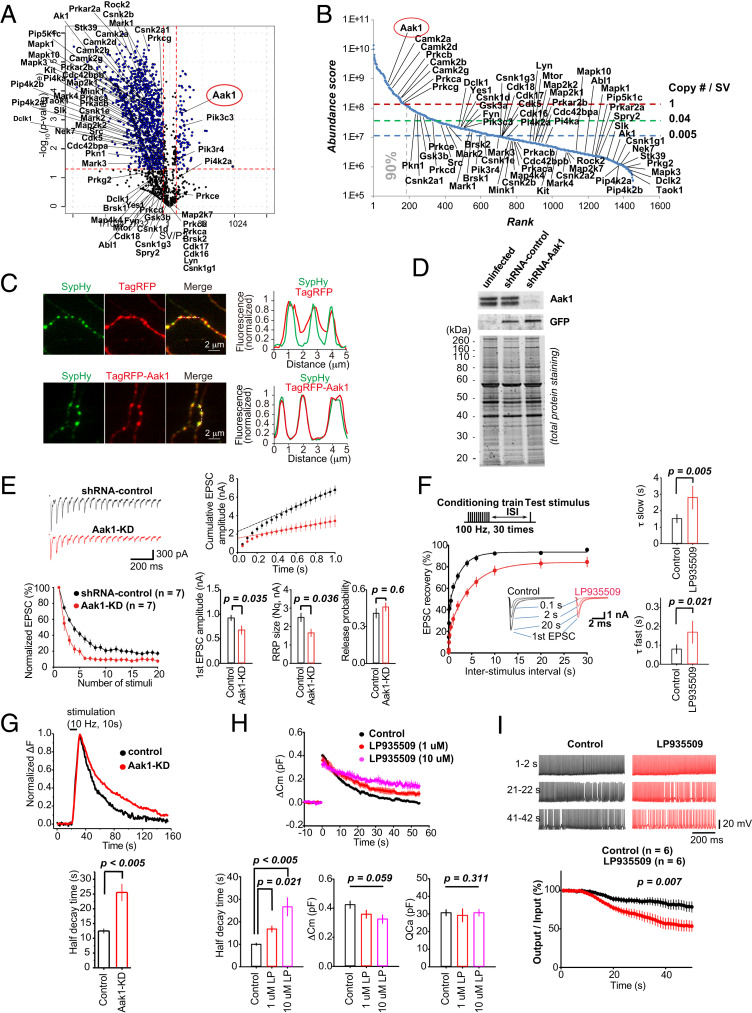
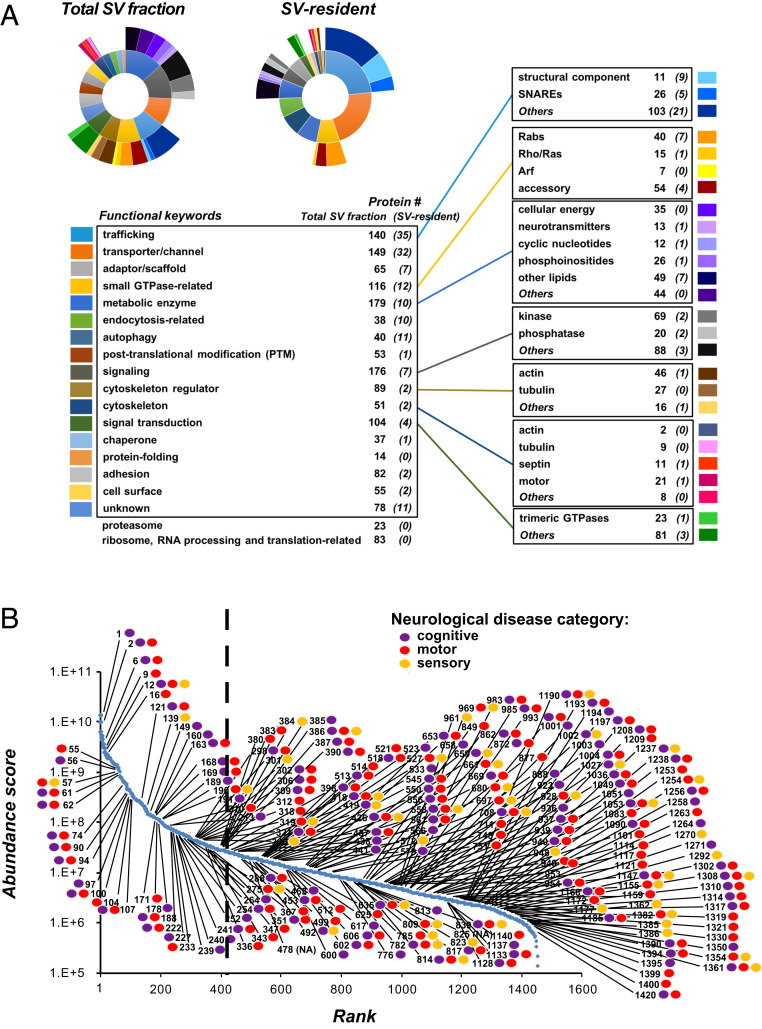
Current proteomic studies clarified canonical synaptic proteins that are common to many types of synapses. However, proteins of diversified functions in a subset of synapses are largely hidden because of their low abundance or structural similarities to abundant proteins. To overcome this limitation, we have developed an "ultra-definition" (UD) subcellular proteomic workflow. Using purified synaptic vesicle (SV) fraction from rat brain, we identified 1,466 proteins, three times more than reported previously. This refined proteome includes all canonical SV proteins, as well as numerous proteins of low abundance, many of which were hitherto undetected. Comparison of UD quantifications between SV and synaptosomal fractions has enabled us to distinguish SV-resident proteins from potential SV-visitor proteins. We found 134 SV residents, of which 86 are present in an average copy number per SV of less than one, including vesicular transporters of nonubiquitous neurotransmitters in the brain. We provide a fully annotated resource of all categorized SV-resident and potential SV-visitor proteins, which can be utilized to drive novel functional studies, as we characterized here Aak1 as a regulator of synaptic transmission. Moreover, proteins in the SV fraction are associated with more than 200 distinct brain diseases. Remarkably, a majority of these proteins was found in the low-abundance proteome range, highlighting its pathological significance. Our deep SV proteome will provide a fundamental resource for a variety of future investigations on the function of synapses in health and disease.

Keywords: brain disorders; deep proteomics; neurotransmission; synapse; synaptic vesicles.


Conflict of interest statement

Competing interest statement: R.J. (author) and A.B.S. (reviewer) are coauthors on a 2019 SynGO consortium article [F. Koopmans et al., Neuron 103, 217–234 (2019)].

Figures

Fig. 1.
Fig. 1.
UD proteomics tripled the known SV proteome size. (A) Key steps in the UD proteomics method: sequential enzymatic digestion steps followed by orthogonal peptide separations using multiple biophysical properties of amino acids (SI Appendix, Fig. S1) (IAA, iodoacetamide). (B) Unique peptide coverage by MS of the AZ protein Piccolo (highlighted amino acid sequence) in Takamori et al. (2), HD and UD proteomic methods. (C) Numbers of proteins identified in the SV fraction by Takamori et al. (2) (yellow), HD (white), and UD (gray) methods. (D) Syt family members identified in the SV fraction by Takamori et al. (2), HD and UD methods. (E) EM images of the purified synaptosome (P2′) and SV fractions, showing clear vesicles with diameters of ∼40 nm. (Bottom) Representative synaptic structures in the P2′ fraction in EM images, showing intact subsynaptic compartments, as illustrated (PSD, postsynaptic density). (F) SDS/PAGE profiles of proteins extracted from the P2′ and SV fractions.
Fig. 2.
Fig. 2.
Synaptosomal organization and diversity of the SV proteome revealed by UD proteomics . (A) Numbers of synaptosomal proteins detected in either or both P2′ and SV fractions. (B) Volcano plot showing synaptosomal protein distribution in SV over P2′ fractions; x axis (log2 scale), mean iBAQ (SV/P2′) ratio; y axis (log10 scale), probability of statistical significance (P value, from three independent experiments). The horizontal red dashed line indicates P = 0.05; vertical dashed lines indicate ratios of 1/2 and 2, respectively. (C) Relative abundance of SV proteins in a “word cloud” representation (Inset) and in a ranked (iBAQ) abundance curve of the SV proteome. Shown are estimated copy numbers per SV (SI Appendix, Fig. S3) are indicated with horizontal dashed lines. The vertical dashed line indicates proteins accounting for 90% of the total mass of SV. Names of representative proteins are indicated. Previously undetected SV proteins are marked in red. Abbreviations in parentheses denote the following: TM, transmembrane; LA, lipid-anchored; and S, soluble proteins.
Fig. 3.
Fig. 3.
UD proteomics unveiled hidden proteins in both high- and low-abundance ranges of the SV proteome. (A) UD proteomics distinguish highly homologous protein isoforms, Rab11A and Rab11B. (Left) Positions of Rab11A and Rab11B in the ranked (iBAQ) abundance curve. (Middle) Amino acid sequence alignment of Rab11A and Rab11B, showing 91% identity. (Right) List of unique Rab11 peptides detected in the SV fraction by HD and UD methods. Rab11A is identified only by UD from a unique peptide at the C-terminal region of Rab GTPase. (B, Left) V-ATPase–related proteins detected in the SV fraction on the ranked (iBAQ) abundance curve. Right illustration: Structural model of the V-ATPase protein V0 (a, c, and d) and V1 (A to H) subunits in SVs. Proteins revealed by UD proteomics are indicated in red. (C) SV-resident transporter proteins revealed in the SV fraction by UD proteomics (red), known but missing in previous proteomic studies (purple) in the SV-P2′ volcano plot (Left) and Venn diagram (Right Top). (Right Bottom) Position of the transporters in the ranked (iBAQ) abundance curve of the SV proteome.
Fig. 4.
Fig. 4.
A previously hidden SV-resident protein shows high amino acid sequence homology among mammals. (A) “Uncharacterized Protein RGD1305455” (Uniprot ID A0A0G2KAX2), identified in UD proteomics from unique peptides (highlighted within amino acid sequence) and its position in the ranked (iBAQ) abundance plot (Lower). No unique peptide could be detected with the HD method. (B) SV-resident position of RGD1305455 in the SV-P2′ volcano plot. (C) Amino acid sequence comparison of RGD1305455 homologs in various animal species. Black and gray shading indicates identical and similar amino acids, respectively. Dashes represent gaps in sequences. See SI Appendix, Table S4 for protein accession numbers and reference sequences. Mammal species are framed in dashed red line boxes (Left) and species pictures with >97% identity (Right). (D) Confirmation of the existence of RGD1305455 protein in the SV fraction using a targeted proteomic approach. VLVVEPVK peptide (detected in UD proteomics) was synthesized using C-terminal “heavier” [13C6 15N2] lysine (+ eight neutrons = a predefined shift of 8 Da) and was used to track native peptides after mixing with digested SV proteins. (Left) MS2 spectra of heavy VLVVEPVK peptide. (Right) MS2 spectra of a native peptide detected in the SV fraction that coincides with that of the heavy peptide. Red, blue, and black peaks indicate matched y-ion series, b-ion series, and unmatched ions respectively (Upper). (Middle) Amino acid sequences corresponding to the ion fragments. (Lower) Plotted mass errors of detected versus expected peptide fragments. Errors of native peptide fragments were all <0.02 dalton. Expected masses of all fragments are specified in SI Appendix, Table S5.
Fig. 5.
Fig. 5.
Aak1 is an SV-attached protein kinase essential for high-frequency neurotransmission. (A) SV/P2′ volcano plot of 69 kinases detected in the SV fraction by UD proteomics. Labels indicate names of genes encoding proteins. Aak1 (circled in red) is one of the few identified SV-residents. (B) SV kinases in the abundance curve. Aak1 is the most abundant of SV kinases. (C) Colocalization of exogenously expressed Aak1 and synaptophysin (SypHy) in cultured hippocampal neurons. (Upper) Control TagRFP (red) and SypHy (green) images and their line-scanned profiles (Right). (Lower) TagRFP-Aak1 (red) and SypHy (green) images and their line-scan profiles showing complete colocalization. (D) Lentivirus KD efficiency of Aak1 confirmed at DIV15 by Western blot analysis. Hippocampal cells were infected at DIV 11 to 12 with lentivirus coexpressing GFP and shRNA targeting Aak1. (E) Aak1-KD enhanced STD of EPSCs and reduced estimated readily releasable pool (RRP) size of SVs (Nq) evoked by a 20-Hz train of stimulation in Aak1-KD (red, n = 7) or shRNA control (black, n = 7) neurons. (F) LP935509 (1 μM) slowed both fast and slow components of recovery from STD (100 Hz) at the calyx of Held (red traces, n = 6, stimulation protocol indicated on the Top). EPSCs at different interstimulus intervals (ISIs) are shown in Insets. (G) Aak1-KD slowed endocytic SV fluorescence in response to stimulation in pHluorin analyses in hippocampal neurons. Aak1-KD (red), n = 16 neurons, 51 boutons; and control (black), n = 10 neurons, and 20 boutons. (H) LP935509 (1 or 10 μM) prolonged the SV endocytic half-time (P < 0.001, n = 6 at 1 μM and n = 4 at 10 μM: 4; one-way ANOVA: F(2, 13) = 16.81] without affecting exocytic [P = 0.059, F(2, 13) = 2.53] or presynaptic Ca2+ current magnitudes [P = 0.511, F(2, 13) = 0.15] in membrane capacitance measurements at the calyx of Held. (I) LP935509 (1 μM) impaired fidelity of glutamatergic neurotransmission at 100-Hz at the calyx of Held. (Top) Postsynaptic APs evoked by presynaptic APs in the presence (red) or absence (black) of LP935509 in presynaptic terminals. (Bottom) Percentages of postsynaptic APs elicited by presynaptic APs, controls (n = 6) and the Aak1 inhibitor (n = 6).
Fig. 6.
Fig. 6.
Diversity of neuronal functions and dysfunctions related to the UD-SV proteome. (A) Functional mosaic of the SV proteome. Each protein detected in the SV fraction by UD proteomics was associated with one or more functional keywords. (Top Left) Sunburst diagrams show distributions of the functional categories (inner circle) and subcategories (outer circle) represented in the total SV fraction proteome and in the SV-resident repertoire. Shown is a list of functional keywords (Left) and subcategories (Right) with number of proteins representing each category (for details of protein functional annotations, see Dataset S1). (B) The deep low-abundant SV proteome is related to brain diseases. Proteins detected in the SV fraction having “disease(s) caused by mutation(s) affecting the gene represented in the entry” were marked, and their rank in the iBAQ-abundance curve is specified. The analysis was performed manually using the Uniprot and GeneCards databases for human diseases. Markers indicate proteins associated with cognitive (purple), motor (red), and/or sensory processing (yellow) disabilities. The vertical dashed line indicates rank 409, the number of proteins identified by a previous SV proteomics study [Takamori et al. (2)]. Proteins to the right hand of the dashed line were mostly revealed by UD proteomics (see Dataset S1 for a listing of all disease names and protein associations).

Similar articles

Cited by

References

    1. Biesemann C., et al. , Proteomic screening of glutamatergic mouse brain synaptosomes isolated by fluorescence activated sorting. EMBO J. 33, 157–170 (2014). - PMC - PubMed
    1. Takamori S., et al. , Molecular anatomy of a trafficking organelle. Cell 127, 831–846 (2006). - PubMed
    1. Bayés A., et al. , Comparative study of human and mouse postsynaptic proteomes finds high compositional conservation and abundance differences for key synaptic proteins. PLoS One 7, e46683 (2012). - PMC - PubMed
    1. Boyken J., et al. , Molecular profiling of synaptic vesicle docking sites reveals novel proteins but few differences between glutamatergic and GABAergic synapses. Neuron 78, 285–297 (2013). - PubMed
    1. O’Rourke N. A., Weiler N. C., Micheva K. D., Smith S. J., Deep molecular diversity of mammalian synapses: Why it matters and how to measure it. Nat. Rev. Neurosci. 13, 365–379 (2012). - PMC - PubMed

Publication types

LinkOut - more resources