. 2020 Dec 29;10(1):22408.
doi: 10.1038/s41598-020-79755-4.

Uncovering the chemistry behind inducible morphological defences in the crustacean Daphnia magna via micro-Raman spectroscopy

Affiliations

Uncovering the chemistry behind inducible morphological defences in the crustacean Daphnia magna via micro-Raman spectroscopy

Sven Ritschar et al. Sci Rep. .

Abstract

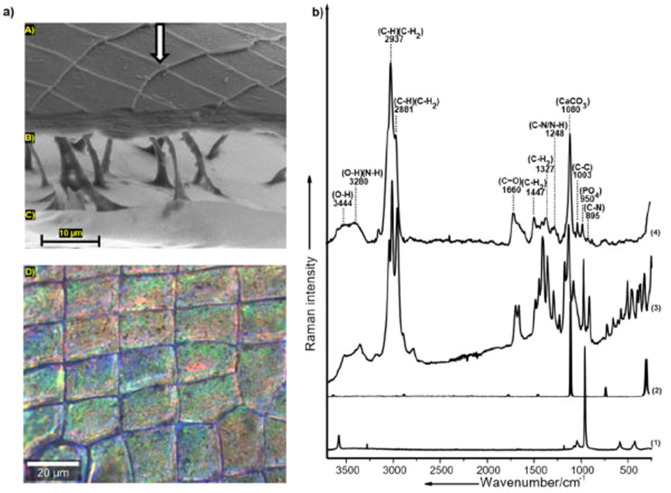
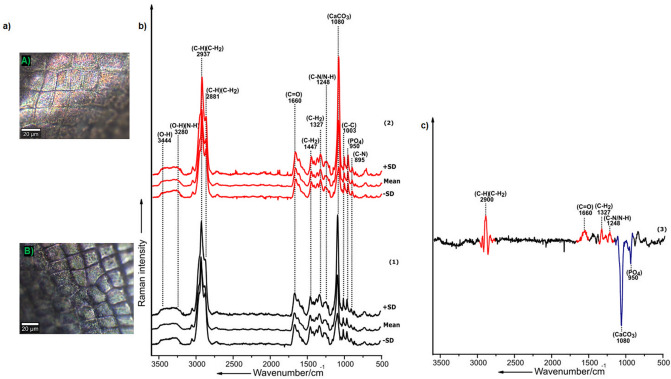
The widespread distribution of Crustacea across every aquatic ecological niche on Earth is enabled due to their exoskeleton's versatile properties. Especially mineralization of the exoskeleton provides protection against diverse environmental threats. Thereby, the exoskeleton of some entomostracans is extremely phenotypically plastic, especially in response to predators. For instance, the freshwater zooplankton Daphnia forms conspicuous inducible morphological defenses, such as helmets, and can increase the stability of its exoskeleton, which renders them less vulnerable to predation. In this study, we reveal for the first time the chemical composition of the exoskeleton of Daphnia magna, using Raman spectroscopy, to be composed of α-chitin and proteins with embedded amorphous calcium carbonate (ACC). Furthermore, we reveal the exoskeleton's chemical changes associated with inducible defense mechanisms in the form of more substantial mineralization, which is probably correlated with enhanced carapace stability. We, therefore, highlight the importance of calcium-biominerals for inducible morphological defenses in Daphnia.


Conflict of interest statement

The authors declare no competing interests.

Figures

Figure 1
Figure 1
Characterization of the chemistry of the distal integument of the carapace of D. magna via micro-Raman-spectroscopic-analysis; (a) SEM image of the carapace of D. magna highlighting the features of the carapace (A) distal integument (B) hemolymphatic chamber (C) proximal integument and (D) exemplary bright-field microscopic image representing the surface of the distal integument of the carapace used for the acquisition of Raman spectra (white arrow in the SEM image indicates the focal plane of the bright field microscopic image (b) mean Raman spectrum (calculated from n = 200 spectra acquired from 8 replicates (carapace samples) per treatment) of the distal integument of the carapace overlapped over spectra of the reference substances; (1) Hydroxyapatite reference, (2) Calcite reference, (3) α-Chitin reference and (4) Distal integument of the carapace.
Figure 2
Figure 2
Distribution of organic and inorganic components within the carapace of D. magna visualized via micro-Raman spectroscopic imaging; (a) (A) Bright-field microscopic image representing the distal integument of the carapace and (B) corresponding false colored Raman image acquired from an exemplary replicate sample indicating intensity-based differential distribution of the demixed spectral components color coded in orange (component 1) and blue (component 2), (b) Demixed Raman spectrum representing the organic and inorganic components of the carapace: (1) Component 1, representing spectral signatures corresponding to organic components (α-chitin and proteins) and (2) Component 2, representing spectral signatures comprising of both organic and inorganic components (ACC and phosphates). The color scale represents the relative intensity distribution (standard deviation) of component 1 and component 2 within the Raman image, respectively. The spectra of component 1 and component 2 are representing the respective mean spectrum calculated from n = 22,500 spectra constituting the Raman image analyzed via TCA analysis coupled with spectral demixing. The Raman image has been acquired from one D. magna carapace sample (n = 1).
Figure 3
Figure 3
Comparison of Triops-exposed and non-exposed D. magna. (a) Bright-field microscopic image of an individual D. magna. Comparison of (b) body length, (c) relative body width and d) relative tail spine length of Triops-exposed (Triops) and non-exposed (Control) D. magna. The black dots in (b–d) display the measurement of the respective body parameters of every animal used in the induction experiment, which is a total of 60 animals per treatment (Control vs Triops), separated in 6 replicates (1 replicate with 10 individual D. magna). The data is displayed as (b) the raw data (µm) and for (c,d) the relative values (%). Asterisks indicate statistically significance: * = P < 0.05, ** = P < 0.01 and *** = P < 0.001.
Figure 4
Figure 4
Detection of key chemical components of the carapace of D. magna in association with inducible defenses; (a) exemplary Bright-field microscopic images corresponding to the distal integument of the carapace (A) Carapace of control D. magna (B) Carapace of Triops-exposed D. magna, (b) mean Raman spectrum ± 1 standard deviations (SD) of the respective carapace samples (calculated from n = 200 Raman spectra, 25 per replicate acquired from 8 replicates (carapace samples) per group i.e. control and Triops-exposed D. magna); (1) Carapace of individuals of the control; (2) Carapace of Triops-exposed D. magna; c) Difference spectrum (calculated from n = 400 Raman spectra acquired from the 8 respective carapace samples of the two groups (Control and Triops-exposed D. magna) highlighting the major spectral differences between the carapaces of non-exposed (red colored regions) and Triops-exposed D. magna (blue colored regions).
Figure 5
Figure 5
PCA-LDA analysis of the Raman spectra acquired from the carapace samples of control and Triops-exposed D. magna; (a) loading of the PCA-LDA model for the differentiation of carapace samples of control and Triops-exposed D. magna; (b) PCA-LDA histogram plot, the horizontal axis describes the linear discriminant function values and the vertical axis the relative frequencies of each class. The histogram coded in black represents the control group and that coded in red represents the Triops-exposed group. The data analyzed was obtained from 8 replicates (carapace samples) per group constituting 25 spectra per replicate, meaning 200 spectra per treatment and a total of 400 spectra acquired across the two groups; (c) PCA-LDA score plot showing the variation between the two groups of samples, the black dots represent all the spectra of the control group (n = 200) and the red dots represent all the spectra of the Triops-exposed group (n = 200).
Figure 6
Figure 6
Distribution of ACC and phosphates within an exemplary control carapace sample and Triops-exposed carapace sample of D. magna monitored via micro-Raman spectroscopic imaging. Upper panel: (a) Bright-field microscopic image of the surface of the control carapace sample, (b) mean Raman spectrum ± 1 standard deviations (SD) of the respective carapace (calculated from n = 22,500 Raman spectra) with regions highlighting the Raman bands corresponding to phosphates (950 cm−1) and ACC (1080 cm-1) respectively, (c) False colored Raman images acquired from a control carapace sample (n = 1) indicating the differential intensity distribution of the Raman bands corresponding to phosphates (left) and ACC (right) respectively. Lower panel: (d) Bright-field microscopic image of the surface of the Triops-exposed carapace sample, (e) mean Raman spectrum ± 1 standard deviations (SD) of the respective carapace (calculated from n = 22,500 Raman spectra) with regions highlighting the Raman bands corresponding to phosphates (950 cm−1) and ACC (1080 cm−1), respectively, (f) false colored Raman images acquired from a Triops-exposed carapace sample (n = 1) indicating the differential intensity distribution of the Raman bands corresponding to phosphates (left) and ACC (right), respectively. CCD counts (CCD cts.) on the color scale represents relative intensity variation of Raman signatures corresponding to phosphates and ACC within the Raman image.
Figure 7
Figure 7
Arrangement of atoms in the amorphous phase vs crystalline phase of calcium carbonate (CaCO3); (a) crystalline calcium carbonate (calcite), (b) Amorphous monohydrated ACC; spheres colored in green represent calcium ions (Ca2+), grey represent carbon atoms (C), yellow represents hydrogen atoms (H) and red represents oxygen atoms (O) respectively.

Similar articles

Cited by

References

    1. Currey JD. The failure of exoskeletons and endoskeletons. J. Morphol. 1967;123:1–16. doi: 10.1002/jmor.1051230102. - DOI - PubMed
    1. Taylor D, Dirks J-H. Shape optimization in exoskeletons and endoskeletons: a biomechanics analysis. J. R. Soc. Interface. 2012;9:3480–3489. doi: 10.1098/rsif.2012.0567. - DOI - PMC - PubMed
    1. Boßelmann F, Romano P, Fabritius H, Raabe D, Epple M. The composition of the exoskeleton of two crustacea: The American lobster Homarusamericanus and the edible crab Cancerpagurus. Thermochim. Acta. 2007;463:65–68. doi: 10.1016/j.tca.2007.07.018. - DOI
    1. Tynyakov J, et al. A crayfish molar tooth protein with putative mineralized exoskeletal chitinous matrix properties. J. Exp. Biol. 2015;218:3487–3498. doi: 10.1242/jeb.123539. - DOI - PubMed
    1. Sugawara A, et al. Self-organization of oriented calcium carbonate/polymer composites: Effects of a matrix peptide isolated from the exoskeleton of a crayfish. Angew. Chemie - Int. Ed. 2006;45:2876–2879. doi: 10.1002/anie.200503800. - DOI - PubMed

Publication types