. 2020 Dec 29;10(1):22405.
doi: 10.1038/s41598-020-80141-3.

Cell fate clusters in ICM organoids arise from cell fate heredity and division: a modelling approach

Affiliations

Cell fate clusters in ICM organoids arise from cell fate heredity and division: a modelling approach

Tim Liebisch et al. Sci Rep. .

Abstract

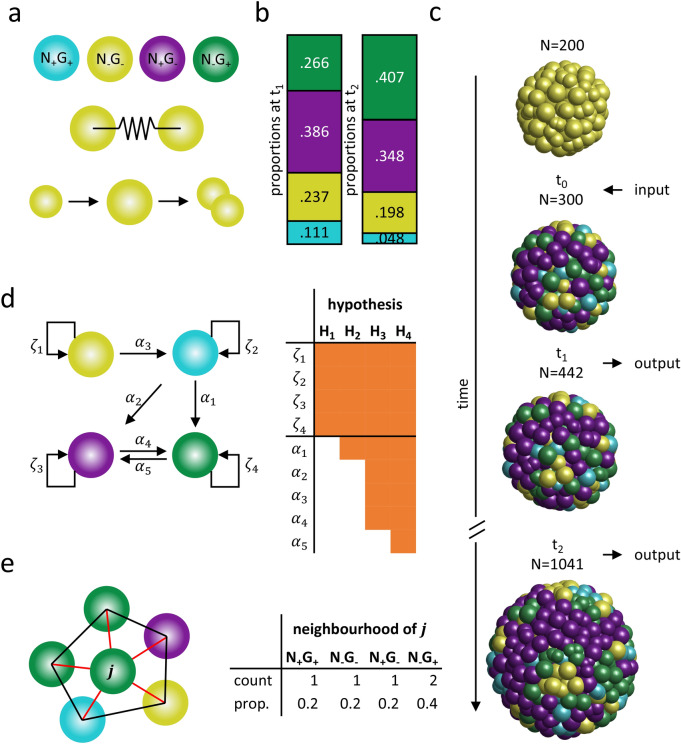
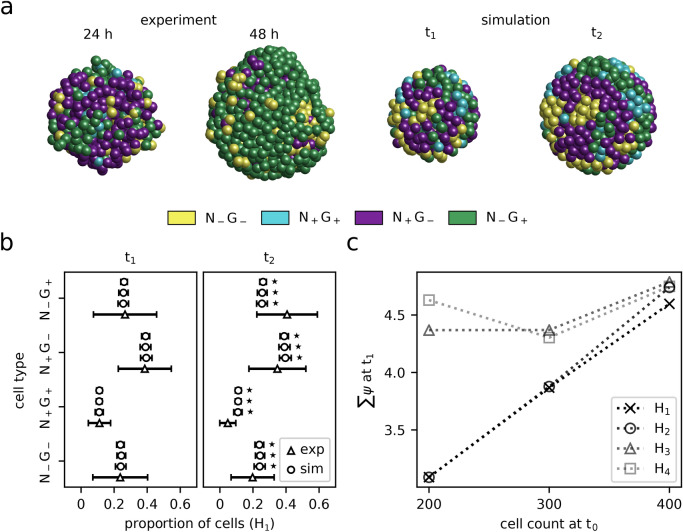
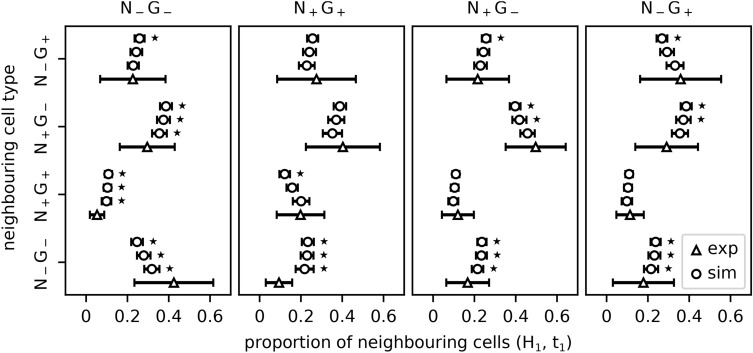
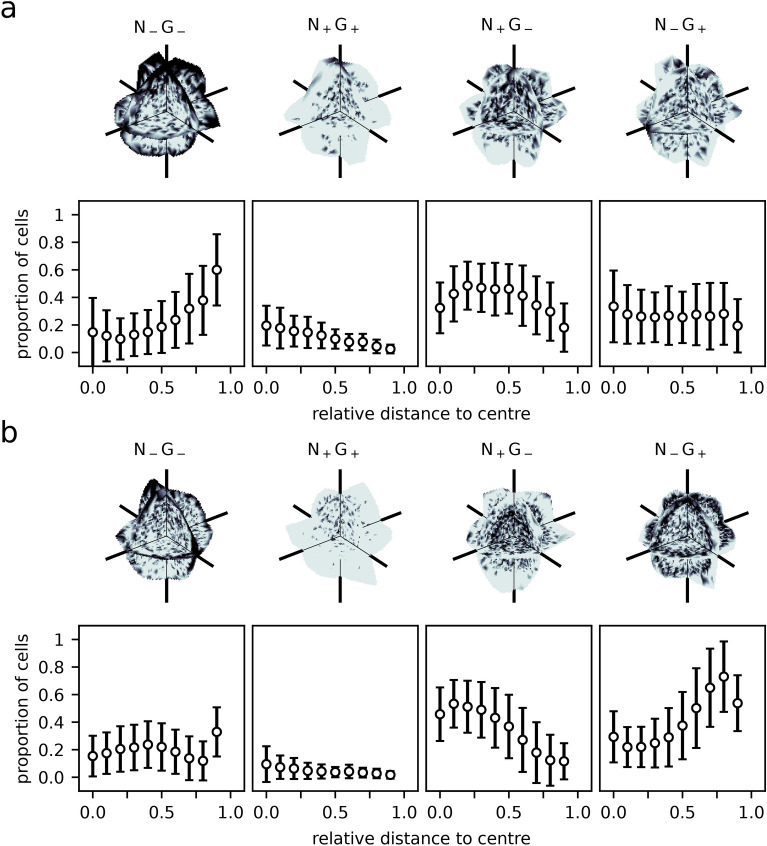
During the mammalian preimplantation phase, cells undergo two subsequent cell fate decisions. During the first decision, the trophectoderm and the inner cell mass are formed. Subsequently, the inner cell mass segregates into the epiblast and the primitive endoderm. Inner cell mass organoids represent an experimental model system, mimicking the second cell fate decision. It has been shown that cells of the same fate tend to cluster stronger than expected for random cell fate decisions. Three major processes are hypothesised to contribute to the cell fate arrangements: (1) chemical signalling; (2) cell sorting; and (3) cell proliferation. In order to quantify the influence of cell proliferation on the observed cell lineage type clustering, we developed an agent-based model accounting for mechanical cell-cell interaction, i.e. adhesion and repulsion, cell division, stochastic cell fate decision and cell fate heredity. The model supports the hypothesis that initial cell fate acquisition is a stochastically driven process, taking place in the early development of inner cell mass organoids. Further, we show that the observed neighbourhood structures can emerge solely due to cell fate heredity during cell division.


Conflict of interest statement

The authors declare no competing interests.

Figures

Figure 1
Figure 1
Outline of the mathematical model and the conducted analyses. (a) The model considers four different cell types (blue N+G+; yellow NG; purple N+G; green NG+). Neighbouring cells are connected via a force potential. Cells are growing over time and divide if they pass a given size. (b) The model utilises the proportions of cell types of 24 h old ICM organoids (left). The proportion of cell types of 48 h old ICM organoids (right). (c) The initial state of the model considers 200 undifferentiated cells. At a cell count of 200, 300 or 400 cells (t0) the cells are randomly assigned to a cell type (based on the proportions of cell types in 24 h old ICM organoids. When the simulation reaches a cell count of 442 cells (t1) and 1041 cells (t2) the positions and types of the cells are saved. (d) Throughout the simulations, the cells pass on their cell types during cell division according to different hypotheses (H1–H4). The hypotheses increase in complexity i.e. the number of parameters. Parameter values are presented in Supplementary Table A1. (e) From the simulated results the neighbourhood statistics for each cell type are determined. Cell neighbours are identified via Delaunay triangulation. Red lines indicate neighbours of cell j. Black lines indicate neighbours not involving cell j (left). The neighbourhood structure of cell j is quantified and expressed as proportions of neighbouring cell types. This is performed for all cells and averaged over the four cell types (right).
Figure 2
Figure 2
Expression type composition of ICM spheroids for H1. (a) ICM organoids (experimental data) for 24 h and 48 h and simulated ICM spheroids for t1 and t2. (b) Expression type composition of ICM organoids and ICM spheroids as percentage of the total number of cells within ICM organoids at t1 and t2. Simulations were performed under the assumption H1. Experimental data from Mathew et al. are indicated by triangles. Simulation results for different t0 are indicated by circles. The error bars indicate the standard deviation. t0 from lowest line to top: 200, 300 and 400 cells. Statistically significant differences between the cell fate proportion of ICM organoids and ICM spheroids are indicated by stars (p<0.05; using a Wilcoxon–Mann–Whitney test with Bonferroni correction). (c) The effect size (ψ) as the relative deviation of the simulated and experimental neighbourhood statistics at t1 for simulations performed under the assumptions H1, H2, H3 and H4.
Figure 3
Figure 3
Expression type composition of neighbouring cells as percentage of the total of neighbouring cells at t1. Simulations were performed under the assumption H1. Experimental data from Mathew et al. are indicated by triangles. Simulation results for different t0 are indicated by circles. The error bars indicate the standard deviation. t0 from lowest line to top: 200, 300 and 400 cells. Statistically significant differences between the neighbourhood structure of 24 h old ICM organoids and ICM spheroid patterns are indicated by stars (p<0.05; using a Wilcoxon–Mann–Whitney test with Bonferroni correction).
Figure 4
Figure 4
Expression type cluster analysis for ICM organoids. (a) 24 h old ICM organoids; (b) 48 h old ICM organoids. Black indicates the presence of an expression type, white indicates its absence, respectively. Shown are slices through the ICM organoids at cartesian origin. Expression type compositions in dependence of the relative distance to the ICM organoid centre. Cells are sorted according to their distance to the ICM organoid centre of mass and binned into 10 groups. Points indicate the average proportion of a cell fate type for the 10 bins, the bars denote the standard deviation.

Similar articles

Cited by

References

    1. Rivera-Pérez JA, Hadjantonakis A-K. The dynamics of morphogenesis in the early mouse embryo. Cold Spring Harb. Perspect. Biol. 2015;7:a015867. doi: 10.1101/cshperspect.a015867. - DOI - PMC - PubMed
    1. Downs KM, Davies T. Staging of gastrulating mouse embryos by morphological landmarks in the dissecting microscope. Development. 1993;118:1255–1266. - PubMed
    1. Wilcox AJ, et al. Incidence of early loss of pregnancy. N. Engl. J. Med. 1988;319:189–194. doi: 10.1056/NEJM198807283190401. - DOI - PubMed
    1. Tarkowski AK, Wróblewska J. Development of blastomeres of mouse eggs isolated at the 4-and 8-cell stage. Development. 1967;18:155–180. - PubMed
    1. Johnson, M. H. & McConnell, J. M. Lineage allocation and cell polarity during mouse embryogenesis. In Seminars in Cell & Developmental Biology, vol. 15, 583–597 (Elsevier, Amsterdam, 2004). - PubMed

Publication types