

Her2-Targeted Multifunctional Nano-Theranostic Platform Mediates Tumor Microenvironment Remodeling and Immune Activation for Breast Cancer Treatment
- PMID: 33376321
- PMCID: PMC7756023
- DOI: 10.2147/IJN.S271213
Her2-Targeted Multifunctional Nano-Theranostic Platform Mediates Tumor Microenvironment Remodeling and Immune Activation for Breast Cancer Treatment
Abstract
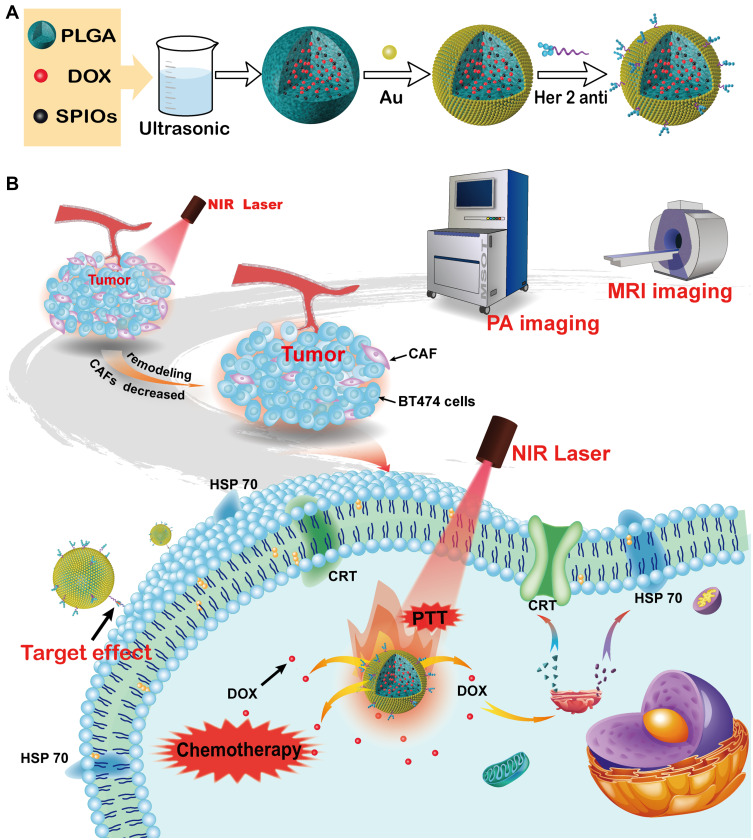
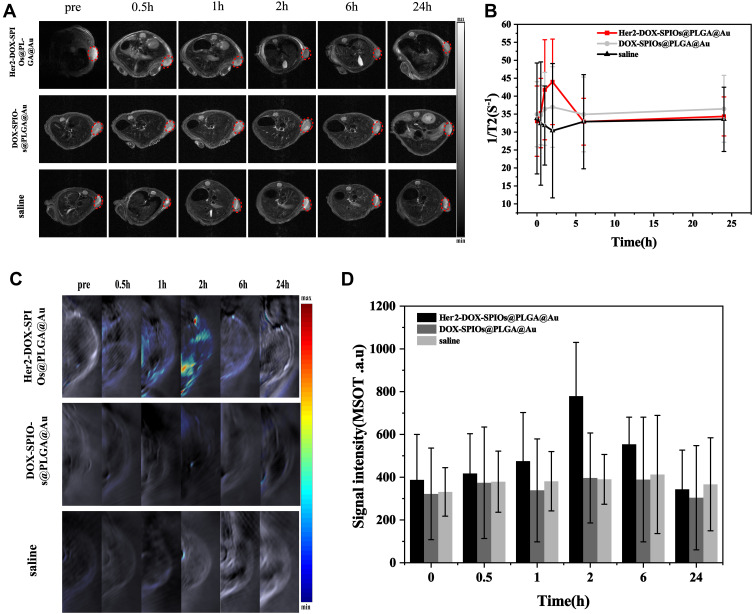
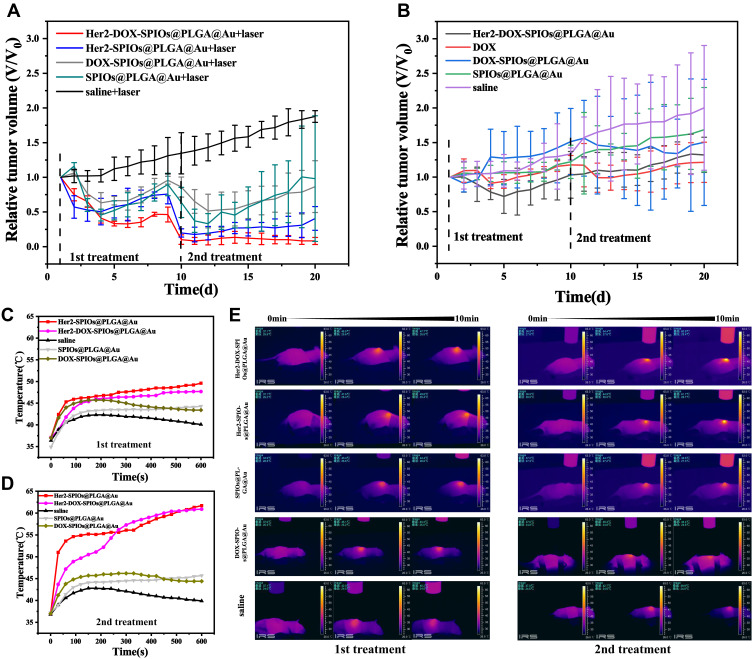
Purpose: The treatment of breast cancer is often ineffective due to the protection of the tumor microenvironment and the low immunogenicity of tumor cells, leading to a poor therapeutic effect. In this study, we designed a nano-theranostic platform for these obstacles: a photothermal effect mediated by a gold shell could remodel the tumor microenvironment by decreasing cancer-associated fibroblasts (CAFs) and promote the release of doxorubicin (DOX) from nanoparticles. In addition, it could realize photoacoustic (PA)/MRI dual-model imaging for diagnose breast cancer and targeted identification of Her2-positive breast cancer.
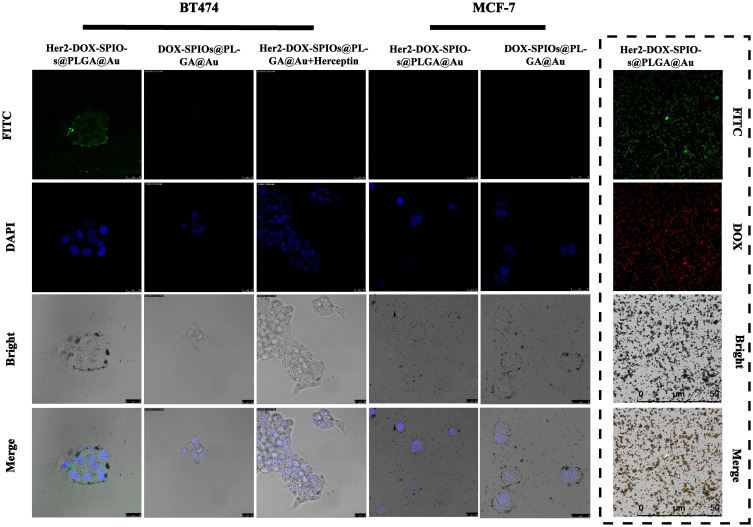
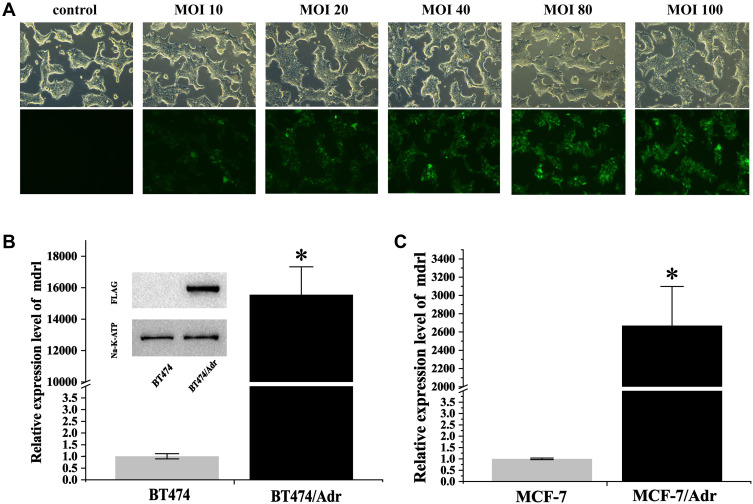
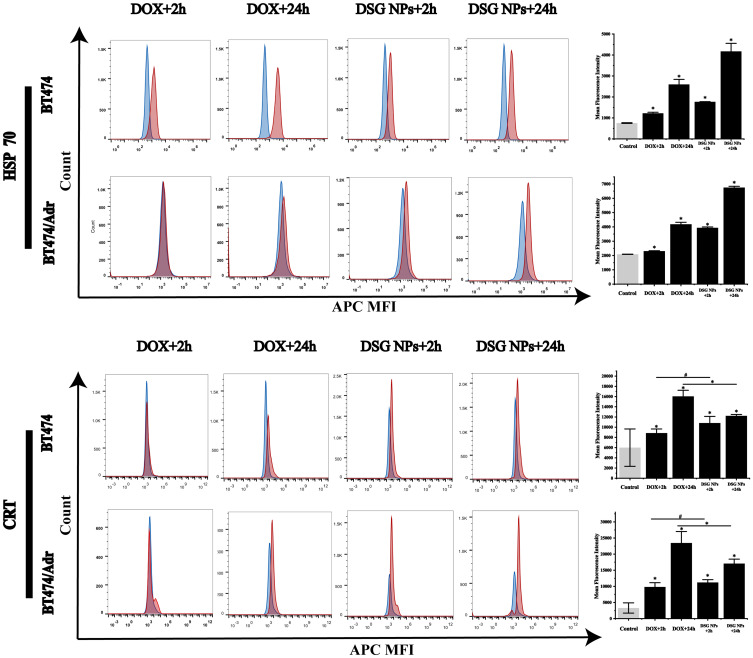
Methods: Her2-DOX-superparamagnetic iron oxide nanoparticles (SPIOs)@Poly (D, L-lactide-co-glycolide) acid (PLGA)@Au nanoparticles (Her2-DSG NPs) were prepared based on a single emulsion oil-in-water (O/W) solvent evaporation method, gold seed growing method, and carbon diimide method. The size distribution, morphology, PA/MRI imaging, drug loading capacity, and drug release were investigated. Cytotoxicity, antitumor effect, cellular uptake, immunogenic cell death (ICD) effect, and targeted performance on human Her2-positive BT474 cell line were investigated in vitro. BT474/Adr cells were constructed and the antitumor effect of NPs on it was evaluated in vitro. Moreover, chemical-photothermal therapy effect, PA/MRI dual-model imaging, ICD effect induced by NPs, and tumor microenvironment remodeling in human BT474 breast cancer nude mice model were also investigated.
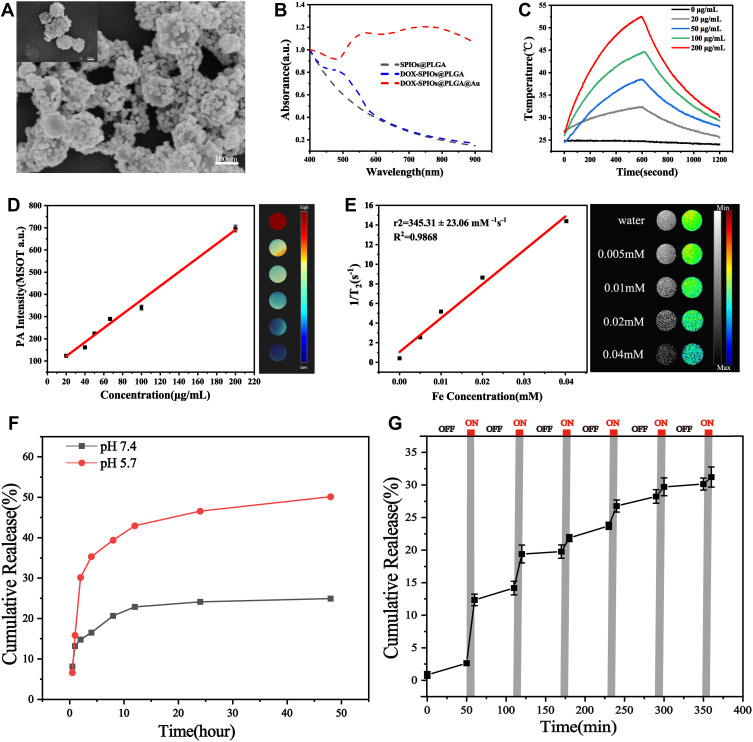
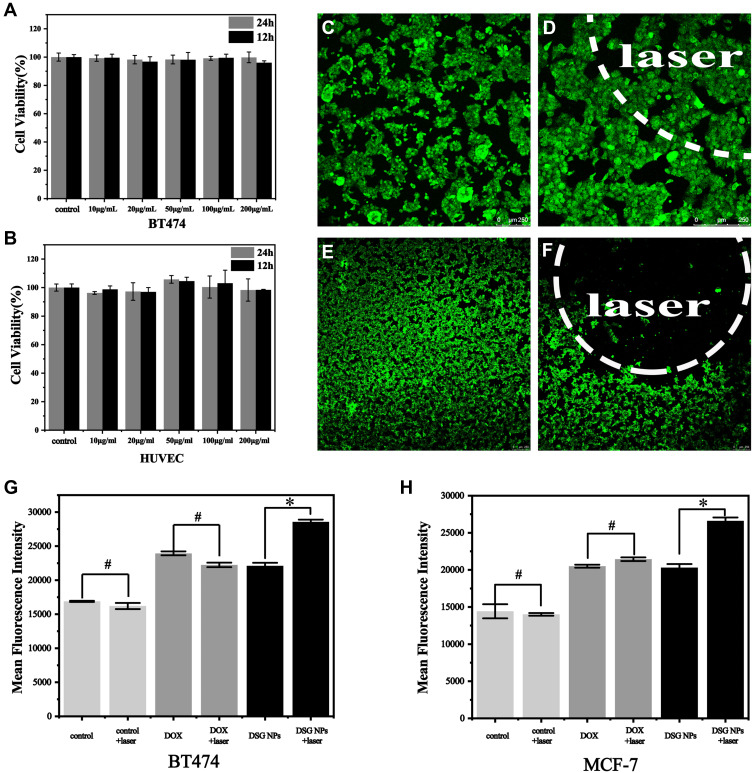
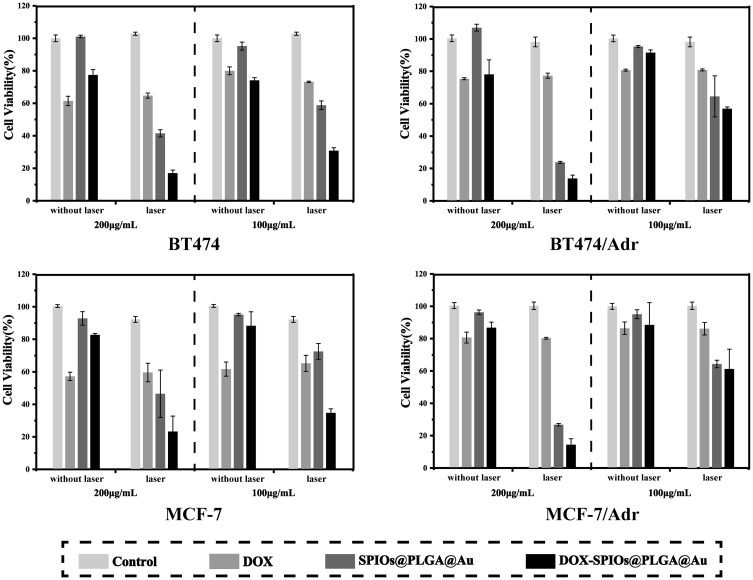
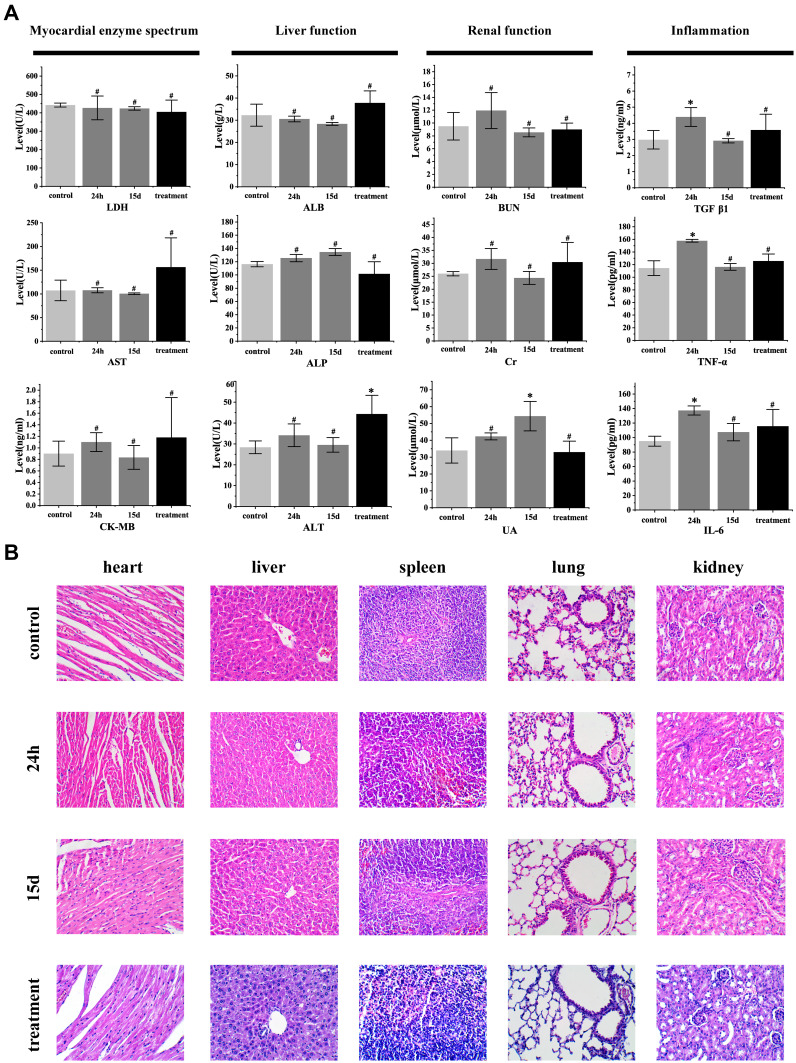
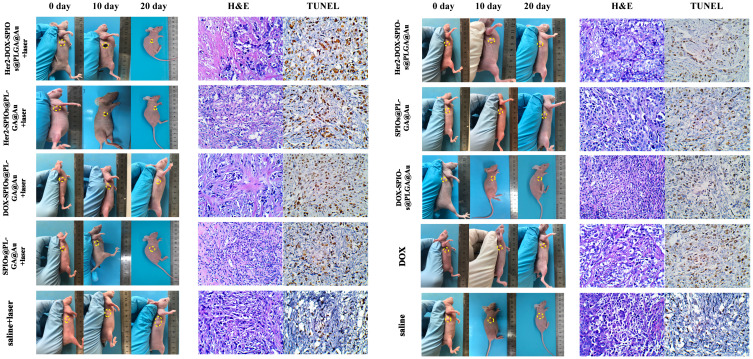
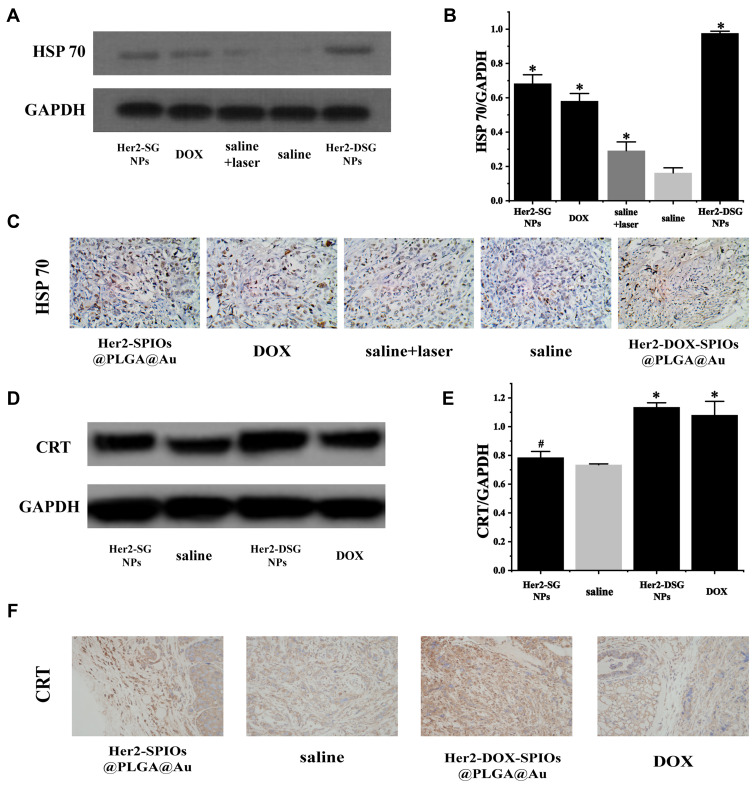
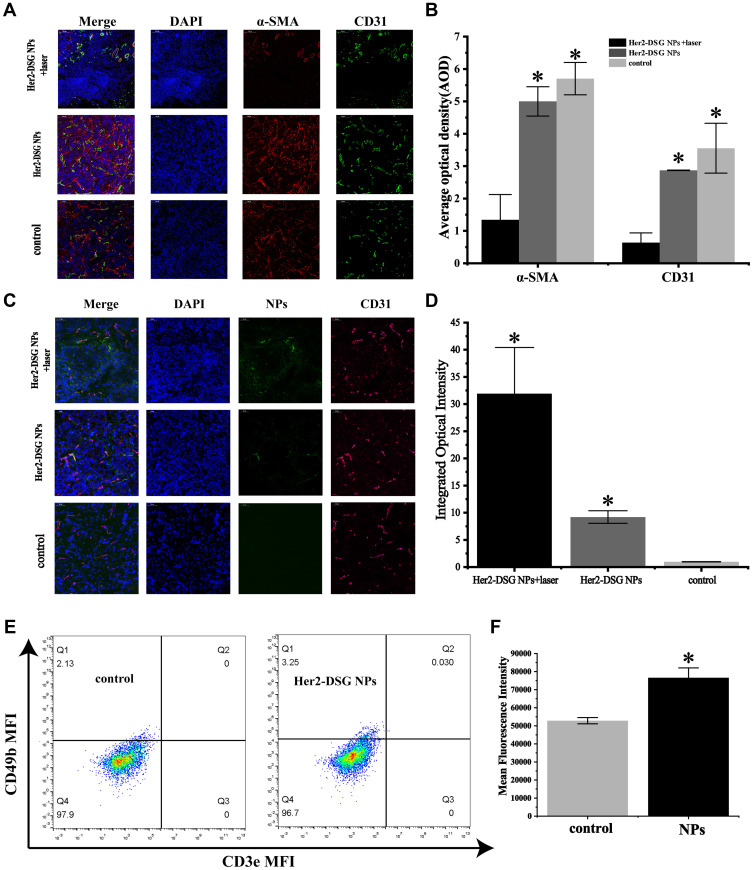
Results: Nanoparticles were spherical, uniform in size and covered with a gold shell. NPs had a photothermal effect, and can realize photothermal-controlled drug release in vitro. Chemical-photothermal therapy had a good antitumor effect on BT474/Adr cells and on BT474 cells in vitro. The targeting evaluation in vitro showed that Her2-DSG NPs could actively target and identify Her2-positive tumor cells. The PA/MRI imaging was successfully validated in vitro/vivo. Similarly, NPs could enhance the ICD effect in vitro/vivo, which could activate an immune response. Immunofluorescence results also proved that photothermal effect could decrease CAFs to remodel the tumor microenvironment and enhance the accessibility of NPs to tumor cells. According to the toxicity results, targeted drug delivery combined with photothermal-responsive drug release proved that NPs had good biosafety in vivo. Chemical-photothermal therapy of Her2-targeted NPs has a good antitumor effect in the BT474 nude mice model.
Conclusion: Our study showed that chemical-photothermal therapy combined with tumor microenvironment remodeling and immune activation based on the Her2-DSG NPs we developed are very promising for Her2-positive breast cancer.
Keywords: chemoimmunotherapy; dual-modal imaging; photothermal effect; targeted nano-theranostic platform; tumor microenvironment remodeling.
© 2020 Zheng et al.
Conflict of interest statement
The authors report no conflicts of interest for this work.
Figures
Similar articles
-
A light-controllable specific drug delivery nanoplatform for targeted bimodal imaging-guided photothermal/chemo synergistic cancer therapy.Acta Biomater. 2018 Oct 15;80:308-326. doi: 10.1016/j.actbio.2018.09.024. Epub 2018 Sep 19. Acta Biomater. 2018. PMID: 30240955
-
Targeted gold nanoshelled hybrid nanocapsules encapsulating doxorubicin for bimodal imaging and near-infrared triggered synergistic therapy of Her2-positve breast cancer.J Biomater Appl. 2020 Sep;35(3):430-445. doi: 10.1177/0885328220929616. Epub 2020 Jun 9. J Biomater Appl. 2020. PMID: 32515640
-
Tumor microenvironment-responsive versatile "Trojan horse" theranostic nanoplatform for magnetic resonance imaging-guided multimodal synergistic antitumor treatment.Acta Biomater. 2022 Jul 15;147:270-286. doi: 10.1016/j.actbio.2022.05.024. Epub 2022 May 17. Acta Biomater. 2022. PMID: 35595202
-
Theranostic Nanoparticles for RNA-Based Cancer Treatment.Acc Chem Res. 2019 Jun 18;52(6):1496-1506. doi: 10.1021/acs.accounts.9b00101. Epub 2019 May 28. Acc Chem Res. 2019. PMID: 31135134 Free PMC article. Review.
-
Challenges and prospects in HER2-positive breast cancer-targeted therapy.Crit Rev Oncol Hematol. 2025 Mar;207:104624. doi: 10.1016/j.critrevonc.2025.104624. Epub 2025 Jan 16. Crit Rev Oncol Hematol. 2025. PMID: 39826885 Review.
Cited by
-
The Application of Nanoparticles Targeting Cancer-Associated Fibroblasts.Int J Nanomedicine. 2024 Apr 8;19:3333-3365. doi: 10.2147/IJN.S447350. eCollection 2024. Int J Nanomedicine. 2024. PMID: 38617796 Free PMC article. Review.
-
Metal-Polymer Nanoconjugates Application in Cancer Imaging and Therapy.Nanomaterials (Basel). 2022 Sep 13;12(18):3166. doi: 10.3390/nano12183166. Nanomaterials (Basel). 2022. PMID: 36144953 Free PMC article. Review.
-
Nanomaterials: leading immunogenic cell death-based cancer therapies.Front Immunol. 2024 Aug 9;15:1447817. doi: 10.3389/fimmu.2024.1447817. eCollection 2024. Front Immunol. 2024. PMID: 39185425 Free PMC article. Review.
-
Photoacoustic and magnetic resonance imaging-based gene and photothermal therapy using mesoporous nanoagents.Bioact Mater. 2021 Jul 28;9:157-167. doi: 10.1016/j.bioactmat.2021.07.025. eCollection 2022 Mar. Bioact Mater. 2021. PMID: 34820563 Free PMC article.
-
Current Status and Future Directions of Ferroptosis Research in Breast Cancer: Bibliometric Analysis.Interact J Med Res. 2025 Feb 26;14:e66286. doi: 10.2196/66286. Interact J Med Res. 2025. PMID: 40009842 Free PMC article.
References
-
- Gianni L, Pienkowski T, Im Y-H, et al. Efficacy and safety of neoadjuvant pertuzumab and trastuzumab in women with locally advanced, inflammatory, or early HER2-positive breast cancer (NeoSphere): a randomised multicentre, open-label, Phase 2 trial. Lancet Oncol. 2012;13(1):25–32. doi:10.1016/S1470-2045(11)70336-9 - DOI - PubMed
-
- Anna BWSR, Nowak K, Richard A. Lak, Synergy between Chemotherapy and Immunotherapy in the Treatment of Established Murine Solid Tumors. Cancer Res. 2003;63(15):4490. - PubMed
-
- Robert D. Schreiber, Cancer Immunoediting: integrating Immunity’s Roles in Cancer Suppression and Promot. Science. 2011;331(6024):1565–1570. - PubMed
MeSH terms
Substances
LinkOut - more resources
Full Text Sources
Medical
Research Materials
Miscellaneous
