. 2020 Dec 22:12:13051-13069.
doi: 10.2147/CMAR.S277261. eCollection 2020.

BGN and COL11A1 Regulatory Network Analysis in Colorectal Cancer (CRC) Reveals That BGN Influences CRC Cell Biological Functions and Interacts with miR-6828-5p

Affiliations

BGN and COL11A1 Regulatory Network Analysis in Colorectal Cancer (CRC) Reveals That BGN Influences CRC Cell Biological Functions and Interacts with miR-6828-5p

Danqi Chen et al. Cancer Manag Res. .

Abstract

Purpose: We explored specific expression profiles of BGN and COL11A1 genes and studied their biological functions in CRC using bioinformatics tools.

Patients and methods: A total of 68 pairs of cancer and non-cancerous tissues from CRC patients were enrolled in this study. Methods we used in this articles including: qRT-PCR, Western blot analysis, ELISA, GO and KEGG regulatory network analysis, tumor infiltration, luciferase reporter-based protein and etc.

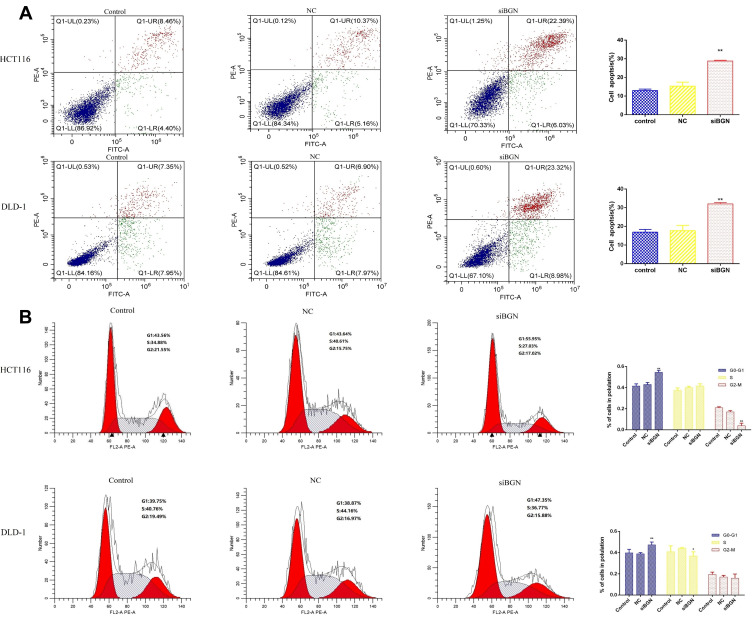
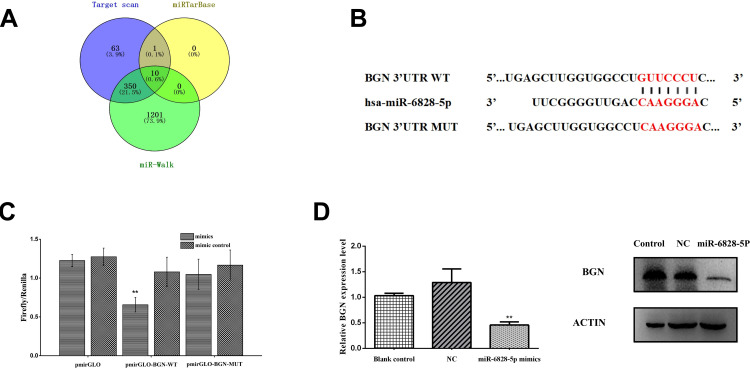
Results: According to The Cancer Genome Atlas (TCGA) data, BGN and COL11A1 expression levels were significantly higher in CRC patient samples than in samples from healthy controls. Moreover, levels were much higher in late-stage CRC than in early-stage disease, warranting evaluation of these genes as CRC prognostic biomarkers. Subsequently, qRT-PCR, Western blot analysis, and ELISA results obtained from analyses of CRC cells, tissues, and patient sera aligned with TCGA results. GO and KEGG regulatory network analysis revealed BGN- and COL11A1-associated genes that were functionally related to extracellular matrix (ECM) receptor pathway activation, with transcription factor genes RELA and NFKB1 positively associated with BGN expression and CEBPZ and SIRT1 with COL11A1 expression. Meanwhile, BGN and COL11A1 expression were separately and significantly correlated to tumor infiltration by six immune cell types. Additionally, kinase genes PLK1 and LYN appeared to be downstream targets of differentially expressed BGN and COL11A1, respectively. In addition, the expression of PLK1 mRNA was down-regulated while BGN was down-regulated. Finally, BGN effects on CRC cell proliferation, cycle, apoptosis, invasion, and migration were studied using molecular biological methods, including luciferase reporter-based protein analysis, qRT-PCR, and Western blot results, which revealed that miR-6828-5p may regulate BGN expression.

Conclusion: We speculate that the use of BGN and COL11A1 as CRC biomarkers would improve CRC staging, while also providing several novel targets for use in the development of more effective CRC treatments.

Keywords: BGN; COL11A1; PLK-1; colorectal cancer; miR-6828-5p.


Conflict of interest statement

The authors report no conflicts of interest in this work.

Figures

Figure 1
Figure 1
Identification of overlapping DEGs, DEGs function enrichment analysis and survival value of CRC-specific markers. (A) Volcano plots of DEGs in GSE33113 dataset, GSE37892 dataset and GSE32323 dataset. (B) Venn plots of down-regulated overlapping DEGs and upregulated overlapping DEGs. (C) Histogram of enriched terms across input gene lists. (D) Pie chart of enriched terms. (E) PPI network of DEGs were construct and visualize by Cytoscape software. (F) The survival value of CRC-specific markers was analyzed by clinical parameters and survival data of 286 patients from TCGA data. Survival curve and calculate the Log-rank p-value were made by R language package “survival”, BGN and COL11A1 expression was correlated with survival.
Figure 2
Figure 2
BGN and COL11A1 expression in TCGA samples, tissue samples and serum. (A) Clinical tissue quantitative real-time PCR results. (B) TGCA database analysis results. (C) Serum samples verify results. (D) The expression of BGN and COL11A1 in HCT116 and DLD-1 cells was tested by qRT-PCR. Data are presented as means ±S.D. of three independent experiments. *p < 0.05, **p < 0.01 compared with control.
Figure 3
Figure 3
The genes correlated with BGN and COL11A1 in CRC by LinkedOmics, GO term and KEGG analysis by GSEA were conducted to clarify the biological function of BGN and COL11A1 correlated genes. The volcano plot showing the genes correlated with BGN (A) and COL11A1 (D) in CRC. The heatmap showing the top 50 genes positively (B) or negatively (C) correlated with BGN. The heatmap showing the top 50 genes positively (E) or negatively (F) correlated with COL11A1. Gene expression correlation analysis for BGN, AEBP1, MXRA8, COL1A1 and CCDC8 (G). Gene expression correlation analysis for COL11A1, THBS2, COL1A2, COL10A1 and NTM (H). GO term and KEGG analysis by GSEA were conducted to clarify the biological function of BGN (I) and COL11A1 (J) correlated genes. The column represents the Normalized Enrichment Score (NES), and the color of the column represents the FDR.
Figure 4
Figure 4
Protein-protein interaction (PPI) network and functional analysis indicating the gene set that was enriched in the target network of kinases by GeneMANIA. Protein-protein interaction network of kinase_PLK1-target (A) and kinase_LYN-target (B) networks. The different colors for the network nodes indicate the biological functions of the set of enrichment genes. (C). The expression of PLK1 was significantly down-regulated in HCT116 and DLD-1 cells transfected with siBGN compared with cells transfected with control.**p < 0.01 compared with NC.
Figure 5
Figure 5
The expression of BGN and COL11A1 in cells and the effect of BGN knock-down on CRC cell proliferation. (A) The expression of BGN protein was tested by Western blot analysis. (B) The expression of BGN in cells was tested by Western blot analysis. (C and E) The expression of BGN was significantly down-regulated in HCT116 and DLD-1 cells transfected with siBGN2 compared with cells transfected with NC. (D and F) Cell viability of HCT116 and DLD-1 cells was measured by CCK-8 assay. (G) The colony formation assay and statistical results in HCT116 and DLD-1. Data are represent as the mean ± SD, The significance between control and NC group and between NC and siBGN group were shown. *p < 0.05,**p < 0.01.
Figure 6
Figure 6
The effect of BGN down-regulation on CRC cell apoptosis and cell cycle. (A) Apoptosis cell proportion of HCT116 and DLD-1 cells was detected by flow cytometry. (B) Cell cycle of HCT116 and DLD-1 cells was also measured by flow cytometry. Data are represent as the mean ± SD, *p < 0.05, **p < 0.01 compared to NC group.
Figure 7
Figure 7
The effect of BGN down-regulation on cell invasion, migration. (A) Cell invasion of HCT116 and DLD-1 cells. (B) Cell migration of HCT116 and DLD-1 cells. Data are represent as the mean ± SD, **p < 0.01 compared to NC group.
Figure 8
Figure 8
The correlation between BGN (A) and COL11A1 (B) and immune cell infiltration by TIMER.
Figure 9
Figure 9
miR-6828-5p regulated the expression of BGN. (A) Venn diagrams of miRNAs regulating BGN found in three databases. (B) The binding or mutation (red) sites of BGN with miR-6828-5p. (C) HCT116 cells were transfected with control miR-6828-5p mimics, pmirGLO-BGN-3ʹUTR and pmirGLOBGN-3ʹUTR mut for 24 h. Luciferase activity was measured. (D) HCT116 cells were transfected with control and miR-6828-5p mimic for 24 h, the mRNA or protein expression of BGN was measured. Data are represent as the mean ± SD, **p < 0.01 compared to NC group.

References

    1. Yueh TC, Wu CN, Hung YW, et al. The contribution of mmp-7 genotypes to colorectal cancer susceptibility in Taiwan. Cancer Genomics Proteomics. 2018;15(3):207–212. doi:10.21873/cgp.20099 - DOI - PMC - PubMed
    1. Siegel RL, Miller KD, Jemal A. Cancer statistics, 2018. CA Cancer J Clin. 2018;68(1):7–30. - PubMed
    1. Yan Y, Liu H, Mao K, et al. Novel nomograms to predict lymph node metastasis and liver metastasis in patients with early colon carcinoma. J Transl Med. 2019;17(1):193. doi:10.1186/s12967-019-1940-1 - DOI - PMC - PubMed
    1. Liu C, Jiang J, Gu J, Yu Z, Wang T, Lu H. High-dimensional omics data analysis using a variable screening protocol with prior knowledge integration (SKI). BMC Syst Biol. 2016;10(Suppl 4):118. doi:10.1186/s12918-016-0358-0 - DOI - PMC - PubMed
    1. Liang J, Wu X, Sun S, et al. Circular RNA expression profile analysis of severe acne by RNA-Seq and bioinformatics. J Eur Acad Dermatol Venereol. 2018;32(11):1986–1992. doi:10.1111/jdv.14948 - DOI - PubMed