

On the Heterogeneity of Existing Repositories of Movements Intended for the Evaluation of Fall Detection Systems
- PMID: 33376585
- PMCID: PMC7738812
- DOI: 10.1155/2020/6622285
On the Heterogeneity of Existing Repositories of Movements Intended for the Evaluation of Fall Detection Systems
Abstract
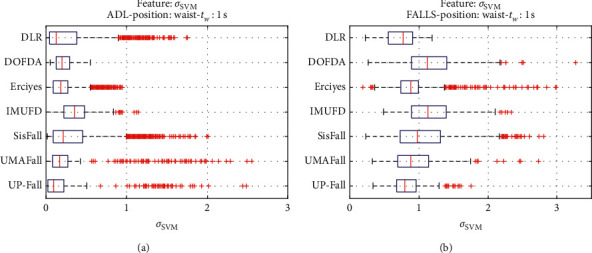
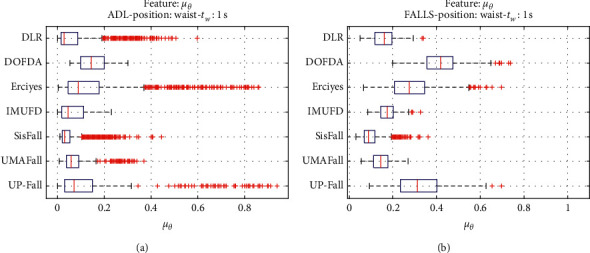
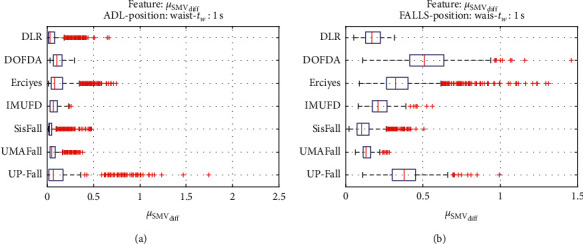
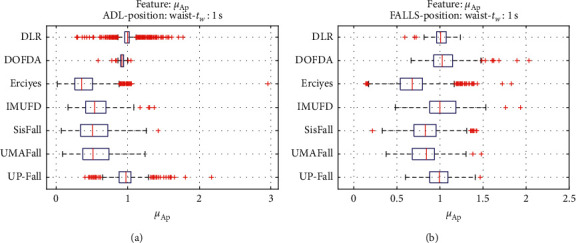
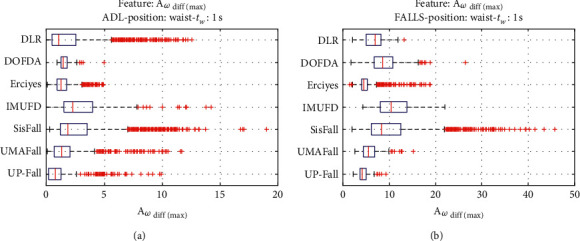
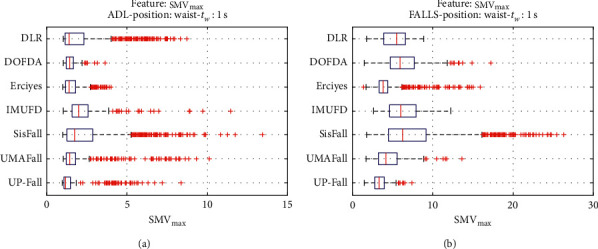
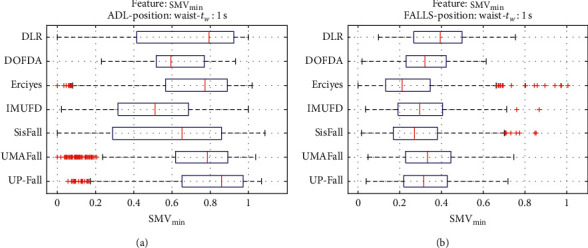
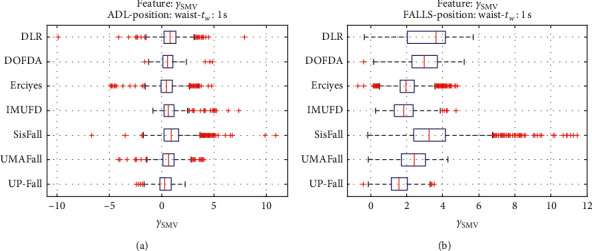
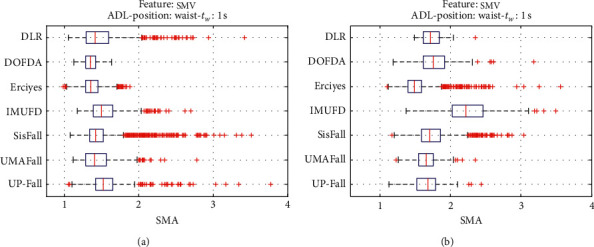
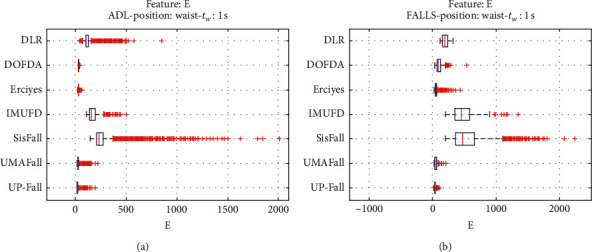
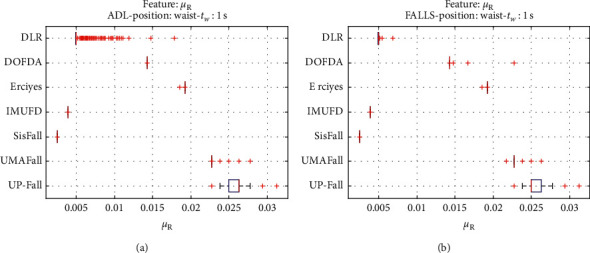
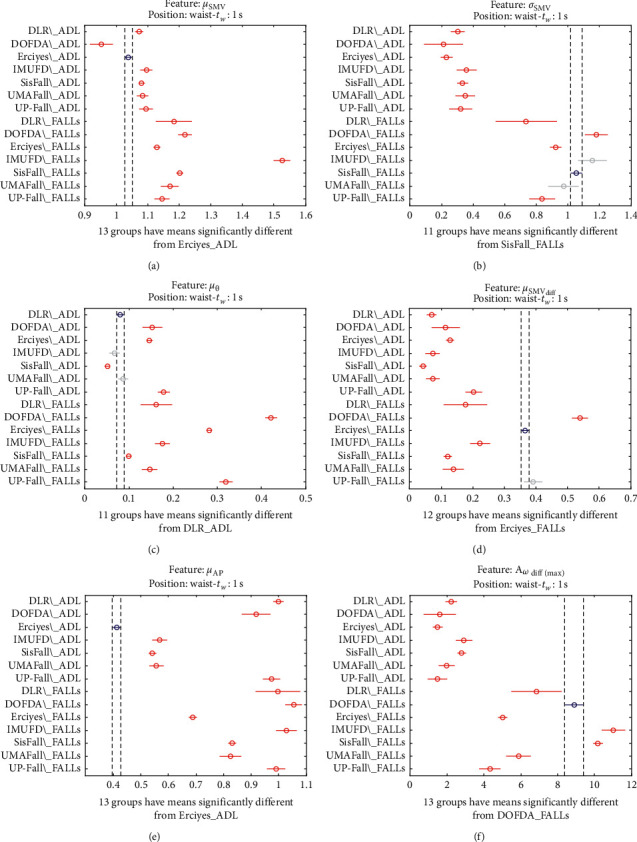
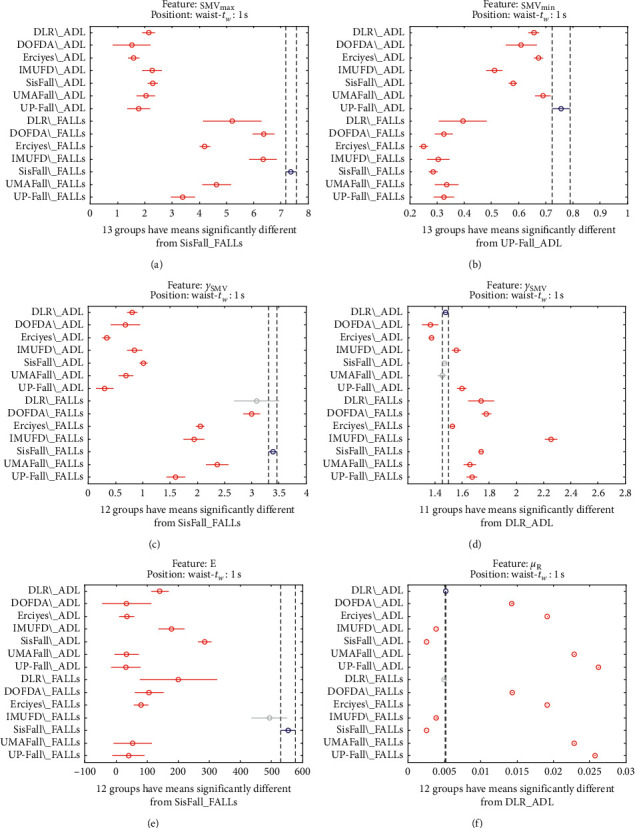
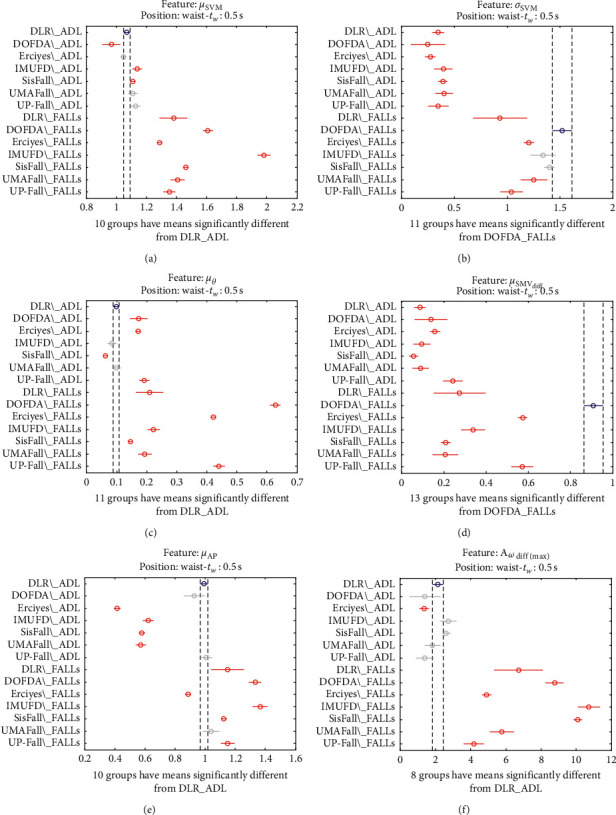
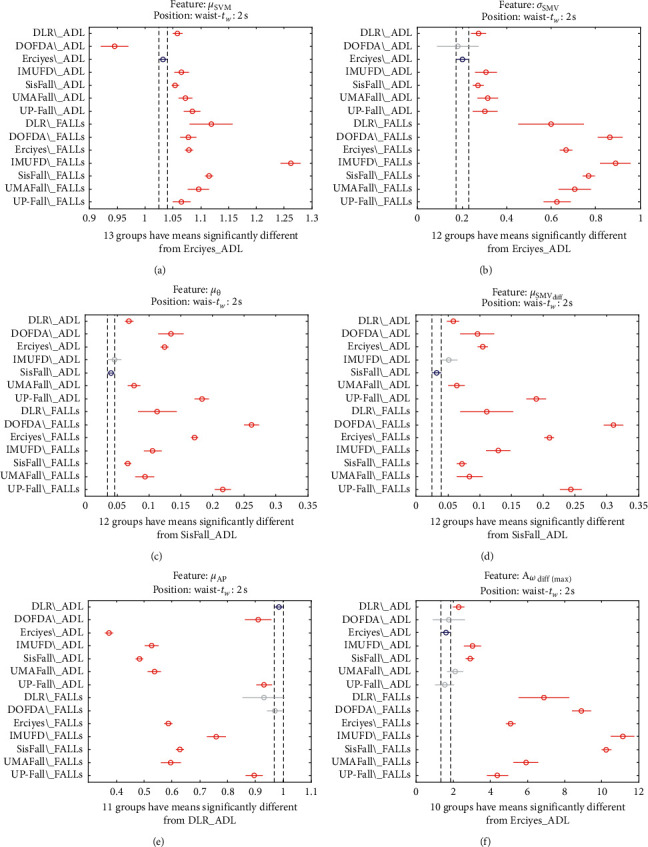
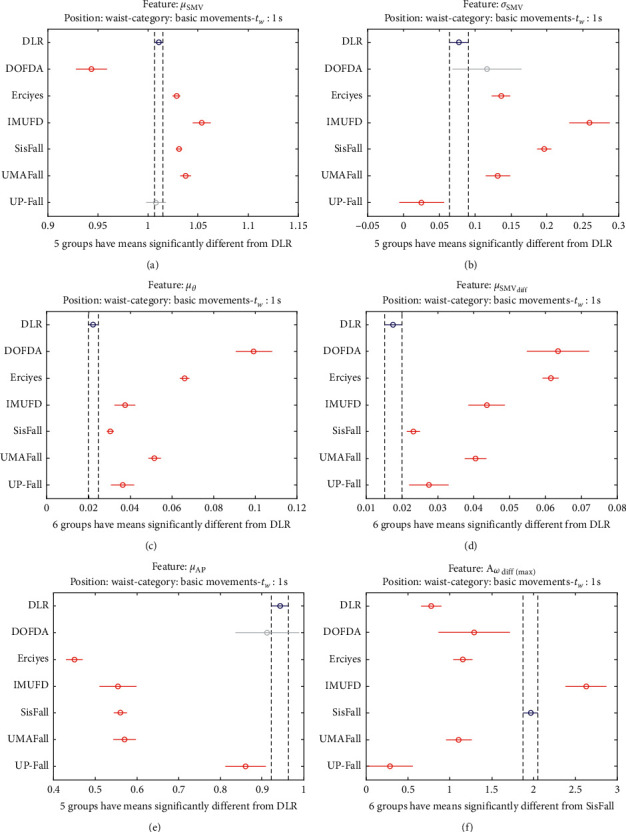
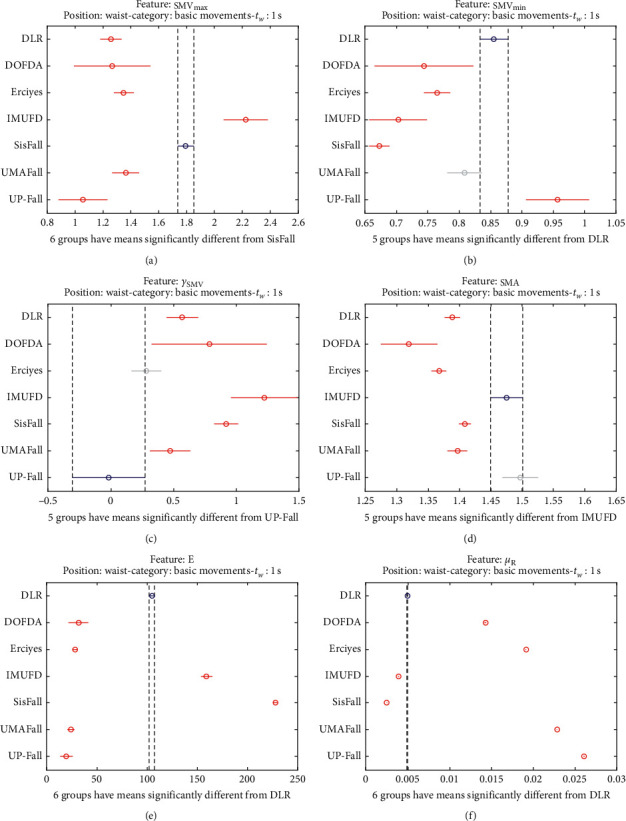
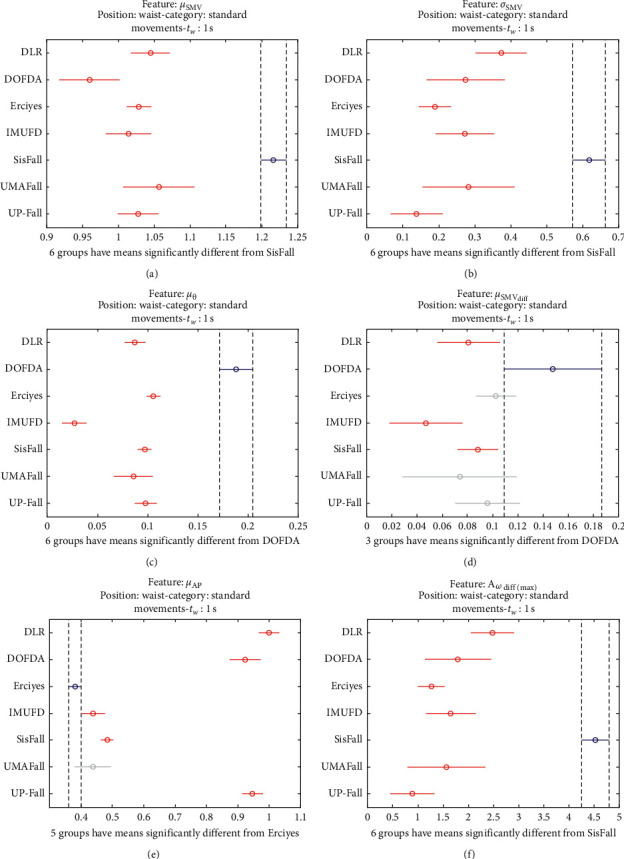
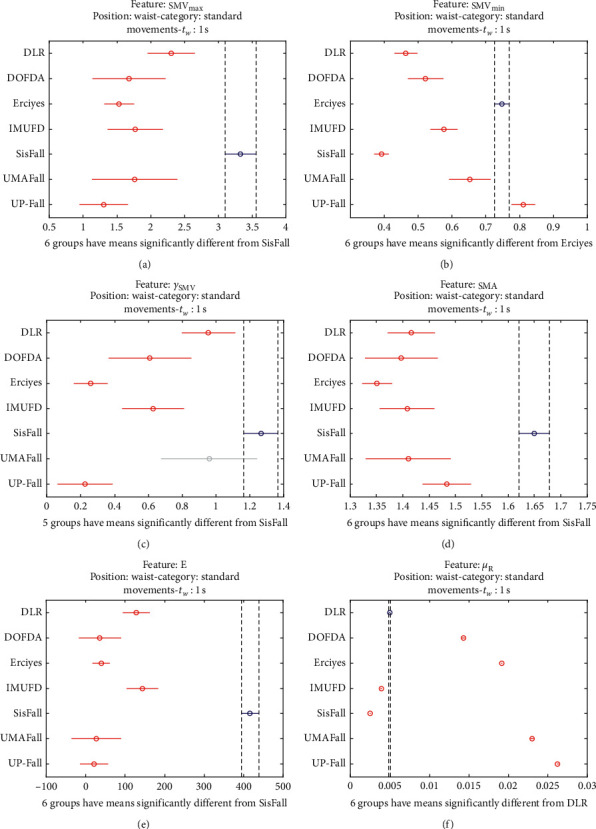
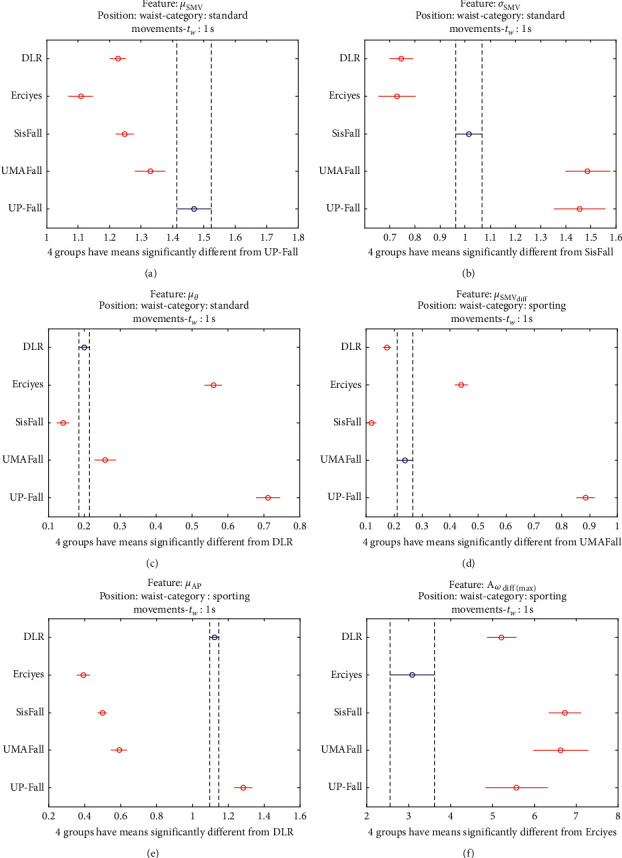
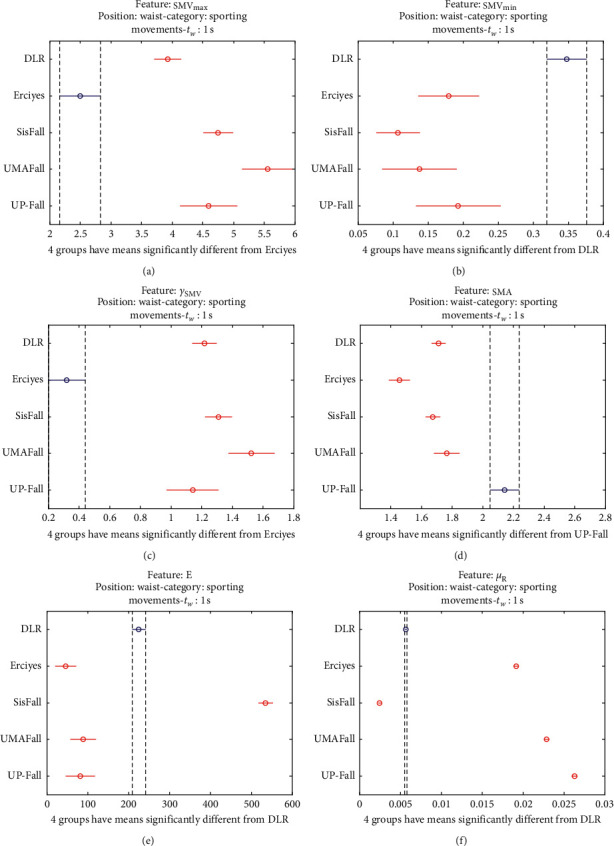
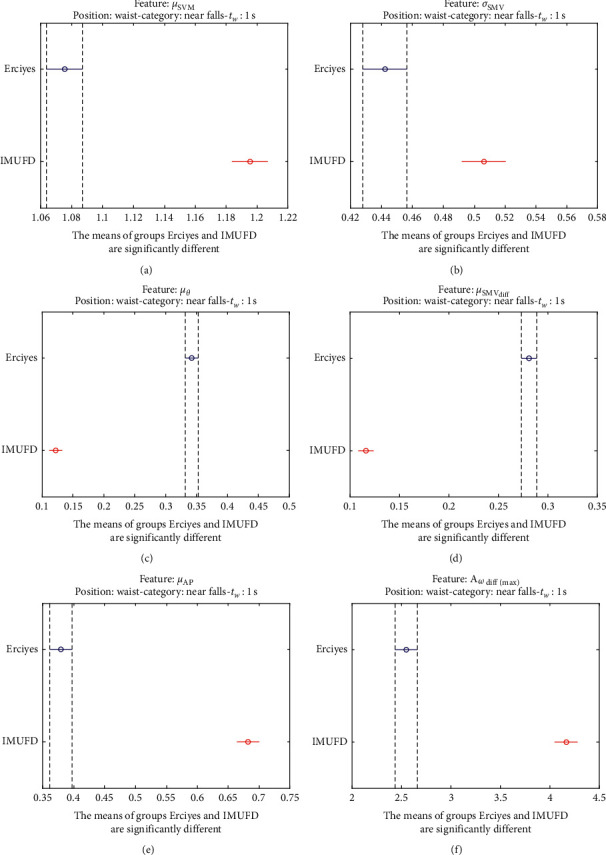
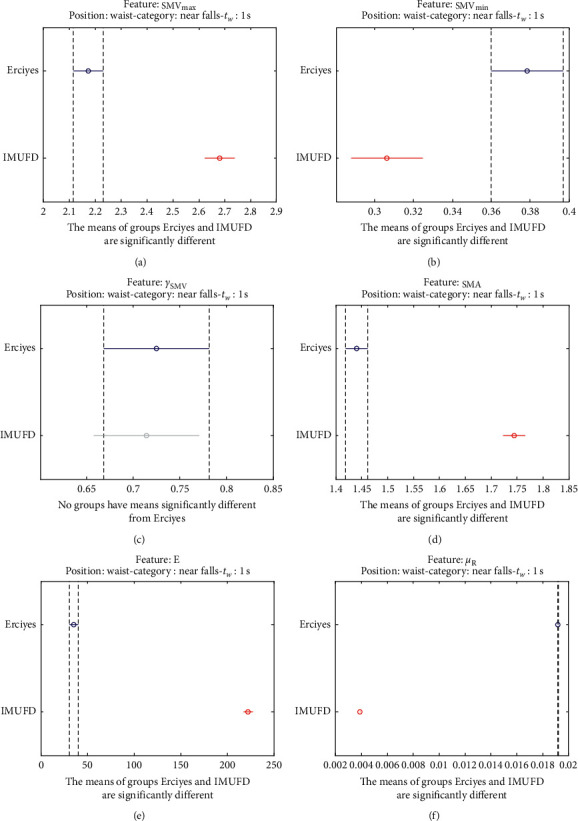
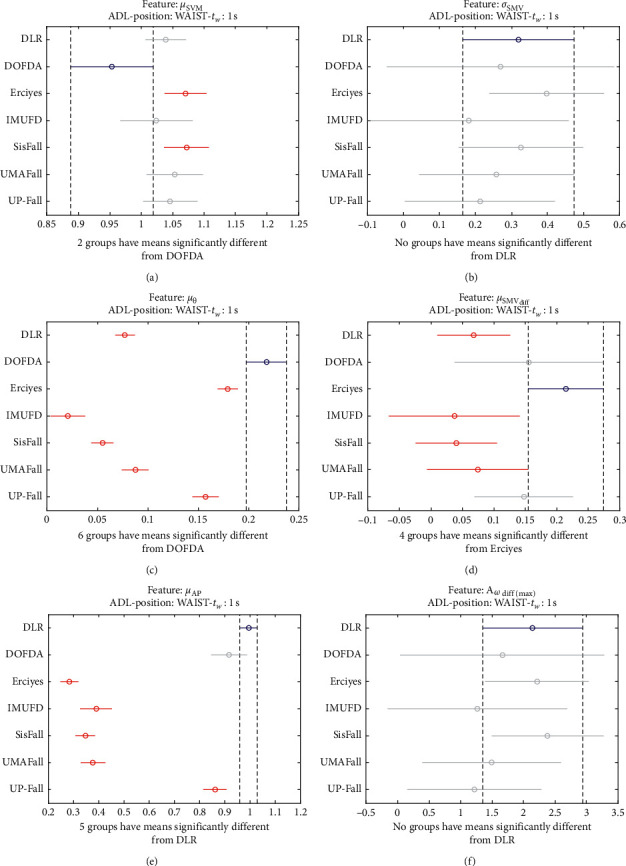
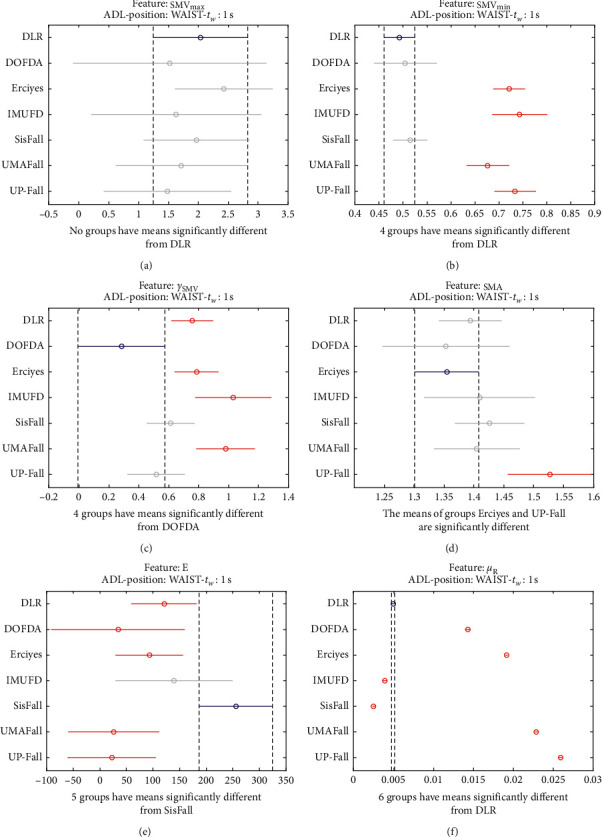
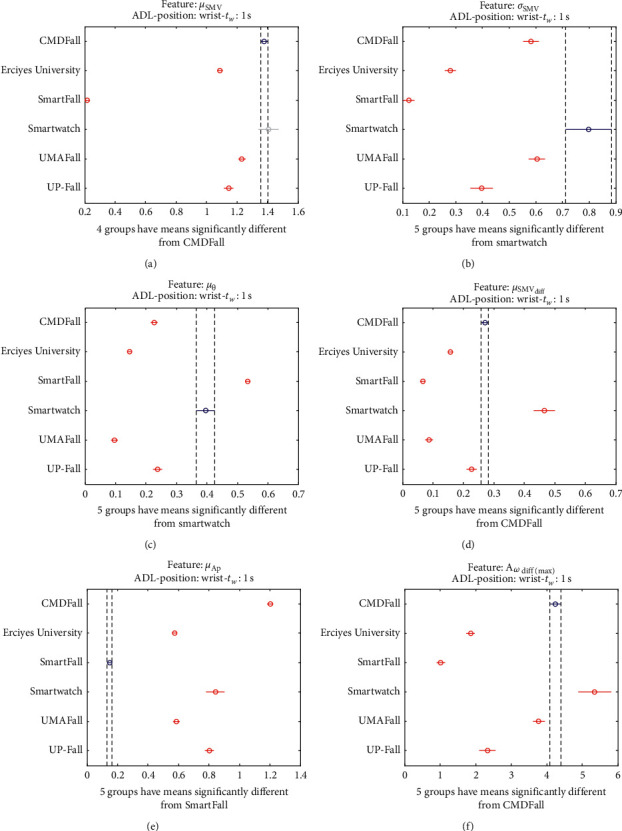
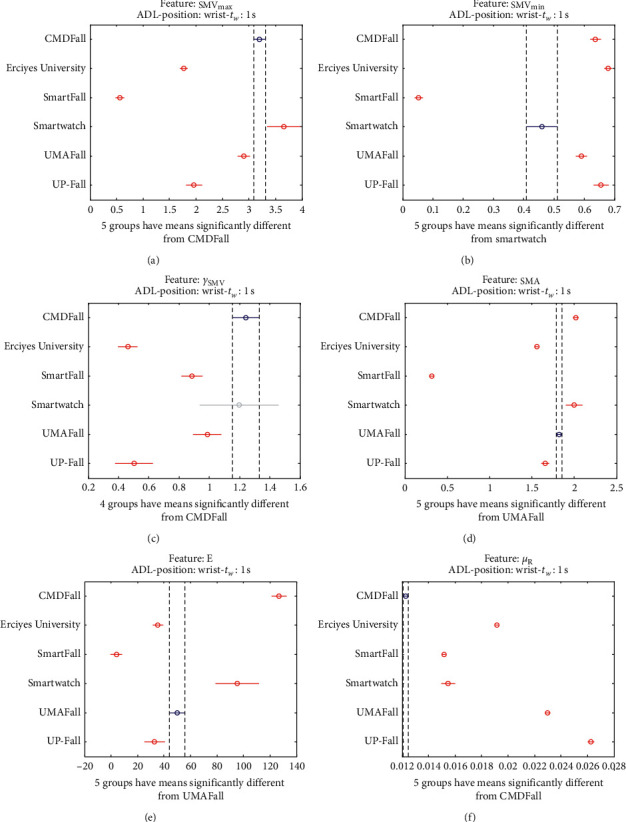
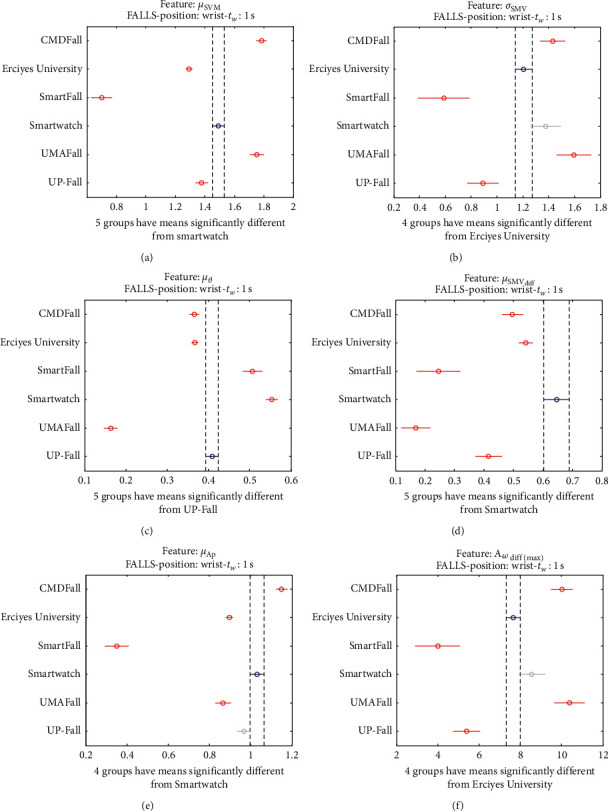
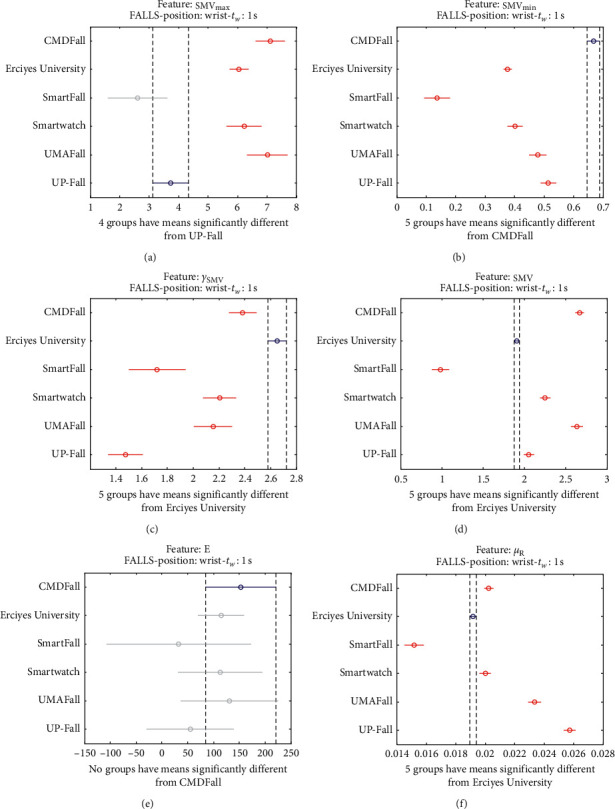
Due to the serious impact of falls on the autonomy and health of older people, the investigation of wearable alerting systems for the automatic detection of falls has gained considerable scientific interest in the field of body telemonitoring with wireless sensors. Because of the difficulties of systematically validating these systems in a real application scenario, Fall Detection Systems (FDSs) are typically evaluated by studying their response to datasets containing inertial sensor measurements captured during the execution of labelled nonfall and fall movements. In this context, during the last decade, numerous publicly accessible databases have been released aiming at offering a common benchmarking tool for the validation of the new proposals on FDSs. This work offers a comparative and updated analysis of these existing repositories. For this purpose, the samples contained in the datasets are characterized by different statistics that model diverse aspects of the mobility of the human body in the time interval where the greatest change in the acceleration module is identified. By using one-way analysis of variance (ANOVA) on the series of these features, the comparison shows the significant differences detected between the datasets, even when comparing activities that require a similar degree of physical effort. This heterogeneity, which may result from the great variability of the sensors, experimental users, and testbeds employed to generate the datasets, is relevant because it casts doubt on the validity of the conclusions of many studies on FDSs, since most of the proposals in the literature are only evaluated using a single database.
Copyright © 2020 Eduardo Casilari et al.
Conflict of interest statement
The authors declare no conflicts of interest.
Figures

Similar articles
-
A Feasibility Study of the Use of Smartwatches in Wearable Fall Detection Systems.Sensors (Basel). 2021 Mar 23;21(6):2254. doi: 10.3390/s21062254. Sensors (Basel). 2021. PMID: 33807104 Free PMC article.
-
A study on the impact of the users' characteristics on the performance of wearable fall detection systems.Sci Rep. 2021 Nov 26;11(1):23011. doi: 10.1038/s41598-021-02537-z. Sci Rep. 2021. PMID: 34836975 Free PMC article.
-
Analysis of Public Datasets for Wearable Fall Detection Systems.Sensors (Basel). 2017 Jun 27;17(7):1513. doi: 10.3390/s17071513. Sensors (Basel). 2017. PMID: 28653991 Free PMC article. Review.
-
A Study on the Application of Convolutional Neural Networks to Fall Detection Evaluated with Multiple Public Datasets.Sensors (Basel). 2020 Mar 6;20(5):1466. doi: 10.3390/s20051466. Sensors (Basel). 2020. PMID: 32155936 Free PMC article.
-
Analysis of Android Device-Based Solutions for Fall Detection.Sensors (Basel). 2015 Jul 23;15(8):17827-94. doi: 10.3390/s150817827. Sensors (Basel). 2015. PMID: 26213928 Free PMC article. Review.
Cited by
-
A Study of One-Class Classification Algorithms for Wearable Fall Sensors.Biosensors (Basel). 2021 Aug 19;11(8):284. doi: 10.3390/bios11080284. Biosensors (Basel). 2021. PMID: 34436087 Free PMC article.
-
Event-Centered Data Segmentation in Accelerometer-Based Fall Detection Algorithms.Sensors (Basel). 2021 Jun 24;21(13):4335. doi: 10.3390/s21134335. Sensors (Basel). 2021. PMID: 34202820 Free PMC article.
-
A Feasibility Study of the Use of Smartwatches in Wearable Fall Detection Systems.Sensors (Basel). 2021 Mar 23;21(6):2254. doi: 10.3390/s21062254. Sensors (Basel). 2021. PMID: 33807104 Free PMC article.
-
A study on the impact of the users' characteristics on the performance of wearable fall detection systems.Sci Rep. 2021 Nov 26;11(1):23011. doi: 10.1038/s41598-021-02537-z. Sci Rep. 2021. PMID: 34836975 Free PMC article.
-
UMAHand: A dataset of inertial signals of typical hand activities.Data Brief. 2024 Jul 10;55:110731. doi: 10.1016/j.dib.2024.110731. eCollection 2024 Aug. Data Brief. 2024. PMID: 39081492 Free PMC article.
References
-
- World Health Organization (WHO) Falls (facts sheet, 16 January 2018) 2018.
-
- Lord S. R., Sherrington C., Menz H. B., Close J. C. T. Falls in Older People: Risk Factors and Strategies for Prevention. Cambridge, UK: Cambridge University Press; 2007.
-
- Ku Y.-C., Liu M.-E., Tsai Y.-F., Liu W.-C., Lin S.-L., Tsai S.-J. Associated factors for falls, recurrent falls, and injurious falls in aged men living in taiwan veterans homes. International Journal of Gerontology. 2013;7(2):80–84. doi: 10.1016/j.ijge.2012.07.004. - DOI
-
- Kangas M., Vikman I., Nyberg L., Korpelainen R., Lindblom J., Jämsä T. Comparison of real-life accidental falls in older people with experimental falls in middle-aged test subjects. Gait Posture. 2012;35(3):500–505. - PubMed
Publication types
MeSH terms
LinkOut - more resources
Full Text Sources
Medical
