. 2020 Dec 23;9(12):e1217.
doi: 10.1002/cti2.1217. eCollection 2020.

Severe SARS-CoV-2 patients develop a higher specific T-cell response

Affiliations

Severe SARS-CoV-2 patients develop a higher specific T-cell response

Julie Demaret et al. Clin Transl Immunology. .

Abstract

Objectives: Assessment of the adaptive immune response against severe acute respiratory syndrome coronavirus 2 (SARS-CoV-2) is crucial for studying long-term immunity and vaccine strategies. We quantified IFNγ-secreting T cells reactive against the main viral SARS-CoV-2 antigens using a standardised enzyme-linked immunospot assay (ELISpot).

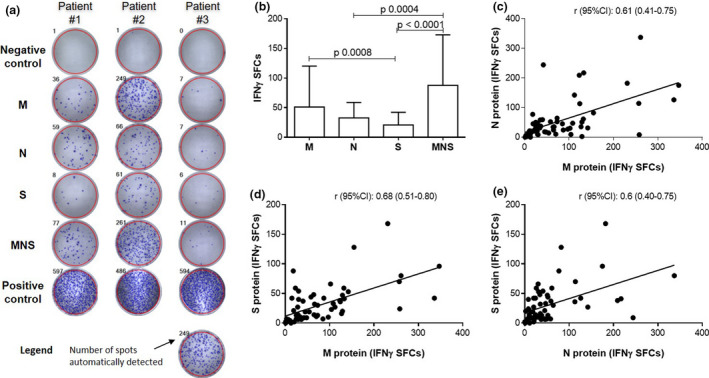
Methods: Overlapping peptide pools built from the sequences of M, N and S viral proteins and a mix (MNS) were used as antigens. Using IFNγ T-CoV-Spot assay, we assessed T-cell and antibody responses in mild, moderate and severe SARS-CoV-2 patients and in control samples collected before the outbreak.

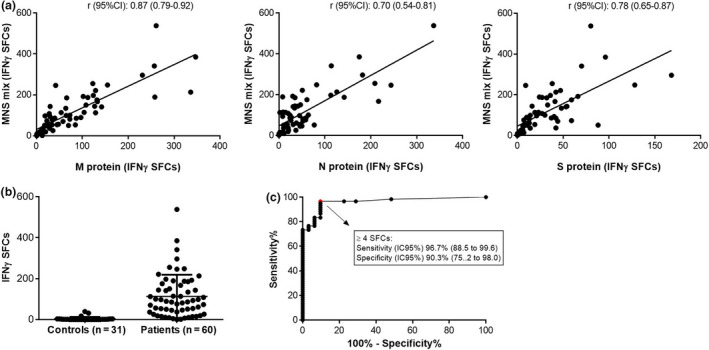
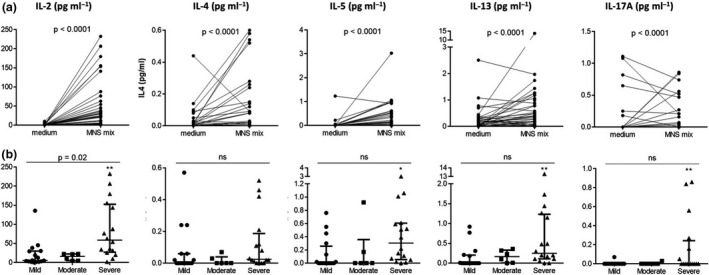
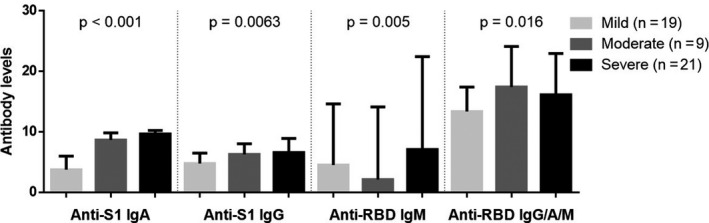
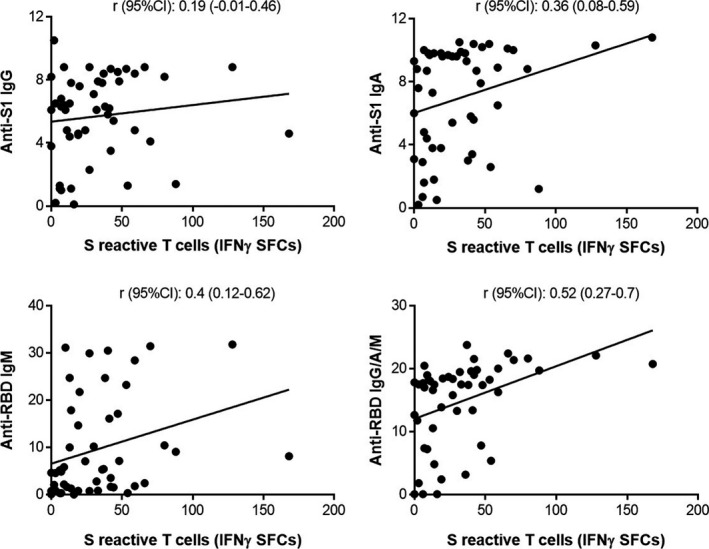
Results: Specific T cells were assessed in 60 consecutive patients (mild, n = 26; moderate, n = 10; and severe patients, n = 24) during their follow-up (median time from symptom onset [interquartile range]: 36 days [28;53]). T cells against M, N and S peptide pools were detected in n = 60 (100%), n = 56 (93.3%), n = 55 patients (91.7%), respectively. Using the MNS mix, IFNγ T-CoV-Spot assay showed a specificity of 96.7% (95% CI, 88.5-99.6%) and a specificity of 90.3% (75.2-98.0%). The frequency of reactive T cells observed with M, S and MNS mix pools correlated with severity and with levels of anti-S1 and anti-RBD serum antibodies.

Conclusion: IFNγ T-CoV-Spot assay is a reliable method to explore specific T cells in large cohorts of patients. This test may become a useful tool to assess the long-lived memory T-cell response after vaccination. Our study demonstrates that SARS-CoV-2 patients developing a severe disease achieve a higher adaptive immune response.

Keywords: ELISpot; SARS‐CoV‐2; T cells.


Conflict of interest statement

The authors declare no conflict of interest.

Figures

Figure 1
Figure 1
M, N, S and MNS mix‐reactive T cells in 60 SARS‐CoV‐2 patients. (a) Automated detection of IFNγ‐SFCs in wells after 16–20 h of stimulation. Negative and positive control wells allow quality control assessment; reactive T cells are counted in ‘M’, ‘N’, ‘S’ and ‘MNS’ wells. Three representative patterns of response are illustrated. Negative control: well without antigen/mitogen. Positive control: well with phytohaemagglutinin (PHA). (b) Comparisons of IFNγ‐SFCs according to the tested antigens. Data are presented as the median + IQR and P‐values comparing the tested antigens from Dunn’s tests (post hoc for the Kruskal–Wallis test). (c–e) Comparisons of IFNγ‐SFCs according to the tested antigens. Correlations were assessed using Spearman’s rank correlation coefficients (r).
Figure 2
Figure 2
Characteristics of IFNγ T‐CoV‐Spot assay using the MNS mix as antigenic preparation. (a) Correlation (Spearman’s rank correlation) between IFNγ‐SFC counts with MNS and with M, N and S alone in the first 60 patients. (b) IFNγ‐SFC counts with MNS in 31 controls and 60 SARS‐CoV‐2 patients. (c) ROC curve for T‐CoV‐Spot using the MNS mix with an optimal cut‐off value at 4 IFNγ‐SFCs.
Figure 3
Figure 3
Assessment of IFNγ‐secreting SARS‐CoV‐2‐reactive T cells according to patients’ severity status (n = 60). P‐values are calculated using partial Spearman’s rank correlation coefficients with severity status, adjusted for time from symptom onset to sampling. Comparisons between severe and mild patients using Dunn’s tests (post hoc for the Kruskal–Wallis test) are indicated as *P ≤ 0.05, **P ≤ 0.01, ***P ≤ 0.001 or ****P ≤ 0.0001.
Figure 4
Figure 4
Cytokine levels in the supernatants of PBMCs from SARS‐CoV‐2 patients. (a) Cytokine levels detected after stimulation by the MNS mix or in the negative control (medium). P‐values are from the Wilcoxon test. (b) Cytokine levels detected after stimulation by the MNS mix, according to the severity of the disease in mild (n = 16), moderate (n = 6) and severe patients (n = 16). P‐values are calculated using partial Spearman’s rank correlation coefficients with severity status, adjusted for time from symptom onset to sampling. Comparisons between severe and mild patients using Dunn’s tests (post hoc for the Kruskal–Wallis test) are indicated as *P ≤ 0.05 or **P ≤ 0.01.
Figure 5
Figure 5
Outcome of main immunological characteristics in mild, moderate and severe SARS‐CoV‐2 patients from diagnosis to follow‐up. (a) Lymphocyte subset counts at diagnosis and during follow‐up. (b) Plasma cytokine levels at diagnosis and at follow‐up (T‐CoV‐Spot assay). For the correlations with severity, P‐values are calculated using partial Spearman’s rank correlation coefficients, adjusted for time from symptom onset to sampling. For comparisons of plasma cytokine levels between plasma controls (n = 10) and SARS‐CoV‐2 patients classified according to severity using Dunn’s tests (post hoc for the Kruskal–Wallis test) are indicated as *P ≤ 0.05, **P ≤ 0.01, ***P ≤ 0.001 or ****P ≤ 0.0001. †, number of patients with available data or sample, ‡ time from symptom onset to follow‐up, in days (median [IQR]).
Figure 6
Figure 6
Anti‐S1 and anti‐RBD antibody levels in SARS‐CoV‐2 patients (n = 49), according to patients’ severity status. P‐values were calculated using partial Spearman’s rank correlation coefficients with severity status, adjusted for time from symptom onset to sampling.
Figure 7
Figure 7
Correlation between anti‐S1 and anti‐RBD antibody ratios and S‐reactive T cells in SARS‐CoV‐2 patients (n = 49). Correlation (Spearman’s rank correlation) between IFNγ‐SFCs obtained with S peptide pool, and anti‐S1 or anti‐RBD antibody index.

References

    1. Huff HV, Singh A. Asymptomatic transmission during the COVID‐19 pandemic and implications for public health strategies. Clin Infect Dis 2020. 10.1093/cid/ciaa654. Online ahead of print. - DOI - PMC - PubMed
    1. Pedersen SF, Ho YC. SARS‐CoV‐2: a storm is raging. J Clin Invest 2020; 130: 2202–2205. - PMC - PubMed
    1. Wang D, Hu B, Hu C et al Clinical characteristics of 138 hospitalized patients with 2019 novel coronavirus‐infected pneumonia in Wuhan, China. JAMA 2020; 323: 1061–1069. - PMC - PubMed
    1. Copin MC, Parmentier E, Duburcq T et al Time to consider histologic pattern of lung injury to treat critically ill patients with COVID‐19 infection. Intensive Care Med 2020; 46: 1124–1126. - PMC - PubMed
    1. Lax SF, Skok K, Zechner P et al Pulmonary arterial thrombosis in COVID‐19 with fatal outcome: results from a prospective, single‐center, clinicopathologic case series. Ann Intern Med 2020; 173: 350–361. - PMC - PubMed