. 2020 Aug 16;2020(1):niaa017.
doi: 10.1093/nc/niaa017. eCollection 2020.

Brain network motif topography may predict emergence from disorders of consciousness: a case series

Affiliations

Brain network motif topography may predict emergence from disorders of consciousness: a case series

Danielle Nadin et al. Neurosci Conscious. .

Abstract

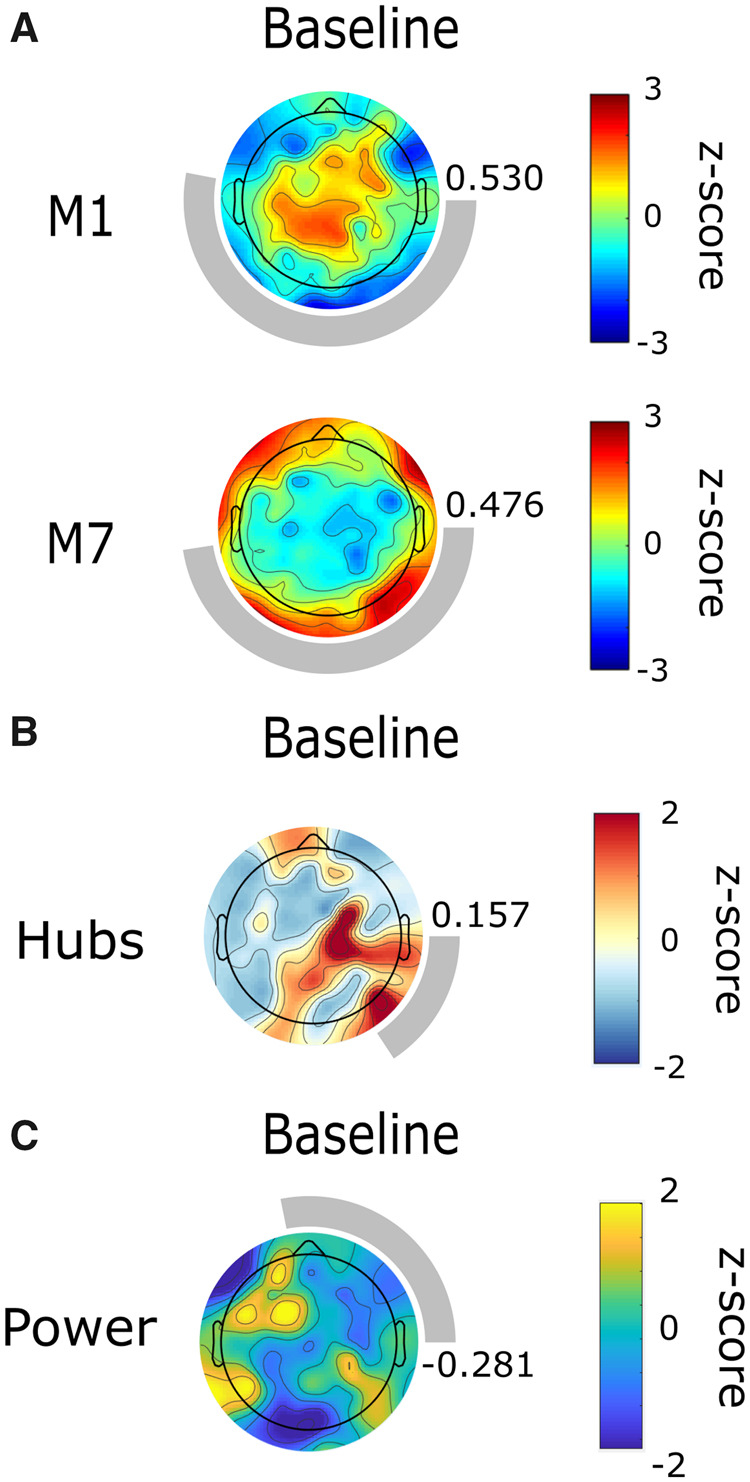
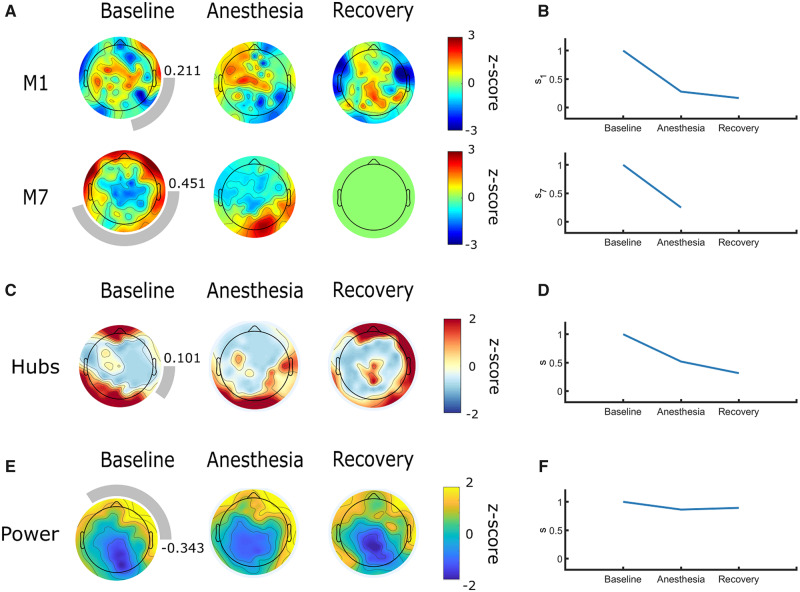
Neuroimaging methods have improved the accuracy of diagnosis in patients with disorders of consciousness (DOC), but novel, clinically translatable methods for prognosticating this population are still needed. In this case series, we explored the association between topographic and global brain network properties and prognosis in patients with DOC. We recorded high-density electroencephalograms in three patients with acute or chronic DOC, two of whom also underwent an anesthetic protocol. In these two cases, we compared functional network motifs, network hubs and power topography (i.e. topographic network properties), as well as relative power and graph theoretical measures (i.e. global network properties), at baseline, during exposure to anesthesia and after recovery from anesthesia. We also compared these properties to a group of healthy, conscious controls. At baseline, the topographic distribution of nodes participating in alpha motifs resembled conscious controls in patients who later recovered consciousness and high relative power in the delta band was associated with a negative outcome. Strikingly, the reorganization of network motifs, network hubs and power topography under anesthesia followed by their return to a baseline patterns upon recovery from anesthesia, was associated with recovery of consciousness. Our findings suggest that topographic network properties measured at the single-electrode level might provide more prognostic information than global network properties that are averaged across the brain network. In addition, we propose that the brain network's capacity to reorganize in response to a perturbation is a precursor to the recovery of consciousness in DOC patients.

Keywords: anesthesia; brain networks; disorders of consciousness; electroencephalography; graph theory; network hubs; network motifs.


Figures

Figure 1.
Figure 1.
Three-node unidirectional network motifs explored during motif analysis. Only unidirectional motifs can be computed using the directed phase-lag index (dPLI) and are surrounded by boxes. Circles indicate nodes in the network and arrows represent functional relationships between nodes.
Figure 2.
Figure 2.
Topographic network properties in the alpha band distinguish between consciousness and anesthetic-induced unconsciousness in healthy controls; adapted from Duclos et al. (2020). In a cohort of nine healthy controls, the average topographies of alpha motif frequency, node degree, and power undergo anterior–posterior shifts across stages of anesthetic-induced unconsciousness. Topographic maps represent z-scores comparing motif frequency (A), node degree (C), and power (E) of each electrode to the distribution across all electrodes. Cosine similarity to baseline quantitatively reflects these shifts (B, D, and F, respectively). M1, motif 1; M7, motif 7.
Figure 3.
Figure 3.
Alpha network motif topographies resemble those of healthy controls in an individual who emerged from minimally conscious state. Topography of alpha motif frequency, but not of node degree or power, are similar to those of healthy controls at baseline. Topographic maps represent z-scores comparing motif frequency (A), node degree (B), and power (C) of each electrode to the distribution across all electrodes. Rings surrounding the topographic maps represent the median cosine similarity to conscious controls; a more complete ring corresponds to higher similarity, the value of which is also indicated to the right of each topographic map. M1, motif 1; M7, motif 7.
Figure 4.
Figure 4.
Alpha network motif, hub, and power topographic reorganization under anesthesia in a patient who emerged from unresponsive wakefulness syndrome. Topography of alpha motif frequency, but not of node degree or power, are similar to those of healthy controls at baseline. Motif, node degree, and power distributions undergo topographic reorganization under anesthesia, similar to healthy controls. Topographic maps represent z-scores comparing motif frequency (A), node degree (C), and power (E) of each electrode to the distribution across all electrodes. Rings surrounding the topographic maps represent the median cosine similarity to conscious controls; a more complete ring corresponds to higher similarity, the value of which is also indicated to the right of each topographic map. Cosine similarity to the participant’s own baseline quantitatively reflects these shifts (B, D, and F, respectively). M1, motif 1; M7, motif 7.
Figure 5.
Figure 5.
Alpha network motif, hub and power topographies are spatially incoherent in an individual with persistent unresponsive wakefulness syndrome. Topography of alpha motif frequency, node degree and power are dissimilar to healthy controls at baseline. Under anesthesia, distributions either did not reorganize, or did not follow the pattern expected based on observations in healthy controls. Topographic maps represent z-scores comparing motif frequency (A), node degree (C), and power (E) of each electrode to the distribution across all electrodes. Rings surrounding the topographic maps represent the median cosine similarity to conscious controls; a more complete ring corresponds to higher similarity, the value of which is also indicated to the right of each topographic map. Cosine similarity to the participant’s own baseline quantitatively reflects the failure of topographic patterns to reorganize in a clear pattern (B, D, and F, respectively). M1, motif 1; M7, motif 7.
Figure 6.
Figure 6.
Comparison of alpha global network properties between conscious controls and individuals with disorders of consciousness. Graph theoretical network properties were not associated with prognosis (A), but relative power in the delta band (B) was elevated relative to conscious controls in the patient who did not recover consciousness. Boxes represent the interquartile range of the values for conscious controls, with the median indicated by a horizontal line. The whiskers extend to the minimal and maximal values which are not outliers, while outliers, defined as values greater than the median ± 1.57 times the interquartile range, are represented by crosses. Values for disorders of consciousness patients who recovered behavioral responsiveness are represented by circles, while the values for the patient who remained in unresponsive wakefulness syndrome are represented by a diamond. CTRL, conscious controls; P, patient.

References

    1. Bagnato S, Boccagni C, Prestandrea C, et al. Changes in standard electroencephalograms parallel consciousness improvements in patients with unresponsive wakefulness syndrome. Arch Phys Med Rehab 2017;98:665–72. - PubMed
    1. Bai Y, Xia X, Wang Y, et al. Electroencephalography quadratic phase self-coupling correlates with consciousness states and restoration in patients with disorders of consciousness. Clin Neurophysiol 2019;130:1235–42. - PubMed
    1. Blain-Moraes S, Boshra R, Ma HK, et al. Normal brain response to propofol in advance of recovery from unresponsive wakefulness syndrome. Front Hum Neurosci 2016;10:10. - PMC - PubMed
    1. Casali AG, Gosseries O, Rosanova M, et al. A theoretically based index of consciousness independent of sensory processing and behavior. Sci Transl Med 2013;5:198ra105. - PubMed
    1. Casarotto S, Comanducci A, Rosanova M, et al. Stratification of unresponsive patients by an independently validated index of brain complexity. Ann Neurol 2016;80:718–729. - PMC - PubMed