. 2020 Dec 8:2020:4251761.
doi: 10.1155/2020/4251761. eCollection 2020.

Identification of Potential Hub Genes Related to Diagnosis and Prognosis of Hepatitis B Virus-Related Hepatocellular Carcinoma via Integrated Bioinformatics Analysis

Affiliations

Identification of Potential Hub Genes Related to Diagnosis and Prognosis of Hepatitis B Virus-Related Hepatocellular Carcinoma via Integrated Bioinformatics Analysis

Yuqin Tang et al. Biomed Res Int. .

Abstract

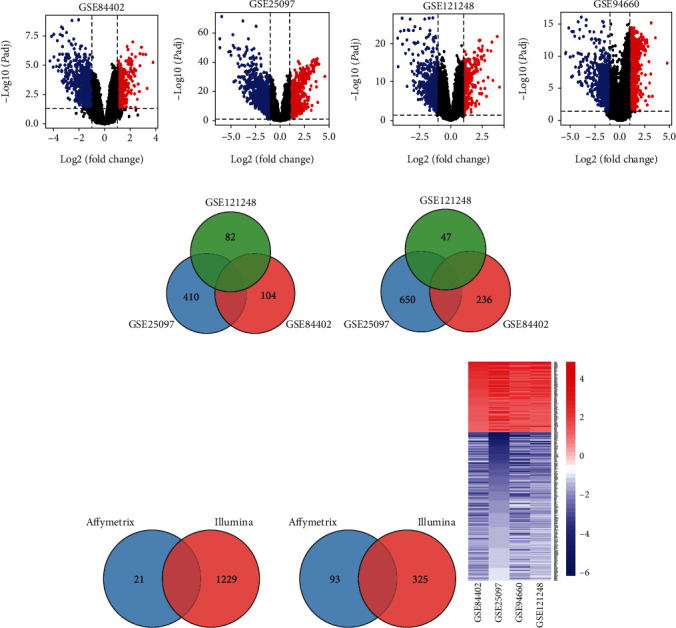
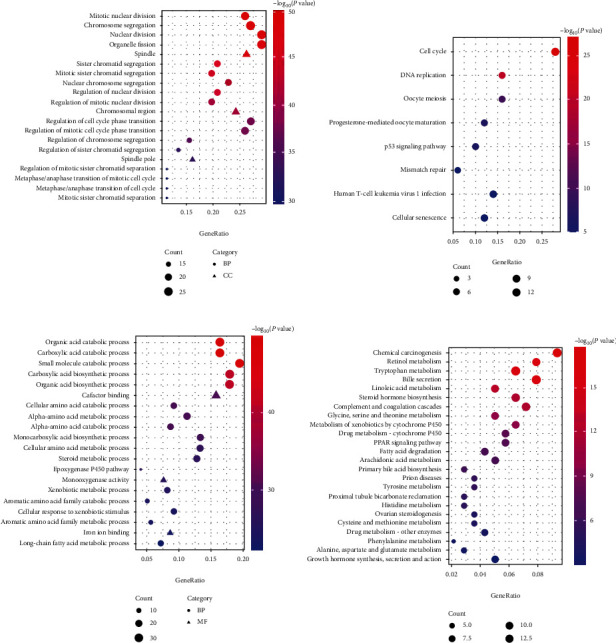
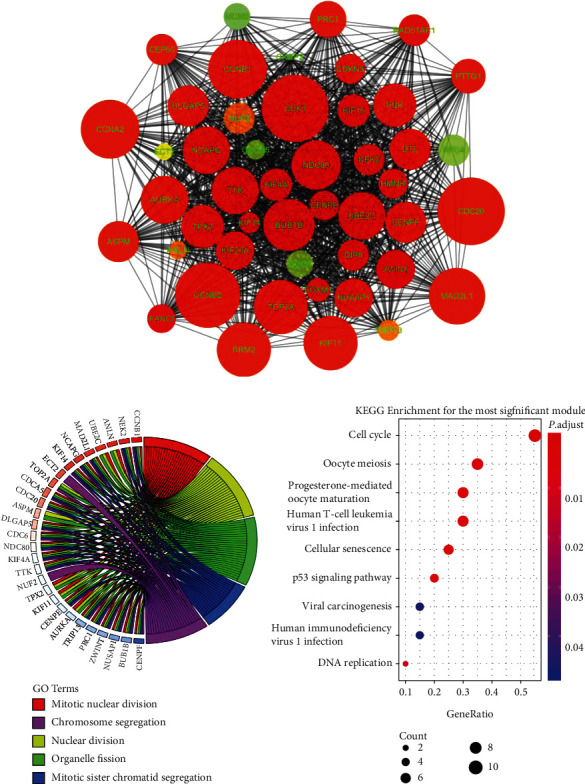
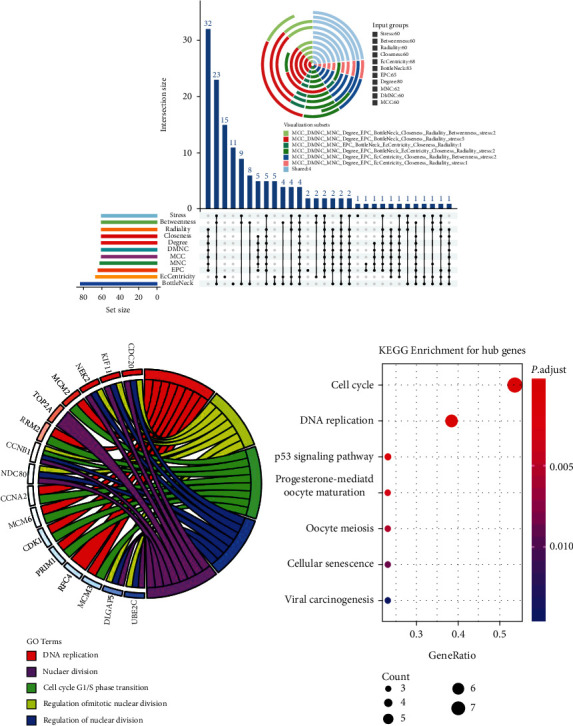
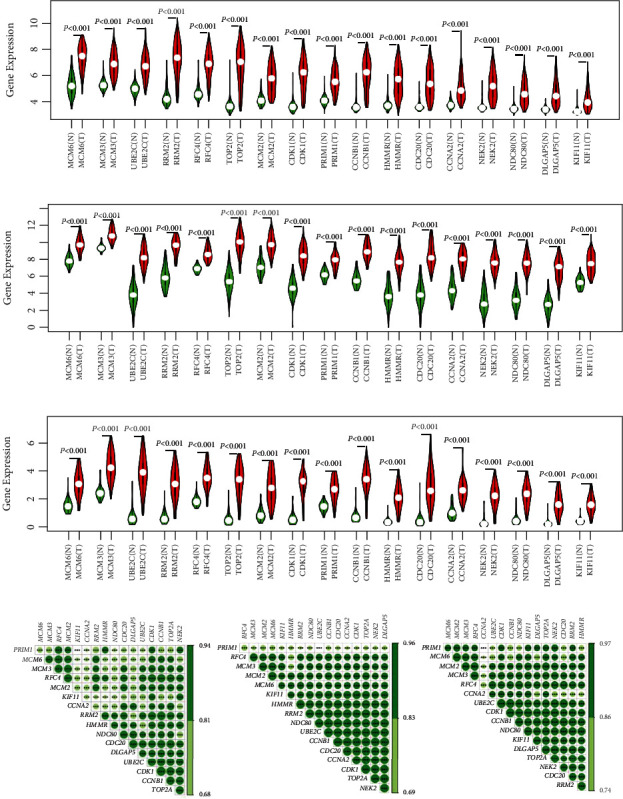
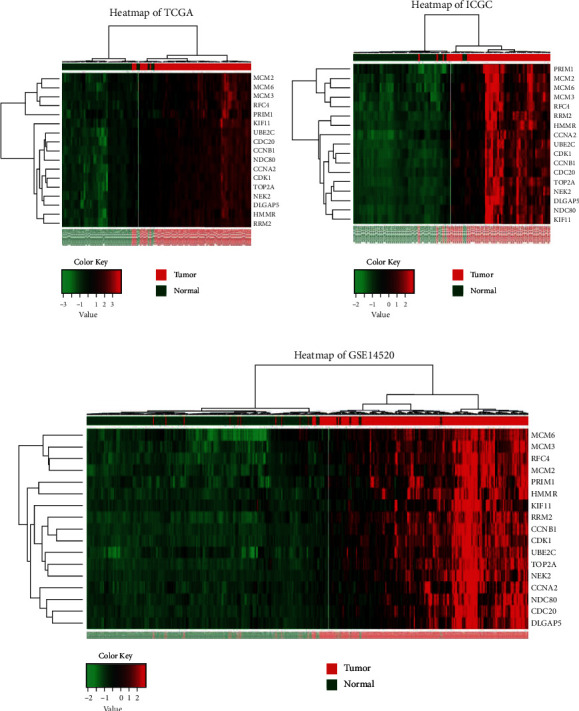
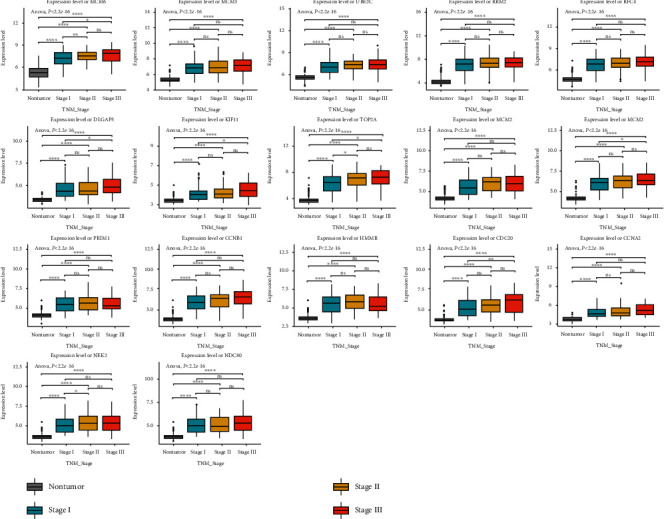
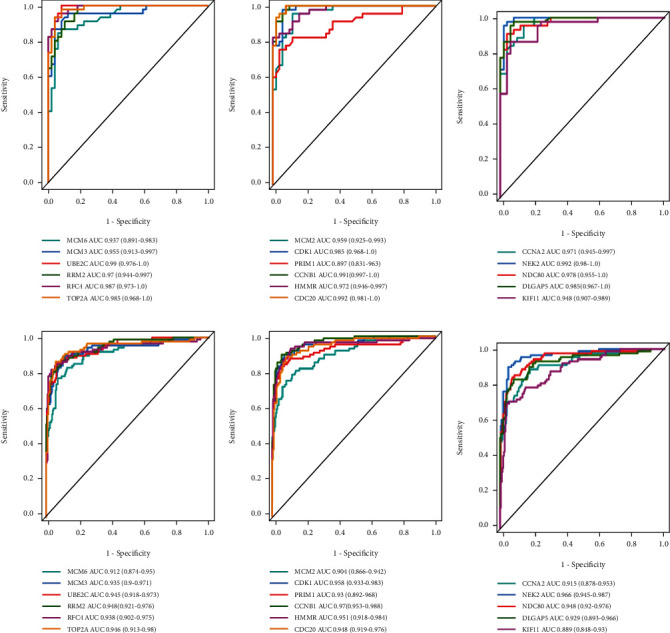
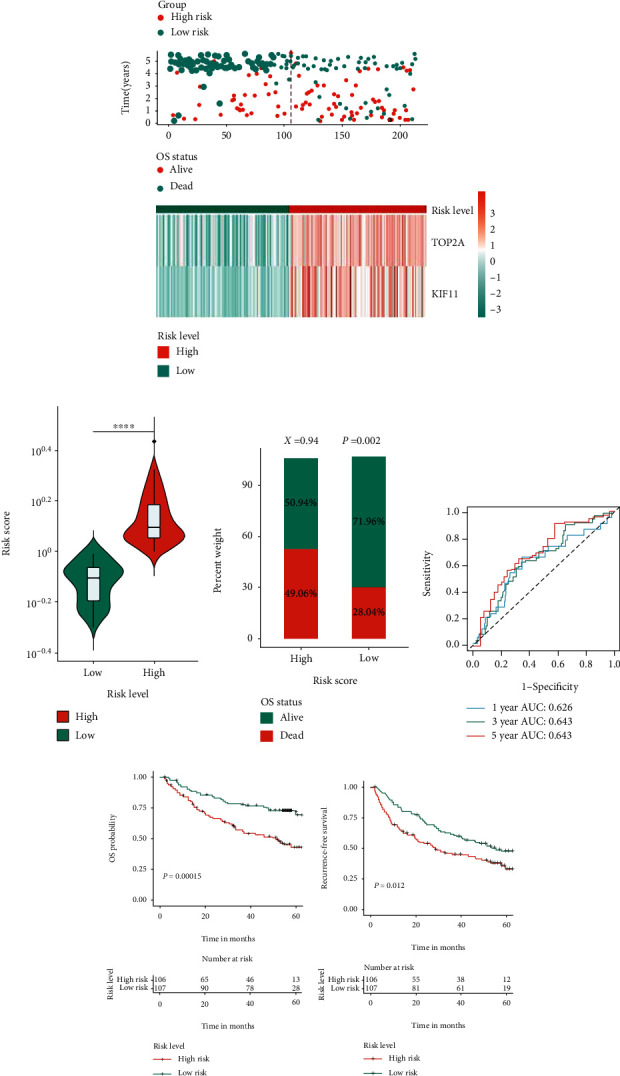
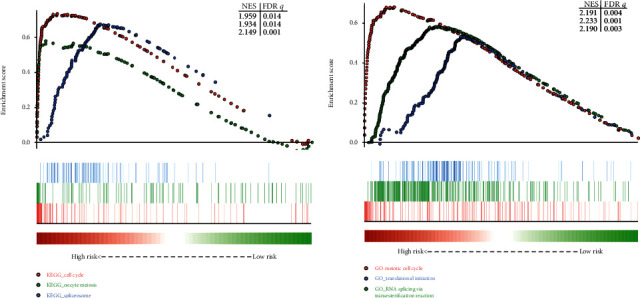
Hepatocellular carcinoma (HCC) is a common malignant cancer with poor survival outcomes, and hepatitis B virus (HBV) infection is most likely to contribute to HCC. But the molecular mechanism remains obscure. Our study intended to identify the candidate potential hub genes associated with the carcinogenesis of HBV-related HCC (HBV-HCC), which may be helpful in developing novel tumor biomarkers for potential targeted therapies. Four transcriptome datasets (GSE84402, GSE25097, GSE94660, and GSE121248) were used to screen the 309 overlapping differentially expressed genes (DEGs), including 100 upregulated genes and 209 downregulated genes. Gene Ontology (GO) and Kyoto Encyclopedia of Genes and Genomes (KEGG) enrichment were used to explore the biological function of DEGs. A PPI network based on the STRING database was constructed and visualized by the Cytoscape software, consisting of 209 nodes and 1676 edges. Then, we recognized 17 hub genes by CytoHubba plugin, which were further validated on additional three datasets (GSE14520, TCGA-LIHC, and ICGC-LIRI-JP). The diagnostic effectiveness of hub genes was assessed with receiver operating characteristic (ROC) analysis, and all hub genes displayed good performance in discriminating TNM stage I patient samples and normal tissue ones. For prognostic analysis, two prognostic key genes (TOP2A and KIF11) out of the 17 hub genes were screened and used to develop a prognostic signature, which showed good potential for overall survival (OS) stratification of HBV-HCC patients. Gene Set Enrichment Analysis (GSEA) was performed in order to better understand the function of this prognostic gene signature. Finally, the miRNA-mRNA regulatory relationships of all hub genes in human liver were predicted using miRNet. In conclusion, the current study gives further insight on the pathogenesis and carcinogenesis of HBV-HCC, and the identified DEGs provide a promising direction for improving the diagnostic, prognostic, and therapeutic outcomes of HBV-HCC.


Conflict of interest statement

The authors declare that they have no conflict of interest.

Figures

Figure 1
Figure 1
Identification of overlapping DEGs among the screening datasets of HBV-HCC. (a–d) Volcano plot for GSE84402, GSE25097, GSE121248, and GSE94660. (e) Venn diagram for the overlapping DEGs from Affymetrix biosystems. (f) Common DEGs shared by Affymetrix and Illumina platforms. (g) Heatmap of 309 common DEGs. Blue represents downregulated genes while red represents upregulated genes. Each column represents one dataset, and each row represents one gene. DEGs: differentially expressed genes; HBV-HCC: HBV-related hepatocellular cancer.
Figure 2
Figure 2
Function enrichment analysis of the overlapping DEGs. (a) GO analysis for the upregulated DEGs (top 20 GO terms are shown). (b) KEGG pathway enrichment for the upregulated DEGs. (c) GO analysis for the downregulated DEGs (top 20 GO terms are shown). (d) KEGG pathway enrichment for the downregulated DEGs. BP: biological process; CC: cellular component; MF: molecular function.
Figure 3
Figure 3
Subnetwork analysis of the DEGs PPI. (a) The most significant module selected by MCODE plugin (MCODE score > 40), comprising 47 nodes. (b) Top five related GO terms enriched by the DEGs in the module. (c) KEGG enrichment analyses for the DEGs in the module.
Figure 4
Figure 4
Hub gene identification and functional analysis. (a) The combination of Upset plot and Vennpie plot shows the 17 hub genes identified by CytoHubba plugin through DEG PPI network, with an overlapping strategy. (b) Top five related GO terms of the hub genes. (c) Result of KEGG pathway analysis of the hub genes.
Figure 5
Figure 5
Validation of the aberrant expression levels for the selected hub genes and coexpression analysis. (a–c) Violin plots showing the significantly increased expression values for all of the 17 hub genes based on GSE14520, TCGA-LIHC, and ICGC-LIRI-JP. (d) Pearson correlation analysis among expression levels of the 17 hub genes for GSE14520, TCGA-LIHC, and ICGC-LIRI-JP. The color depth indicates the degree of correlation. The darker the color, the higher the correlation coefficient. ∗∗∗P < 0.001.
Figure 6
Figure 6
Clustering heatmaps of 17 hub genes based on (a) TCGA-LIHC, (b) ICGC-LIRI-JP, and (c) GSE14520. Red denotes high expression levels while green denotes low expression levels.
Figure 7
Figure 7
Boxplots showing the relative expression levels of 17 hub genes across normal liver tissues and cancer tissues with different TNM stages for HBV-HCC. P < 0.05, ∗∗P < 0.01, ∗∗∗P < 0.001, and ∗∗∗∗P < 0.0001.
Figure 8
Figure 8
The ROC curves and AUC (95% CI) for each of the selected hub genes to evaluate their efficiency in the early diagnosis of HBV-HCC based on (a–c) TCGA-LIHC cohort and (d–f) GSE14520 cohort. Colored lines denote sensitive curves for each hub gene, and grey line denotes the identify line. ROC: receiver operating characteristic; AUC: area under the curve.
Figure 9
Figure 9
Prognostic assessments of hub genes by GSE14520 cohort. (a) Risk score, survival outcome, and hub gene expression values for each patient in high- and low-risk groups. (b) Comparison of risk scores between high- and low-risk groups. ∗∗∗∗P < 0.0001. (c) Distribute of different survival status in high- and low-risk score groups. Statistical significance was determined by chi-square test. (d) The time-dependent ROC curves for the two-hub gene-based signature at 1, 3, and 5 years to assess accuracy of prognostic prediction. (e, f) Kaplan-Meier curves of (e) OS and (f) RFS in HBV-HCC patients based on the risk score classification. P was calculated by the log-rank test, and P < 0.05 was considered statistically significant. HBV-HCC: HBV-related HCC; OS: overall survival; RFS: relapse-free survival.
Figure 10
Figure 10
GSEA results of high- or low-risk groups divided by the two-hub gene-based signature in GSE14520 cohort. (a) Results of GO terms enriched in highly risk group vs. low-risk group. (b) Results of KEGG pathways enriched in highly risk group vs. low-risk group. GSEA: Gene Set Enrichment Analyses.

References

    1. Bray F., Ferlay J., Soerjomataram I., Siegel R. L., Torre L. A., Jemal A. Global cancer statistics 2018: GLOBOCAN estimates of incidence and mortality worldwide for 36 cancers in 185 countries. CA: a Cancer Journal for Clinicians. 2018;68(6):394–424. doi: 10.3322/caac.21492. - DOI - PubMed
    1. Zhou M., Wang H., Zeng X., et al. Mortality, morbidity, and risk factors in China and its provinces, 1990-2017: a systematic analysis for the Global Burden of Disease Study 2017. Lancet. 2019;394(10204):1145–1158. doi: 10.1016/S0140-6736(19)30427-1. - DOI - PMC - PubMed
    1. de Martel C., Maucort-Boulch D., Plummer M., Franceschi S. World-wide relative contribution of hepatitis B and C viruses in hepatocellular carcinoma. Hepatology. 2015;62(4):1190–1200. doi: 10.1002/hep.27969. - DOI - PMC - PubMed
    1. Yang P., Li Q. J., Feng Y., et al. TGF-β-miR-34a-CCL22 signaling-induced Treg cell recruitment promotes venous metastases of HBV-positive hepatocellular carcinoma. Cancer Cell. 2012;22(3):291–303. doi: 10.1016/j.ccr.2012.07.023. - DOI - PMC - PubMed
    1. Feng W. W., Wilkins O., Bang S., et al. CD36-mediated metabolic rewiring of breast Cancer cells promotes resistance to HER2-targeted therapies. Cell Reports. 2019;29(11):3405–3420.e5. doi: 10.1016/j.celrep.2019.11.008. - DOI - PMC - PubMed

MeSH terms