. 2020 Dec 7;5(50):32823-32843.
doi: 10.1021/acsomega.0c05469. eCollection 2020 Dec 22.

Swarm-CG: Automatic Parametrization of Bonded Terms in MARTINI-Based Coarse-Grained Models of Simple to Complex Molecules via Fuzzy Self-Tuning Particle Swarm Optimization

Affiliations

Swarm-CG: Automatic Parametrization of Bonded Terms in MARTINI-Based Coarse-Grained Models of Simple to Complex Molecules via Fuzzy Self-Tuning Particle Swarm Optimization

Charly Empereur-Mot et al. ACS Omega. .

Abstract

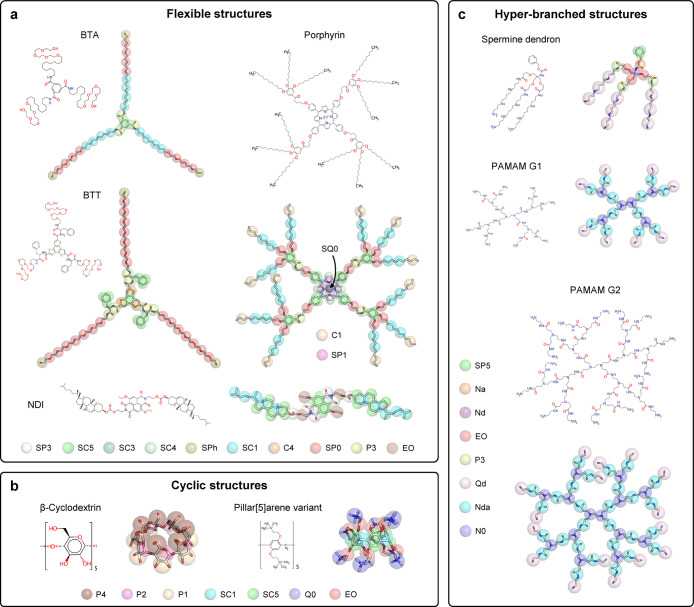
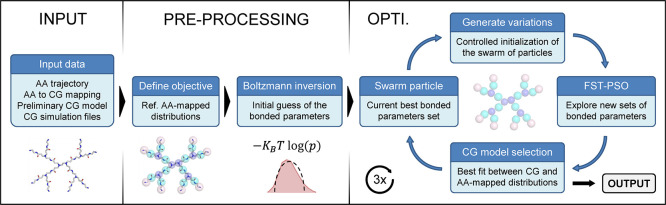
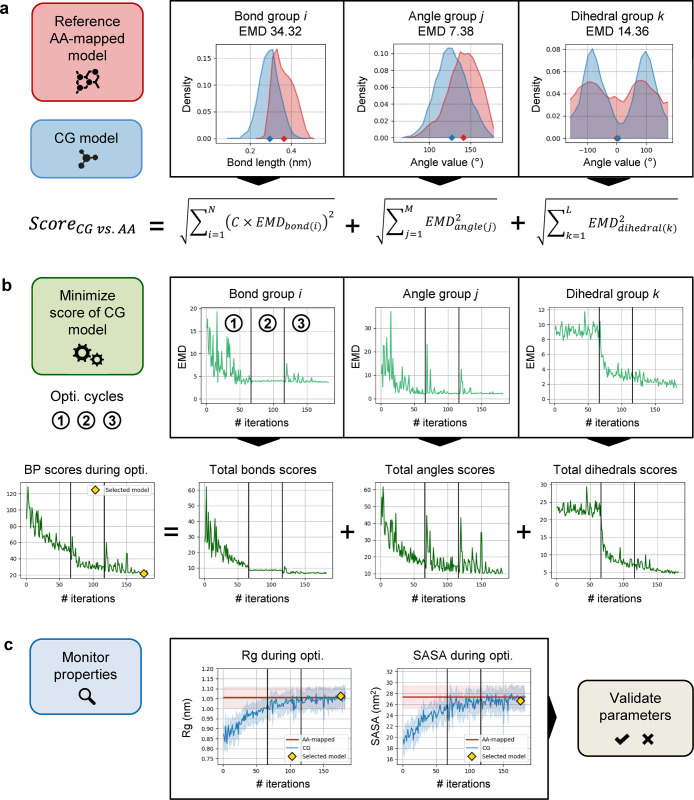
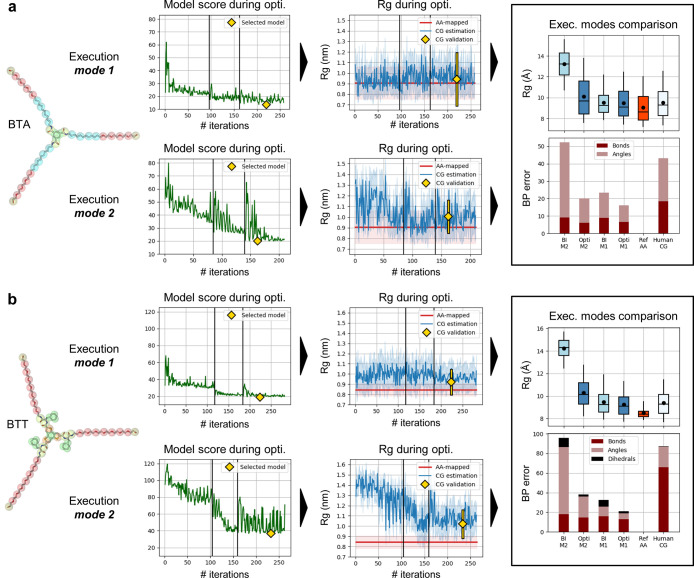
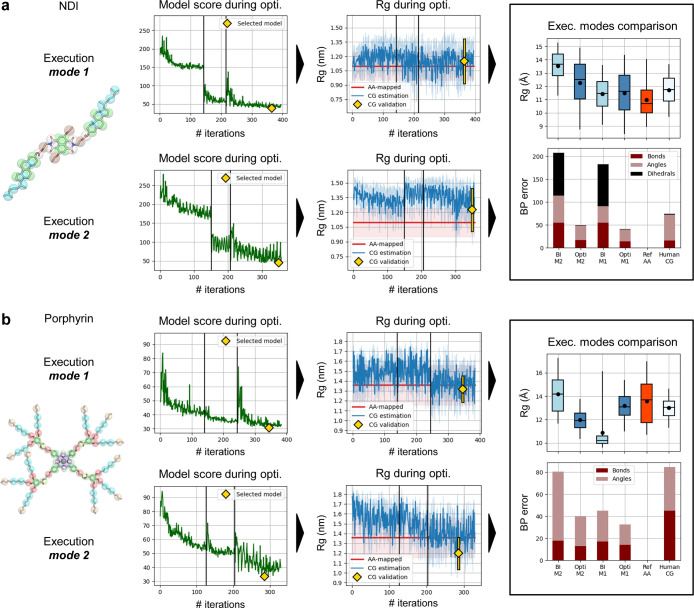
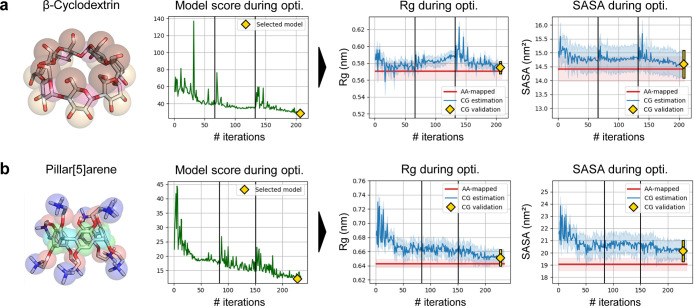
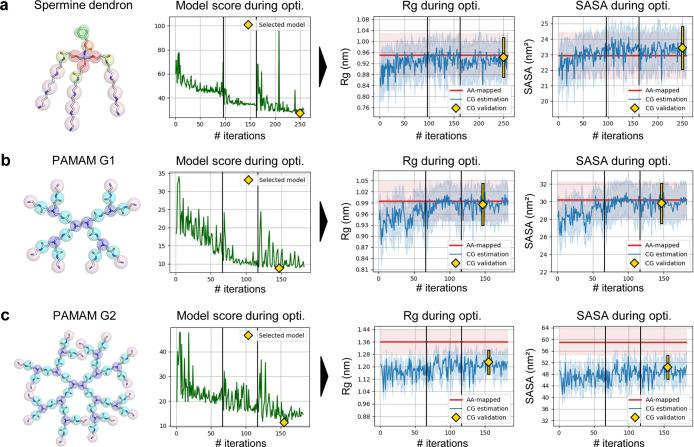
We present Swarm-CG, a versatile software for the automatic iterative parametrization of bonded parameters in coarse-grained (CG) models, ideal in combination with popular CG force fields such as MARTINI. By coupling fuzzy self-tuning particle swarm optimization to Boltzmann inversion, Swarm-CG performs accurate bottom-up parametrization of bonded terms in CG models composed of up to 200 pseudo atoms within 4-24 h on standard desktop machines, using default settings. The software benefits from a user-friendly interface and two different usage modes (default and advanced). We particularly expect Swarm-CG to support and facilitate the development of new CG models for the study of complex molecular systems interesting for bio- and nanotechnology. Excellent performances are demonstrated using a benchmark of 9 molecules of diverse nature, structural complexity, and size. Swarm-CG is available with all its dependencies via the Python Package Index (PIP package: swarm-cg). Demonstration data are available at: www.github.com/GMPavanLab/SwarmCG.


Conflict of interest statement

The authors declare no competing financial interest.

Figures

Figure 1
Figure 1
Molecules used to benchmark Swarm-CG. Each molecule is represented by its molecular structure and AA model with superimposed CG MARTINI bead mapping. (a) Flexible and symmetric molecular structures generating supramolecular polymers: water-soluble BTA with amphiphilic side chains, C3-symmetric BTT decorated by l-phenylalanine and octaethylene glycol side-chains, NDI-based, and Zn-porphyrin-based molecules. (b) Examples of cyclic structures: β-cyclodextrin and a pillar[5]arene. (c) Complex hyper-branched polymer structures: spermine dendron and PAMAM G1 and G2.,− Each panel indicates the color coding of the CG MARTINI bead types (see Supporting Information for exact mapping data).
Figure 2
Figure 2
General workflow of Swarm-CG. This can be schematized into three phases. (i) Preparation of the input: the software requires a reference AA-MD trajectory, a predefined AA-to-CG mapping and a preliminary CG model, where the nonbonded interactions are predefined (CG bead types and interactions), and (ii) preprocessing: an AA-mapped reference model is built, computing the bond, angle, and dihedral distributions of the reference AA-mapped MD trajectory, and an initial guess of bonded CG parameters is made (to be then optimized). (iii) Optimization process: iterative CG-MD simulations are performed, while at each iteration, Swarm-CG, starting from a “swarm particle” (a set of BPs), changes the BPs to optimize the consistency with the reference AA-MD trajectory. The resulting set of CG bond parameters is then obtained as the output.
Figure 3
Figure 3
Overview of the scoring function and iterative optimization procedure used in Swarm-CG to automatically tune the BPs of a preliminary CG model (using illustrative data). (a) Single model scoring: the scoring function evaluates the matching between pairwise distributions of N groups of bonds, M groups of angles, and L groups of dihedrals from CG vs AA model trajectories using the EMD. C is a scaling factor applied to the EMD of bonds. (b) Iterative model optimization: the procedure generates new sets of BPs to minimize the differences between CG and reference AA-mapped distributions. (c) Quality control: radius of gyration (Rg) and SASA monitored during optimization.
Figure 4
Figure 4
Results of Swarm-CG for the optimization of BPs of two C3-symmetric flexible structures using execution modes 1 (M1) and 2 (M2) with default settings: (a) BTA model. (b) BTT model. From left to right we report: (i) molecular structure and (ii) evolution of the scoring function, where green lines show the score attributed to candidate BPs during optimization. Yellow diamonds indicate the score of the selected model. (iii) the evolution of Rg, in which blue lines show average Rg estimates at each iteration of the CG model optimization (light blue intervals represent ±standard deviation), and red horizontal lines show the average Rg of AA-mapped reference trajectories (light red intervals represent ±standard deviation). Yellow diamonds and lines show averages and standard deviations obtained from 200 ns simulations. (iv) The comparison of Rg and BPs errors in different models in 200 ns simulations (BI: step 1, Opti: selected model). Boxplots and whiskers display percentiles 5, 25, 50, 75, and 95 of Rg values. Black dots show average Rg values. Stacked barplots show each component of the scoring function, the sum of which amounts to the BPs score.
Figure 5
Figure 5
Results of Swarm-CG for the optimization of BPs of other symmetric flexible structures in the benchmark, using execution modes 1 (M1) and 2 (M2) with default settings, (a) NDI model. (b) Porphyrin-based monomer model. From left to right we report: (i) molecular structure and (ii) evolution of the scoring function, where green lines show the score attributed to candidate BPs during optimization. Yellow diamonds indicate the score of the selected model. (iii) Evolution of Rg, in which blue lines show average Rg estimates at each iteration of the CG model optimization (light blue intervals represent ±standard deviation), and red horizontal lines show the average Rg of AA-mapped reference trajectories (light red intervals represent ±standard deviation). Yellow diamonds and lines show averages and standard deviations obtained from 200 ns simulations. (iv) Comparison of Rg and BPs errors in different models in 200 ns simulations (BI: step 1, opti.: selected model). Boxplots and whiskers display percentiles 5, 25, 50, 75, and 95 of Rg values. Black dots show average Rg values. Stacked barplots show each component of the scoring function, the sum of which amounts to the BPs score.
Figure 6
Figure 6
Results of Swarm-CG for the optimization of BPs of two cyclic structures using execution mode 1 with default settings. (a) β-Cyclodextrin model. (b) Pillar[5]arene model. From left to right we report: (i) molecular structure and (ii) evolution of the scoring function, where green lines show the score attributed to candidate BPs during optimization. Yellow diamonds indicate the score of the selected model. (iii) Evolution of Rg, in which blue lines show average Rg estimates at each iteration of the CG model optimization. (iv) Evolution of SASA, in which blue lines show average SASA estimates at each iteration of the CG model optimization. Light blue intervals represent ±standard deviation, and red horizontal lines show the average Rg/SASA of AA-mapped reference trajectories (light red intervals represent ±standard deviation). Yellow diamonds and lines show averages and standard deviations obtained from 200 ns simulations.
Figure 7
Figure 7
Results of Swarm-CG for the optimization of BPs of three types of hyper-branched macromolecules (i.e., dendrons and dendrimers) using execution mode 1 with default settings. (a) Spermine dendron model. (b) PAMAM G1 model. (c) PAMAM G2 model. From left to right we report: (i) molecular structure and (ii) evolution of the scoring function, where green lines show the score attributed to candidate BPs during optimization. Yellow diamonds indicate the score of the selected model. (iii) Evolution of Rg, in which blue lines show average Rg estimates at each iteration of the CG model optimization. (iv) Evolution of SASA, in which blue lines show average SASA estimates at each iteration of the CG model optimization. Light blue intervals represent ±standard deviation, and red horizontal lines show the average Rg/SASA of AA-mapped reference trajectories (light red intervals represent ±standard deviation). Yellow diamonds and lines show averages and standard deviations obtained from 200 ns simulations.

References

    1. Costerton J. W.; Ingram J. M.; Cheng K. J. Structure and Function of the Cell Envelope of Gram-Negative Bacteria. Bacteriol. Rev. 1974, 38, 87–110. 10.1128/mmbr.38.1.87-110.1974. - DOI - PMC - PubMed
    1. Lugtenberg B.; Van Alphen L. Molecular Architecture and Functioning of the Outer Membrane of Escherichia Coli and Other Gram-Negative Bacteria. Biochim. Biophys. Acta, Rev. Biomembr. 1983, 737, 51–115. 10.1016/0304-4157(83)90014-X. - DOI - PubMed
    1. Mitchison T.; Kirschner M. Dynamic Instability of Microtubule Growth. Nature 1984, 312, 237–242. 10.1038/312237a0. - DOI - PubMed
    1. Whitesides G.; Mathias J.; Seto C. Molecular Self-Assembly and Nanochemistry: A Chemical Strategy for the Synthesis of Nanostructures. Science 1991, 254, 1312–1319. 10.1126/science.1962191. - DOI - PubMed
    1. Aida T.; Meijer E. W.; Stupp S. I. Functional Supramolecular Polymers. Science 2012, 335, 813–817. 10.1126/science.1205962. - DOI - PMC - PubMed