. 2020 Nov 25;23(12):101747.
doi: 10.1016/j.isci.2020.101747. eCollection 2020 Dec 18.

Beyond Low-Earth Orbit: Characterizing Immune and microRNA Differentials following Simulated Deep Spaceflight Conditions in Mice

Affiliations

Beyond Low-Earth Orbit: Characterizing Immune and microRNA Differentials following Simulated Deep Spaceflight Conditions in Mice

Amber M Paul et al. iScience. .

Abstract

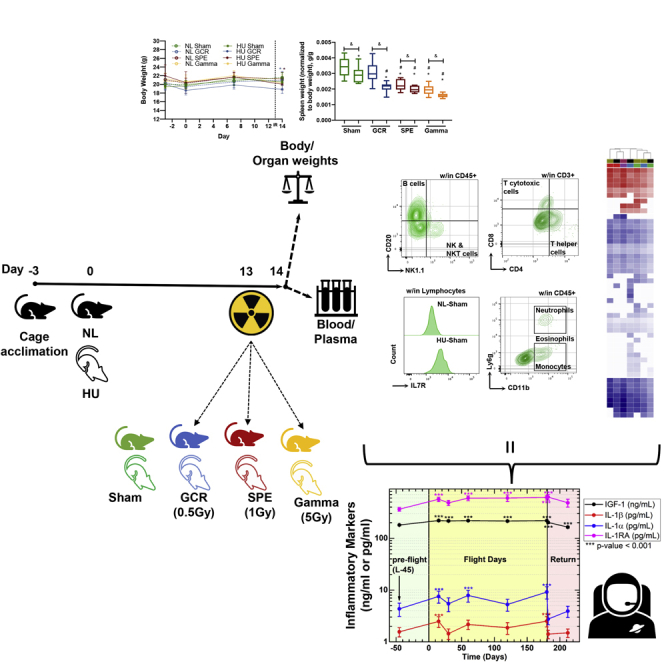
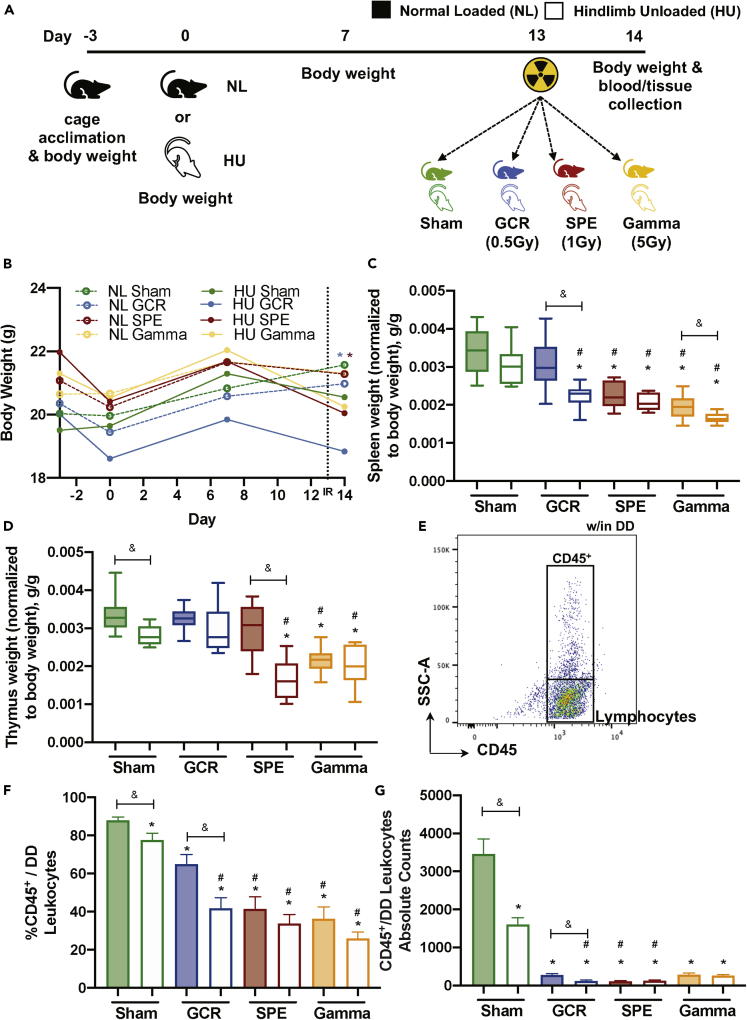
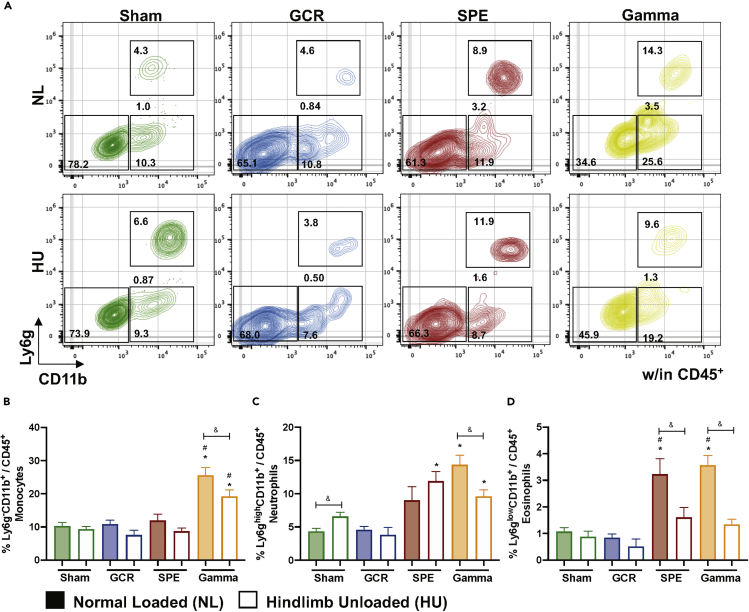
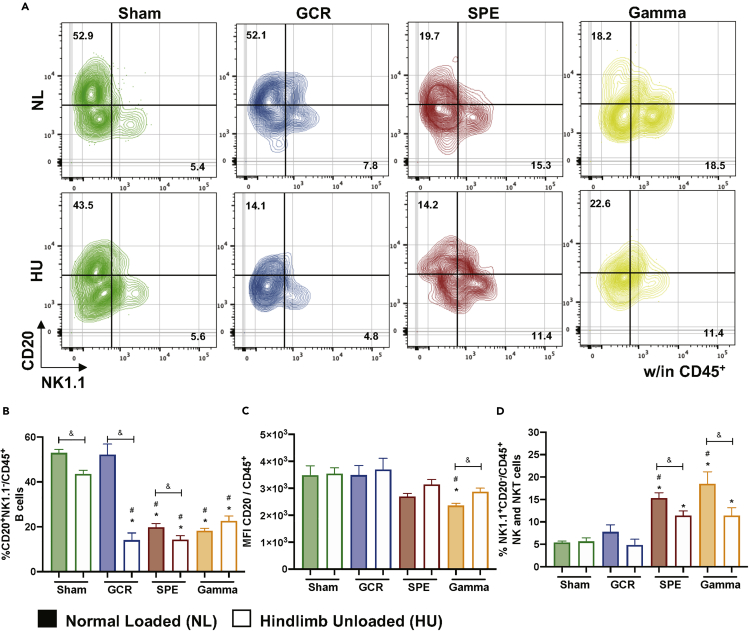
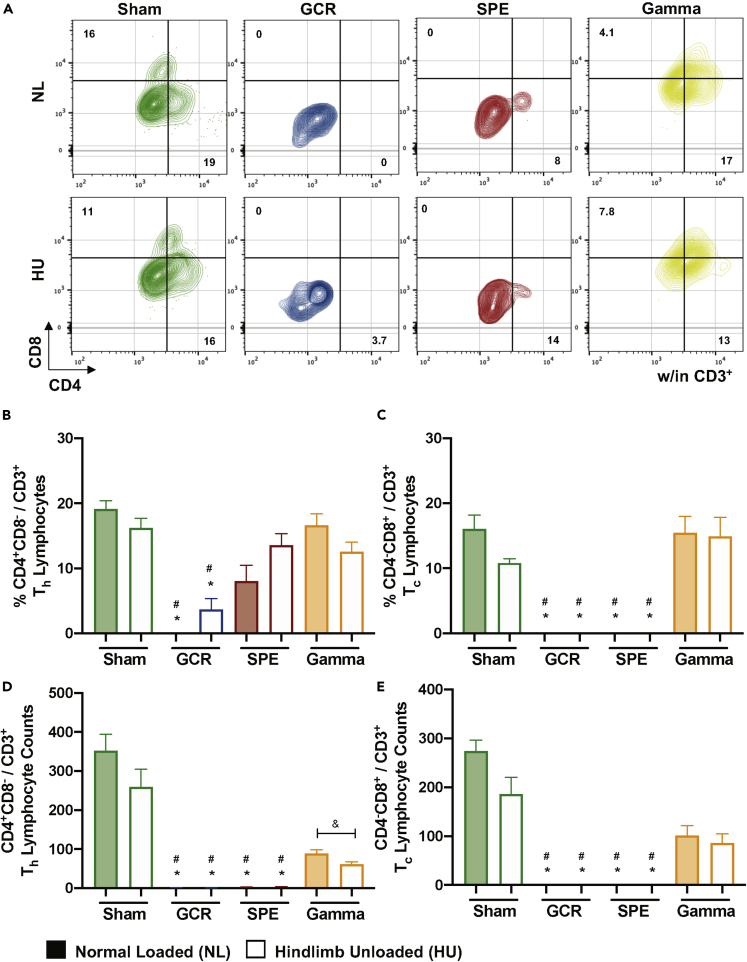
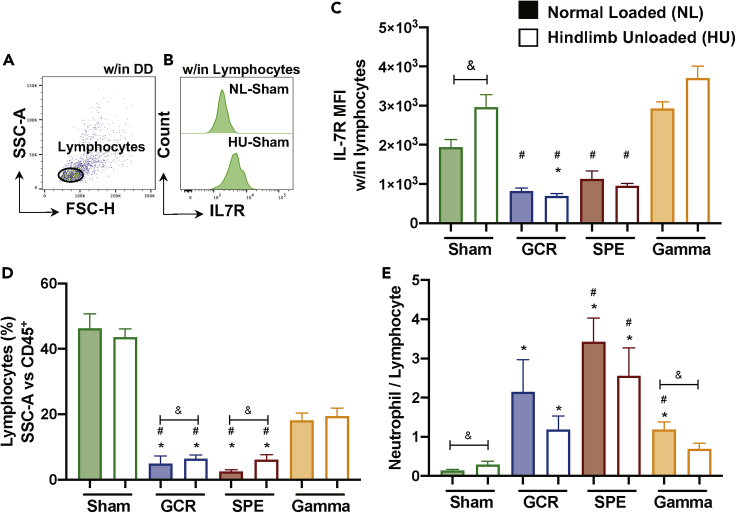
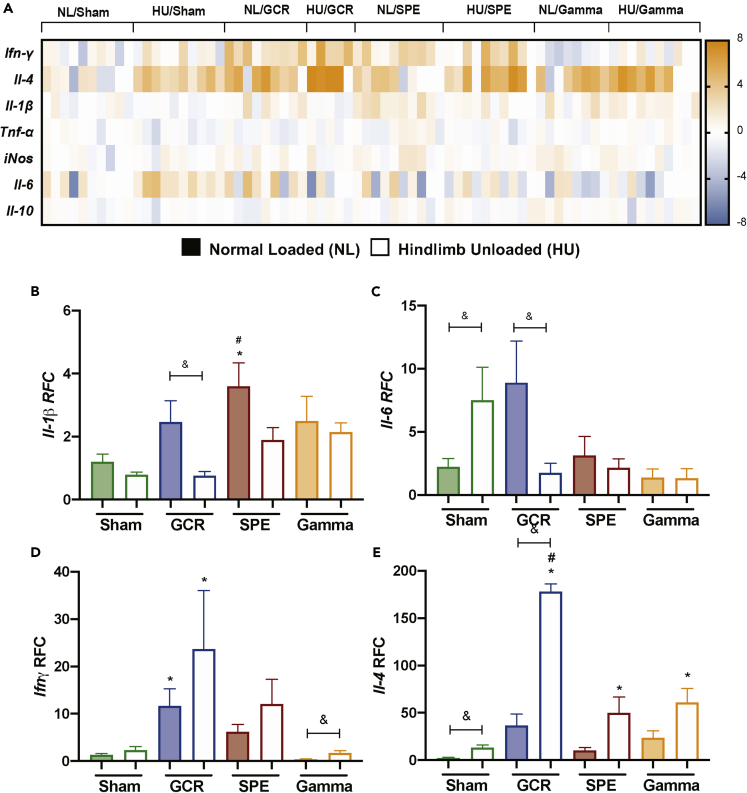
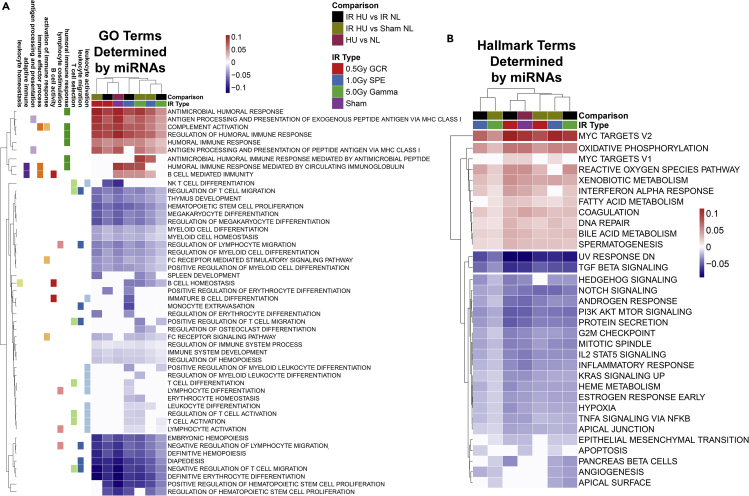
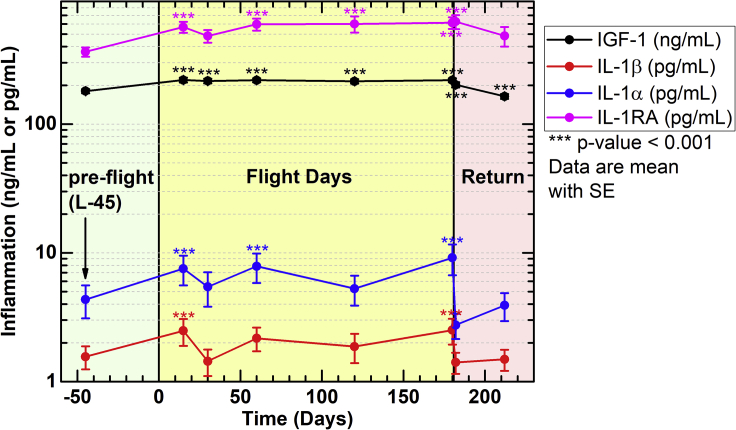
Spaceflight missions can cause immune system dysfunction in astronauts with little understanding of immune outcomes in deep space. This study assessed immune responses in mice following ground-based, simulated deep spaceflight conditions, compared with data from astronauts on International Space Station missions. For ground studies, we simulated microgravity using the hindlimb unloaded mouse model alone or in combination with acute simulated galactic cosmic rays or solar particle events irradiation. Immune profiling results revealed unique immune diversity following each experimental condition, suggesting each stressor results in distinct circulating immune responses, with clear consequences for deep spaceflight. Circulating plasma microRNA sequence analysis revealed involvement in immune system dysregulation. Furthermore, a large astronaut cohort showed elevated inflammation during low-Earth orbit missions, thereby supporting our simulated ground experiments in mice. Herein, circulating immune biomarkers are defined by distinct deep space irradiation types coupled to simulated microgravity and could be targets for future space health initiatives.

Keywords: Immunology; Space Sciences.


Conflict of interest statement

All authors declare no competing interests.

Figures

None
Graphical abstract
Figure 1
Figure 1
Immune Organs and Total Leukocyte Populations Display Disparities following Simulated Deep Space Exposures (A) Experimental plan timeline: 15-week-old female C57BL/6J mice were cage acclimated for 3 days (day −3) before experimental initiation (0). Mice were either normally loaded (NL, shaded) or hindlimb unloaded (HU, not shaded) for 14 days. On day 13 mice were whole body irradiated with Sham (0 Gy, green), galactic cosmic rays (GCR, 0.5 Gy, blue), solar particle events (SPE, 1 Gy, red), or gamma (5 Gy, yellow) irradiation types (formulas described in Methods). 24 h post-irradiation (day 14), mice were euthanized and blood and tissues were collected. Body weights were measured on days −3, 0, 7, and 14. Tissue weights were measured on collection day 14. (B–G) (B) Body weights were measured on days −3, 0, 7, and 14. Immune organ weights of the spleen (C) and the thymus (D) were performed on collection day 14 and normalized to total body weight (g/g). Flow cytometric gating scheme to collect singlets, remove doublets, (“DD” denotes doublet discrimination), and identify CD45+ events (E). Percent (%) (F) and absolute counts (G) of total leukocyte populations (CD45+/all doublet discriminated events, DD) displayed for each exposure group. A Grubbs test was performed on all datasets followed by testing for normal distribution via a Kolmogorov-Smirnov test. If data were normally distributed, a one-way ANOVA Dunnett test was performed to compare NL and HU controls to all groups and a parametric unpaired t test with Welsh's correction was performed to compare between similar irradiation groups. If normality was not passed, both a non-parametric Kruskal-Wallis test with a Dunn's posthoc analysis to compare NL and HU controls with all groups and a non-parametric Mann-Whitney U test comparing between similar irradiation groups were performed. Data in (B) represent a scatterplot. (C and D) Data represent a box-and-whiskers plot with minimum and maximum data points. (F and G) Bar graphs data represent means ± SEM (p < 0.05, n = 8–10 per group). “∗” denotes significant difference between NL-Sham and associated groups, “#” denotes significant difference between HU-Sham and associated groups, and intergroup “brackets with a &” denotes significant difference between each group. Filled circles, boxes, and bars denote normal loaded (NL), and non-filled circles, boxes, and bars denote hindlimb unloaded (HU).
Figure 2
Figure 2
Innate Immune Profiles Reveal Elevated Populations in SPE and Gamma Irradiation that Are Selectively Suppressed in Combination with HU, No Difference in Population with GCR Irradiation ± HU (A–D) (A) Representative flow plots are displayed for percentage CD45+CD11b cells (bottom left box), monocytes (bottom right box), neutrophils (top right box), and eosinophils (between right boxes). Percentage (%) of monocytes (Ly6gCD11b+/CD45+) (B), neutrophils (Ly6ghighCD11b+/CD45+) (C), and eosinophils (Ly6glowCD11b+/CD45+) (D), are displayed within each exposure group. Bar graph data represent means ± SEM (p < 0.05, n = 8–10 per group). Statistical tests and labels are the same as Figure 1.
Figure 3
Figure 3
B and NK/NKT Cells Reveal Differential Population Percentages following Deep Space Exposures (A) Representative flow gating for B and NK/NKT cells percentages. (B) Percentage (%) B cells (CD20+NK1.1-/CD45+) are displayed within total leukocyte populations. (C) Median fluorescence intensity (MFI) of cell surface expression of CD20 on all CD45+ cells. (D) Percent (%) of NK/NKT cells (NK1.1+CD20-/CD45+). Bar graph data represent means ± SEM (p < 0.05, n = 7–10 per group). Statistical tests and labels are the same as Figure 1.
Figure 4
Figure 4
Lymphocyte Immune Profiles Indicate T Cytotoxic and T Helper Effector Cells Are Reduced following GCR and SPE Irradiation (A–E) (A) Representative flow gating for T cytotoxic (Tc) and T helper (Th) cells within CD3+ doublet discriminated events. Percentage (%) and absolute counts of T helper (Th) cells (CD4+CD8-/CD3+) (B and D, respectively) and T cytotoxic (Tc) cells (CD4CD8+/CD3+) (C and E, respectively) are displayed. Bar graph data represent means ± SEM (p < 0.05, n = 7–10 per group). Statistical tests and labels are the same as Figure 1.
Figure 5
Figure 5
Differential Expression of IL-7R Surface Expression and Elevated Neutrophil to Lymphocyte Ratio (NLR) in Simulated Deep Space Exposures (A and B) Representative flow plot (NL-Sham control only) for lymphocytes within all events that have been doublet discriminated (DD) (A) and IL-7R median fluorescent intensity (MFI) histograms (NL- and HU-Sham only) within lymphocytes (B). (C) MFI of IL-7R within lymphocytes is shown. (D) Percentage (%) lymphocytes are displayed (SSC-A versus CD45+), as shown in Figure 1G. (E) Neutrophil to lymphocyte ratio (NLR), a measurement of subclinical Paul et al., 2020 inflammation (Isaac et al., 2016), is shown. (C–E) Bar graph data represent means ± SEM (p < 0.05, n = 6–10 per group). Statistical tests and labels are the same as Figure 1.
Figure 6
Figure 6
Cytokine Profiles Are Distinct following Simulated Deep Space Exposures (A–E) (A) Heatmap-generated log fold change quantitative PCR transcript values for the cytokines Ifn-γ, Il-4, Il-1β, Tnf-ɑ, iNOS, Il-6, and Il-10. Bar charts are shown for cytokines, including Il-1β (B), Il-6 (C), Ifn-ɣ (D), and Il-4 (E) using relative fold change (RFC) and Gapdh as the normalization gene. Figures 6B–6E bar graph data represents means ± SEM (p < 0.05, n = 4–10 per group). Statistical tests and labels are the same as Figure 1.
Figure 7
Figure 7
Gene Ontology (GO) Analyses of miRNA Terms Display Select Exposures Caused Differential Immunogenic Responses GO terms with a false discovery rate <0.05 cutoff were considered significant. Specific immune-related GO terms were mapped to the GO Mouse Genome Informatics (MGI) and were plotted with R packages. Biological and molecular immune pathways engaged following ionizing irradiation exposures, singly or in combination with HU. (A) Heatmap comparison of GO terms determined by expressed miRNAs. (B) Heatmap comparison of Hallmark terms determined by expressed miRNAs.
Figure 8
Figure 8
Elevated Markers of Inflammation in Astronauts on 4- to 6-Month ISS Missions Blood samples were collected at launch minus (L-) 45 days, on Flight Day (FD)15, FD30, FD60, FD120, and FD180; post-flight samples were collected in the first 24 h after landing and again 30 days later . Inflammatory markers were analyzed in plasma for IGF-1, IL-1β, IL-1α, and IL-1RA. Repeated measures analysis of variance was conducted to test for differences during and after flight compared with preflight, and comparisons among time points were made using a Bonferroni t test. Multiple comparisons were accounted for. Data represent means ± SEM (∗∗∗p < 0.001, n = 59 crewmembers; 47 males, 12 females). Subsets of these data have been previously published (Crucian et al., 2014; Smith et al., 2015).

References

    1. Anderson C.A., Boucher G., Lees C.W., Franke A., D'Amato M., Taylor K.D., Lee J.C., Goyette P., Imielinski M., Latiano A. Meta-analysis identifies 29 additional ulcerative colitis risk loci, increasing the number of confirmed associations to 47. Nat. Genet. 2011;43:246–252. - PMC - PubMed
    1. Asensi V., Valle E., Meana A., Fierer J., Celada A., Alvarez V., Paz J., Coto E., Carton J.A., Maradona J.A. In vivo interleukin-6 protects neutrophils from apoptosis in osteomyelitis. Infect Immun. 2004;72:3823–3828. - PMC - PubMed
    1. Bagley J., Tian C., Sachs D.H., Iacomini J. T cells mediate resistance to genetically modified bone marrow in lethally irradiated recipients. Transplantation. 2002;74:1454–1460. - PubMed
    1. Baker J.R., Vuppusetty C., Colley T., Hassibi S., Fenwick P.S., Donnelly L.E., Ito K., Barnes P.J. MicroRNA-570 is a novel regulator of cellular senescence and inflammaging. FASEB J. 2019;33:1605–1616. - PMC - PubMed
    1. Baselet B., Sonveaux P., Baatout S., Aerts A. Pathological effects of ionizing radiation: endothelial activation and dysfunction. Cell. Mol. Life Sci. 2019;76:699–728. - PMC - PubMed

LinkOut - more resources