. 2020 Nov 25;23(12):101771.
doi: 10.1016/j.isci.2020.101771. eCollection 2020 Dec 18.

LET-Dependent Low Dose and Synergistic Inhibition of Human Angiogenesis by Charged Particles: Validation of miRNAs that Drive Inhibition

Affiliations

LET-Dependent Low Dose and Synergistic Inhibition of Human Angiogenesis by Charged Particles: Validation of miRNAs that Drive Inhibition

Yen-Ruh Wuu et al. iScience. .

Abstract

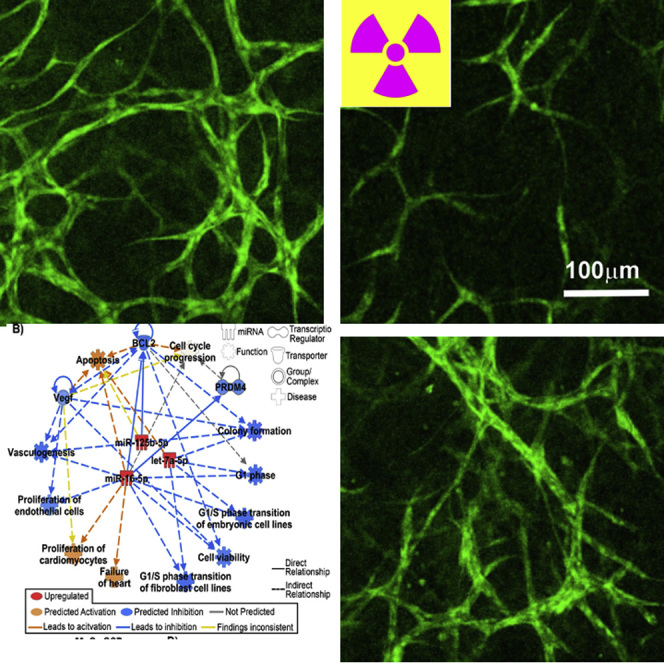
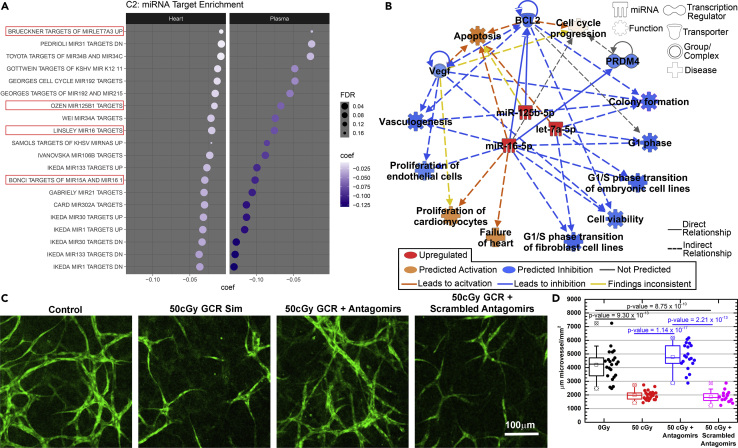
Space radiation inhibits angiogenesis by two mechanisms depending on the linear energy transfer (LET). Using human 3D micro-vessel models, blockage of the early motile stage of angiogenesis was determined to occur after exposure to low LET ions (<3 KeV/AMU), whereas inhibition of the later stages occurs after exposure to high LET ions (>8 KeV/AMU). Strikingly, the combined effect is synergistic, detectible as low as 0.06 Gy making mixed ion space radiation more potent. Candidates for bystander transmission are microRNAs (miRNAs), and analysis on miRNA-seq data from irradiated mice shows that angiogenesis would in theory be downregulated. Further analysis of three previously identified miRNAs showed downregulation of their targets associated with angiogenesis and confirmed their involvement in angiogenesis pathways and increased health risks associated with cardiovascular disease. Finally, synthetic molecules (antagomirs) designed to inhibit the predicted miRNAs were successfully used to reverse the inhibition of angiogenesis.

Keywords: Molecular Biology; Radiation Biology; Space Sciences.


Conflict of interest statement

The authors declare no competing interests.

Figures

None
Graphical abstract
Figure 1
Figure 1
Inhibition of Micro-vessel Development by a Range of Charged Particles and Energies Early developing micro-vessel cultures were exposed to 0.75 Gy of each charged particle and allowed to develop over the next 6 days. Micro-vessels were then fixed stained, and micro-vessel length was determined (Transparent Methods). (A) Average length of micro-vessels per unit area. Cultures without PMA exhibit inhibition of micro-vessel formation after exposure to all ion species and energies. When PMA is added to the cultures, the phenotype after exposure to protons (1 GeV/n and 200 MeV/n) and helium ions (1 GeV/n and 125 MeV/n) is rescued and micro-vessels are formed. For heavier ions – C, O, Si, and 56Fe – PMA does not rescue the phenotype, and micro-vessel formation remains inhibited. (B) Logarithmic LET plot of the data in (A). Inhibition of micro-vessel formation after exposure to charged particles with an LET of 3 KeV/AMU or lower is rescued by PMA. Charged particles with an LET of 8 KeV/AMU or higher remain inhibited in the presence of PMA. Data are represented as mean ± SEM.
Figure 2
Figure 2
Inhibition of Motile Tip Activity by a Range of Charged Particles and Energies Early developing micro-vessel cultures were exposed to 0.75 Gy of each ion particle and fixed 2 hr later followed by immunostaining for tubulin to determine the number of motile tips per cell (Transparent Methods). Low LET but not high LET charged particles cause a significant reduction in the number of motile tips per cell. Phorbol ester added to cultures before exposure to low LET ions restores the motile tip activity. .Data are represented as mean ± SEM. (B) Logarithmic LET plot of the data in (A). Inhibition of motile tip activity occurs after exposure to charged particles with an LET of 3 KeV/n or lower and the phenotype can be rescued by PMA. Charged particles with an LET of 8 KeV/n or higher do not affect motile tip activity. Data are represented as mean ± SEM.
Figure 3a
Figure 3a
History of Micro-vessel Growth One-day-old cultures were exposed to a dose of 0.2 Gy 56Fe ions (1 GeV/n), 0.2 Gy protons (1 GeV/n), and a 1:1 mixture of 0.1 Gy 56Fe ions (1 GeV/n) and 0.1 Gy protons (1 GeV/n). Six days after irradiation, the mature cultures were stained for micro-vessels (red) and immunostained for collagen (green). Unirradiated controls have mostly wide vessels with extensive collagen tunnels surrounding them(9as shown Cultures exposed to 56Fe ions are predominantly thin with very little collagen deposition (arrows). Cultures exposed to protons are wide but short and stunted but with substantial collagen around the short micro-vessels (arrowhead). Exposure to a mixture of each charged particle results in a diverse phenotype. There are pioneer structures (arrow) and widened vessels (arrowhead) albeit with a pointed end. Bar represents 50 μm.
Figure 4
Figure 4
Dose Response for the Inhibition of Angiogenesis by Individual and Mixed Charged Particles (Protons and 56Fe Ions) Early developing cultures (one day after seeding into matrices) were exposed to either protons (1 GeV/n) or 56Fe ions (1 GeV/n) or a 1:1 mixture of each ion (protons delivered first). At maturity, six days after exposure, micro-vessel cultures were fixed, stained, and analyzed. (A) Linear plot of total mature vessel length per 1000 μm2 area. Individual ions each inhibit the formation of micro-vessels by 1500 μm at a dose of 0.05 Gy. A total dose equivalent of equal proportions of mixed ions inhibits the formation of micro-vessels by around 2000 μm at a dose of 0.06 Gy. (B) Logarithmic dose plot of the graph in (A). Individual protons and 56Fe ions show a similar dose response whereby the reduction of micro-vessel length is reduced significantly at a dose of 0.125 Gy (blue and red asterisks, protons p < 0.03, 56Fe ions p < 0.02, respectively). Total dose equivalent of mixed ions has a more than additive effect becoming statistically significant at a dose of 0.03 Gy (purple asterisks, p < 0.05). Alternative x axis scales show the fluence per cell for protons (blue) and for fluence per 1000 cells for 56Fe ions (red). Data are represented as mean ± SEM.
Figure 5
Figure 5
Dose Response for the Inhibition of Angiogenesis by Individual and Mixed Charged Particles (He Ions and Si Ions) Developing cultures were exposed to either He ions (1 GeV/n) or Si ions (600 MeV/n) or a 1:1 mixture of each ion (helium ions delivered first). (A) Logarithmic dose plot of total mature vessel length per 1000 μm2 area. Individual Helium ions and Si ions show dose responses whereby the reduction of micro-vessel length is reduced significantly at a dose of 0.125 Gy helium ions (blue asterisk, p = < 0.001) and 0.25 Gy Si ions (red asterisk p = < 0.002). Total dose equivalent of mixed ions has a more than additive effect becoming statistically significant at a dose of 0.06 Gy (purple asterisks, p < 0.05). Alternative x axis scales show the fluence per cell for helium ions (blue) and for fluence per 1000 cells for Si ions (red). Data are represented as mean ± SEM. (B) Morphologies of control and mixed ions (total dose 0.125 Gy) from the experiment in 5A. Fluorescently stained for all proteins with 5-(4,6-dichlorotriazinyl) aminofluorescein, (5-DTAF). Mixed ion exposure greatly inhibits micro-vessel formation. Bar represents 100 μm.
Figure 6
Figure 6
MicroRNA-Sequencing on Mice Irradiated with GCRSim Demonstrating miRNA Involvement with Angiogenesis during Space Radiation (A) Global miRNA differences occurring in plasma and heart tissue from mice irradiated with GCRsim. Heatmap representation of miRNA-sequence data for the significantly regulated genes with False Discovery Rate (FDR) <0.05 analyzed by analysis of variance (ANOVA) across the samples. (B) Combined and individual t-SNE plots for significantly expressed miRNAs for plasma and heart tissue. (C) Venn diagram of the significantly regulated miRNAs between the different experimental conditions. (D) miRNA fold changes between irradiated (IR) conditions vs sham groups for each GCRsim and gamma. miRNAs from our proposed spaceflight signature are included, as well as the additional common miRNAs for GCRsim between the plasma and heart tissues implicated by miRNA-seq in (C). (E) Gene ontology (GO) and canonical pathway (C2) analysis on miRNA-seq data from GCR irradiation. Pathway analysis for GO and C2 terms (from MSigDB) with an FDR <0.25 cutoff was considered significant. Specific pathways related to microtubules, angiogenesis, apoptosis, and cell cycle were selected and plotted. The coef term represents coefficient determined from the RBiomirGS R package for miRNA pathway analysis. This term, if positive, will indicate an upregulation for the pathway and if negative a downregulation for the pathway based on the miRNA analysis. Specific significantly regulated pathways for angiogenesis, microtubules, cell cycle, and apoptosis were utilized for this analysis. The dot plots are color coded for shades of blue for the degree of downregulation and shades of red for the degree of upregulation. Also, the size of the dots represents the FDR significance, with the larger the dot, the more significant. See also Tables S1 and S2.
Figure 7
Figure 7
Inhibition of Key miRNAs Prevent GCR Damage on Micro-vessels (A) Pathway analysis for the C2 terms related to miRNA enriched targets with an FDR <0.25 cutoff. The coef term represents coefficient determined from the RBiomirGS R package for miRNA pathway analysis. This term if positive will indicate an upregulation for the pathway and if negative a downregulation for the pathway based on the miRNA analysis. Specific significantly regulated pathways for angiogenesis, microtubules, cell cycle, and apoptosis were utilized for this analysis. The dot plots are color coded for shades of blue for the degree of downregulation and shades of red for the degree of upregulation. Also, the size of the dots represents the FDR significance, with the larger the dot, the more significant. The pathways related to miR-16-5p, let-7a-5p, and miR-125b-5p are outlined with red. (B) Pathway analysis for miR-16-5p, let-7a-5p, and miR-125b-5p utilizing ingenuity pathway analysis (IPA). Specific angiogenic, cell cycle, and apoptotic factors were shown. (C and D) Reversal of GCRsim effects in micro-vessels. C. micro-vessel morphology in controls, irradiated, and irradiated with antagomirs and scrambled antagomirs. HUVECs were seeded into the gel matrix and irradiated with 0.5 Gy simGCRsim 24 hr later. Antagomirs (0.5 μm each) were added to cultures at 48 and 72 hr. After full formation of micro-vessels (a total of 7 days culture), micro-vessels were fixed and stained for all proteins with 5-(4,6-dichlorotriazinyl) aminofluorescein (DTAF). D. Analysis of micro-vessels shows that antagomirs have restored the inhibition of angiogenesis by simGCRsim, whereas scrambled antagomirs have not. Data are represented as mean ± SEM. See also Figure S1.

References

    1. Abdel-Qadir H., Ethier J.L., Lee D.S., Thavendiranathan P., Amir E. Cardiovascular toxicity of angiogenesis inhibitors in treatment of malignancy: a systematic review and meta-analysis. Cancer Treat. Rev. 2017;53:120–127. - PubMed
    1. Baselet B., Azimzadeh O., Erbeldinger N., Bakshi M.V., Dettmering T., Janssen A., Ktitareva S., Lowe D.J., Michaux A., Quintens R. Differential impact of single-dose Fe ion and X-Ray irradiation on endothelial cell transcriptomic and proteomic responses. Front. Pharmacol. 2017;8:570. - PMC - PubMed
    1. Beheshti A., Ray S., Fogle H., Berrios D., Costes S.V. A microRNA signature and TGF-beta1 response were identified as the key master regulators for spaceflight response. PLoS One. 2018;13:e0199621. - PMC - PubMed
    1. Beheshti A., Stevenson K., Vanderburg C., Ravi D., McDonald J.T., Christie A.L., Shigemori K., Jester H., Weinstock D.M., Evens A.M. Identification of circulating serum multi-MicroRNA signatures in human DLBCL models. Sci. Rep. 2019;9:17161. - PMC - PubMed
    1. Boerma M., Nelson G.A., Sridharan V., Mao X.W., Koturbash I., Hauer-Jensen M. Space radiation and cardiovascular disease risk. World J. Cardiol. 2015;7:882–888. - PMC - PubMed

LinkOut - more resources