. 2020 Oct 17;2(2):fcaa125.
doi: 10.1093/braincomms/fcaa125. eCollection 2020.

Establishing two principal dimensions of cognitive variation in logopenic progressive aphasia

Affiliations

Establishing two principal dimensions of cognitive variation in logopenic progressive aphasia

Siddharth Ramanan et al. Brain Commun. .

Abstract

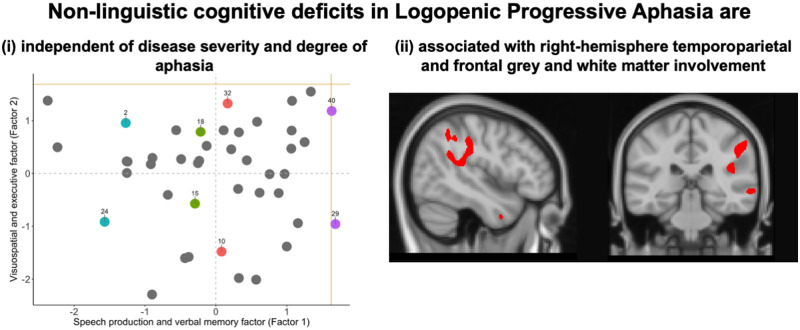
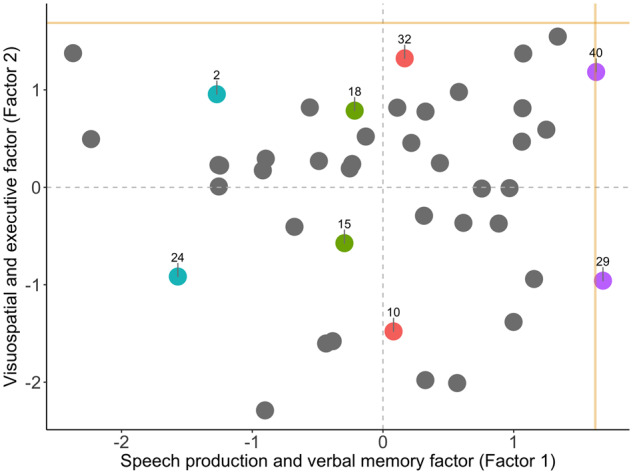
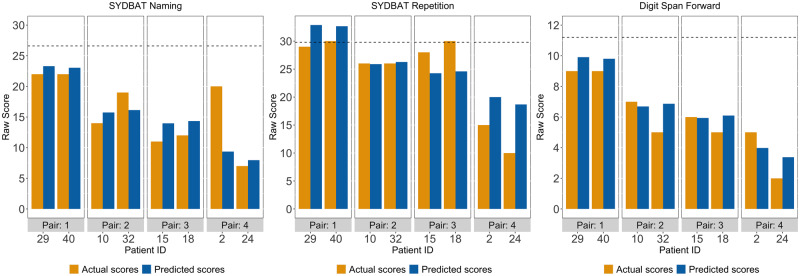
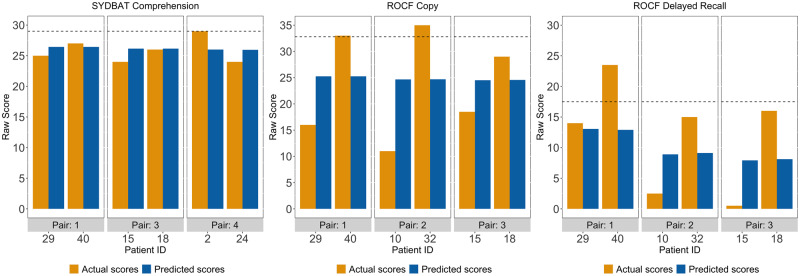
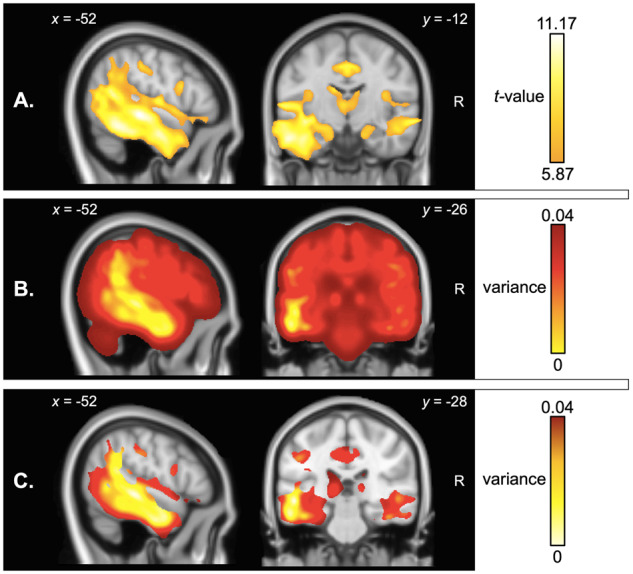
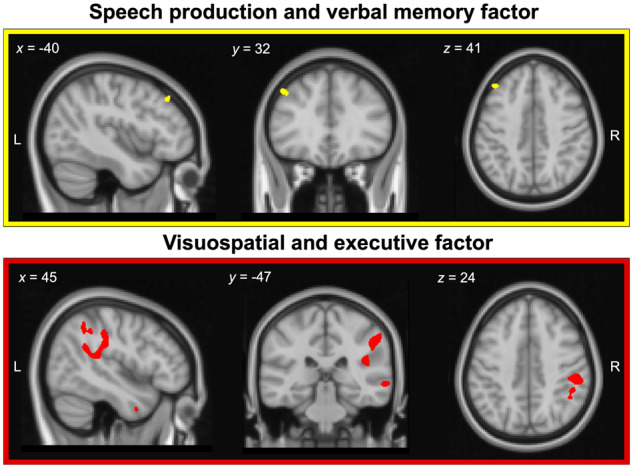
Logopenic progressive aphasia is a neurodegenerative syndrome characterized by sentence repetition and naming difficulties arising from left-lateralized temporoparietal atrophy. Clinical descriptions of logopenic progressive aphasia largely concentrate on profiling language deficits, however, accumulating evidence points to the presence of cognitive deficits even on tasks with minimal language demands. Although non-linguistic cognitive deficits in logopenic progressive aphasia are thought to scale with disease severity, patients at discrete stages of language dysfunction display overlapping cognitive profiles, suggesting individual-level variation in cognitive performance, independent of primary language dysfunction. To address this issue, we used principal component analysis to decompose the individual-level variation in cognitive performance in 43 well-characterized logopenic progressive aphasia patients who underwent multi-domain neuropsychological assessments and structural neuroimaging. The principal component analysis solution revealed the presence of two, statistically independent factors, providing stable and clinically intuitive explanations for the majority of variance in cognitive performance in the syndrome. Factor 1 reflected 'speech production and verbal memory' deficits which typify logopenic progressive aphasia. Systematic variations were also confirmed on a second, orthogonal factor mainly comprising visuospatial and executive processes. Adopting a case-comparison approach, we further demonstrate that pairs of patients with comparable Factor 1 scores, regardless of their severity, diverge considerably on visuo-executive test performance, underscoring the inter-individual variability in cognitive profiles in comparably 'logopenic' patients. Whole-brain voxel-based morphometry analyses revealed that speech production and verbal memory factor scores correlated with left middle frontal gyrus, while visuospatial and executive factor scores were associated with grey matter intensity of right-lateralized temporoparietal, middle frontal regions and their underlying white matter connectivity. Importantly, logopenic progressive aphasia patients with poorer visuospatial and executive factor scores demonstrated greater right-lateralized temporoparietal and frontal atrophy. Our findings demonstrate the inherent variation in cognitive performance at an individual- and group-level in logopenic progressive aphasia, suggesting the presence of a genuine co-occurring cognitive impairment that is statistically independent of language function and disease severity.

Keywords: executive functioning; language; primary progressive aphasia; principal component analysis; visuospatial functioning.


Figures

Graphical Abstract
Graphical Abstract
Figure 1
Figure 1
PCA results. Factor scores of LPA patients on the speech production and verbal memory factor (i.e. Factor 1) and visuospatial and executive factor (i.e. Factor 2) emerging from the varimax-rotated PCA. Coloured data points indicate individual patients who were examined in pairwise fashion in subsequent statistical analyses, with matching colours denoting patient pairs of interest. Gold lines indicate lower bound of normality (−1.96 standard error from the mean) as estimated from the Control group (calculation detailed in Supplementary material). LPA = logopenic progressive aphasia.
Figure 2
Figure 2
Predicted and actual scores for LPA patient pairs on three example tests loading on the speech production and verbal memory factor (i.e. Factor 1) from the varimax-rotated PCA. Dotted lines for each test indicate actual Control mean. LPA = logopenic progressive aphasia; SYDBAT = Sydney Language Battery.
Figure 3
Figure 3
Predicted and actual scores for LPA patient pairs on three example tests loading on visuospatial and executive factor (i.e. Factor 2) from the varimax-rotated PCA. Only three pairs presented as one patient from one of the excluded pairs was missing data on the SYDBAT Comprehension or the ROCF measures. Dotted lines for each test indicate actual Control mean. LPA = logopenic progressive aphasia; ROCF = Rey-Osterrieth Complex Figure; SYDBAT = Sydney Language Battery.
Figure 4
Figure 4
VBM analyses of whole-brain atrophy. Panels indicate (A) regions of significant grey and white matter intensity reduction in LPA compared to Controls, (B) voxel-wise variance in grey and white matter intensity in LPA compared to Controls and (C) voxel-wise variance in regions of peak atrophy (computed within a mask of regions emerging from the atrophy analysis in A. Coloured voxels in A indicate regions that emerged significant in the VBM analyses at P < 0.01 corrected for Family-Wise Error with a cluster threshold of 100 contiguous voxels. Age and total intracranial volume were included as covariates in all analyses. Clusters are overlaid on the MNI standard brain with x and y co-ordinates reported in MNI standard space. LPA = logopenic progressive aphasia; R = right.
Figure 5
Figure 5
Regions of grey and white matter intensity that uniquely correlate with factor scores on the speech production and verbal memory factor (i.e. Factor 1; upper panel) and visuospatial and executive factor (i.e. Factor 2; lower panel) in LPA patients. Both factors were derived from varimax-rotated PCA of neuropsychological test performance in the LPA group. Coloured voxels indicate regions that emerged significant in the VBM analyses at a threshold of P < 0.001 uncorrected for multiple comparisons with a cluster threshold of 100 contiguous voxels. All clusters reported at t =4.09 for speech production and verbal memory factor and t 3.6 for visuospatial and executive factor. Age and total intracranial volume were included as covariates in the analyses. Clusters are overlaid on the MNI standard brain with x, y and z co-ordinates reported in MNI standard space. L = left; LPA = logopenic progressive aphasia; PCA = principal component analysis; R = right.

Similar articles

Cited by

References

    1. Abrahams S, Goldstein LH, Simmons A, Brammer MJ, Williams SC, Giampietro VP, et al. Functional magnetic resonance imaging of verbal fluency and confrontation naming using compressed image acquisition to permit overt responses. Hum Brain Mapp 2003; 20: 29–40. - PMC - PubMed
    1. Aron AR, Robbins TW, Poldrack RA. Inhibition and the right inferior frontal cortex. Trends Cogn Sci 2004; 8: 170–7. - PubMed
    1. Benjamini Y, Hochberg Y. Controlling the false discovery rate - a practical and powerful approach to multiple testing. J R Stat Soc B 1995; 57: 289–300.
    1. Bergeron D, Gorno-Tempini ML, Rabinovici GD, Santos-Santos MA, Seeley W, Miller BL, et al. Prevalence of amyloid-beta pathology in distinct variants of primary progressive aphasia. Ann Neurol 2018; 84: 729–40. - PMC - PubMed
    1. Brambati SM, Amici S, Racine CA, Neuhaus J, Miller Z, Ogar J, et al. Longitudinal gray matter contraction in three variants of primary progressive aphasia: a tenser-based morphometry study. Neuroimage Clin 2015; 8: 345–55. - PMC - PubMed

LinkOut - more resources