

Delta-gamma phase-amplitude coupling as a biomarker of postictal generalized EEG suppression
- PMID: 33376988
- PMCID: PMC7750942
- DOI: 10.1093/braincomms/fcaa182
Delta-gamma phase-amplitude coupling as a biomarker of postictal generalized EEG suppression
Abstract
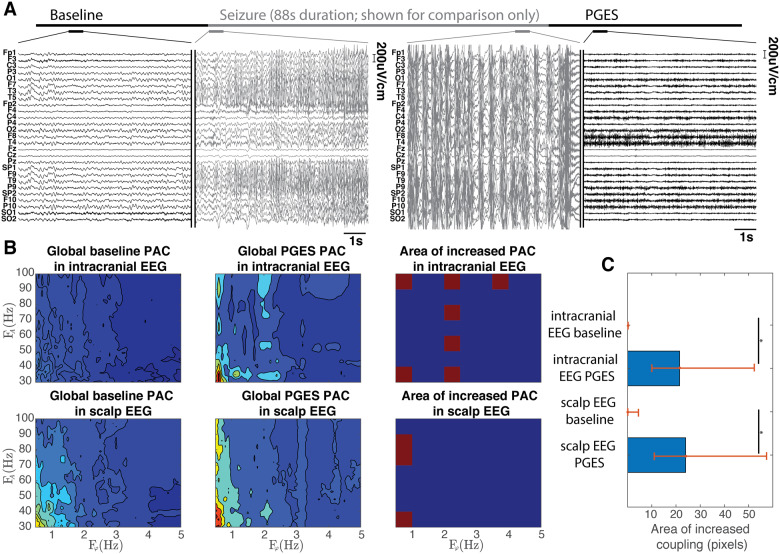
Postictal generalized EEG suppression is the state of suppression of electrical activity at the end of a seizure. Prolongation of this state has been associated with increased risk of sudden unexpected death in epilepsy, making characterization of underlying electrical rhythmic activity during postictal suppression an important step in improving epilepsy treatment. Phase-amplitude coupling in EEG reflects cognitive coding within brain networks and some of those codes highlight epileptic activity; therefore, we hypothesized that there are distinct phase-amplitude coupling features in the postictal suppression state that can provide an improved estimate of this state in the context of patient risk for sudden unexpected death in epilepsy. We used both intracranial and scalp EEG data from eleven patients (six male, five female; age range 21-41 years) containing 25 seizures, to identify frequency dynamics, both in the ictal and postictal EEG suppression states. Cross-frequency coupling analysis identified that during seizures there was a gradual decrease of phase frequency in the coupling between delta (0.5-4 Hz) and gamma (30+ Hz), which was followed by an increased coupling between the phase of 0.5-1.5 Hz signal and amplitude of 30-50 Hz signal in the postictal state as compared to the pre-seizure baseline. This marker was consistent across patients. Then, using these postictal-specific features, an unsupervised state classifier-a hidden Markov model-was able to reliably classify four distinct states of seizure episodes, including a postictal suppression state. Furthermore, a connectome analysis of the postictal suppression states showed increased information flow within the network during postictal suppression states as compared to the pre-seizure baseline, suggesting enhanced network communication. When the same tools were applied to the EEG of an epilepsy patient who died unexpectedly, ictal coupling dynamics disappeared and postictal phase-amplitude coupling remained constant throughout. Overall, our findings suggest that there are active postictal networks, as defined through coupling dynamics that can be used to objectively classify the postictal suppression state; furthermore, in a case study of sudden unexpected death in epilepsy, the network does not show ictal-like phase-amplitude coupling features despite the presence of convulsive seizures, and instead demonstrates activity similar to postictal. The postictal suppression state is a period of elevated network activity as compared to the baseline activity which can provide key insights into the epileptic pathology.
Keywords: PGES; SUDEP; epilepsy; phase-amplitude coupling; seizure.
© The Author(s) (2020). Published by Oxford University Press on behalf of the Guarantors of Brain.
Figures


Similar articles
-
Ictal Symmetric Tonic Extension Posturing and Postictal Generalized EEG Suppression Arising From Sleep in Children With Epilepsy.Pediatr Neurol. 2017 Nov;76:54-59. doi: 10.1016/j.pediatrneurol.2017.06.018. Epub 2017 Jul 4. Pediatr Neurol. 2017. PMID: 28967460
-
Phase-Amplitude Coupling Features Accurately Classify Multiple Sub-States Within a Seizure Episode.Annu Int Conf IEEE Eng Med Biol Soc. 2021 Nov;2021:220-223. doi: 10.1109/EMBC46164.2021.9629988. Annu Int Conf IEEE Eng Med Biol Soc. 2021. PMID: 34891276
-
Dynamics of convulsive seizure termination and postictal generalized EEG suppression.Brain. 2017 Mar 1;140(3):655-668. doi: 10.1093/brain/aww322. Brain. 2017. PMID: 28073789 Free PMC article.
-
Postictal generalized EEG suppression and postictal immobility: what do we know?Epileptic Disord. 2020 Jun 1;22(3):245-251. doi: 10.1684/epd.2020.1158. Epileptic Disord. 2020. PMID: 32540795 Review.
-
Cardiac arrhythmias during or after epileptic seizures.J Neurol Neurosurg Psychiatry. 2016 Jan;87(1):69-74. doi: 10.1136/jnnp-2015-310559. Epub 2015 Jun 2. J Neurol Neurosurg Psychiatry. 2016. PMID: 26038597 Free PMC article. Review.
Cited by
-
A Peri-Ictal EEG-Based Biomarker for Sudden Unexpected Death in Epilepsy (SUDEP) Derived From Brain Network Analysis.Front Netw Physiol. 2022 Apr 26;2:866540. doi: 10.3389/fnetp.2022.866540. eCollection 2022. Front Netw Physiol. 2022. PMID: 36926093 Free PMC article.
-
High-Gamma Activity Is Coupled to Low-Gamma Oscillations in Precentral Cortices and Modulates with Movement and Speech.eNeuro. 2024 Feb 14;11(2):ENEURO.0163-23.2023. doi: 10.1523/ENEURO.0163-23.2023. Print 2024 Feb. eNeuro. 2024. PMID: 38242691 Free PMC article.
-
Recent Developments in Diagnosis of Epilepsy: Scope of MicroRNA and Technological Advancements.Biology (Basel). 2021 Oct 25;10(11):1097. doi: 10.3390/biology10111097. Biology (Basel). 2021. PMID: 34827090 Free PMC article. Review.
-
A Review of EEG-based Localization of Epileptic Seizure Foci: Common Points with Multimodal Fusion of Brain Data.J Med Signals Sens. 2024 Jul 25;14:19. doi: 10.4103/jmss.jmss_11_24. eCollection 2024. J Med Signals Sens. 2024. PMID: 39234592 Free PMC article. Review.
-
Focal seizures are organized by feedback between neural activity and ion concentration changes.Elife. 2022 Aug 2;11:e68541. doi: 10.7554/eLife.68541. Elife. 2022. PMID: 35916367 Free PMC article.
References
-
- Amiri M, Frauscher B, Gotman J. Interictal coupling of HFOs and slow oscillations predicts the seizure‐onset pattern in mesiotemporal lobe epilepsy. Epilepsia 2019; 60: 1160–70. - PubMed
-
- Astolfi L, Cincotti F, Mattia D, Fallani FD, Tocci A, Colosimo A, et al. Tracking the time-varying cortical connectivity patterns by adaptive multivariate estimators. IEEE Trans Biomed Eng 2008; 55: 902–13. - PubMed
-
- van Beurden AW, Petkov GH, Kalitzin SN, Remote-sensor automated system for SUDEP (sudden unexplained death in epilepsy) forecast and alerting: analytic concepts and support from clinical data. In: Proceedings of the 2nd International Conference on Applications of Intelligent Systems - APPIS ’19. Las Palmas de Gran Canaria, Spain: ACM Press; 2019. p. 1–6
-
- Brázdil M, Pail M, Halámek J, Plešinger F, Cimbálník J, Roman R, et al. Very high-frequency oscillations: novel biomarkers of the epileptogenic zone: VHF oscillations in epilepsy. Ann Neurol 2017; 82: 299–310. - PubMed
LinkOut - more resources
Full Text Sources