. 2020 Dec 22;1(9):100160.
doi: 10.1016/j.xcrm.2020.100160.

Modulation of Immune Checkpoints by Chemotherapy in Human Colorectal Liver Metastases

Affiliations

Modulation of Immune Checkpoints by Chemotherapy in Human Colorectal Liver Metastases

Neda Jabbari et al. Cell Rep Med. .

Abstract

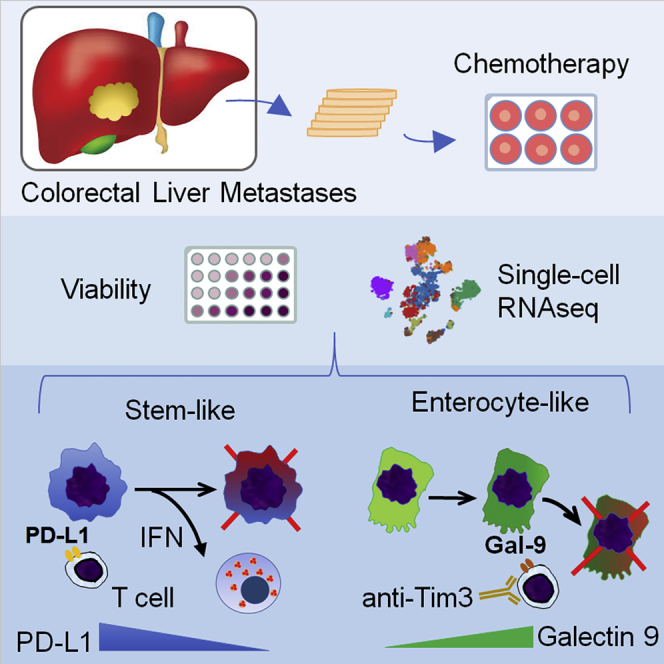
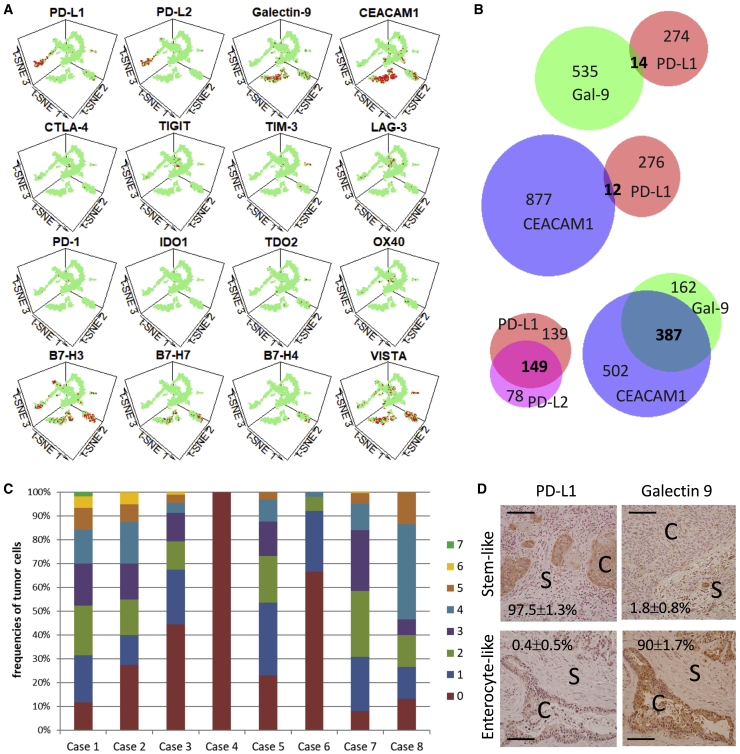
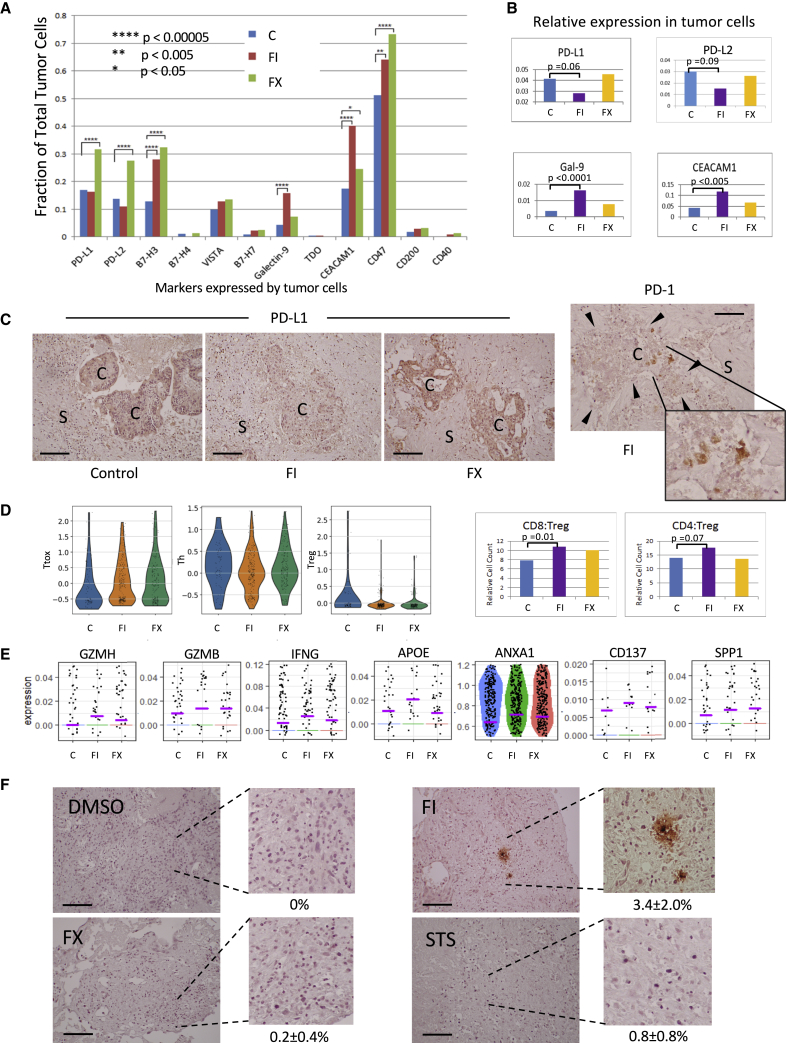
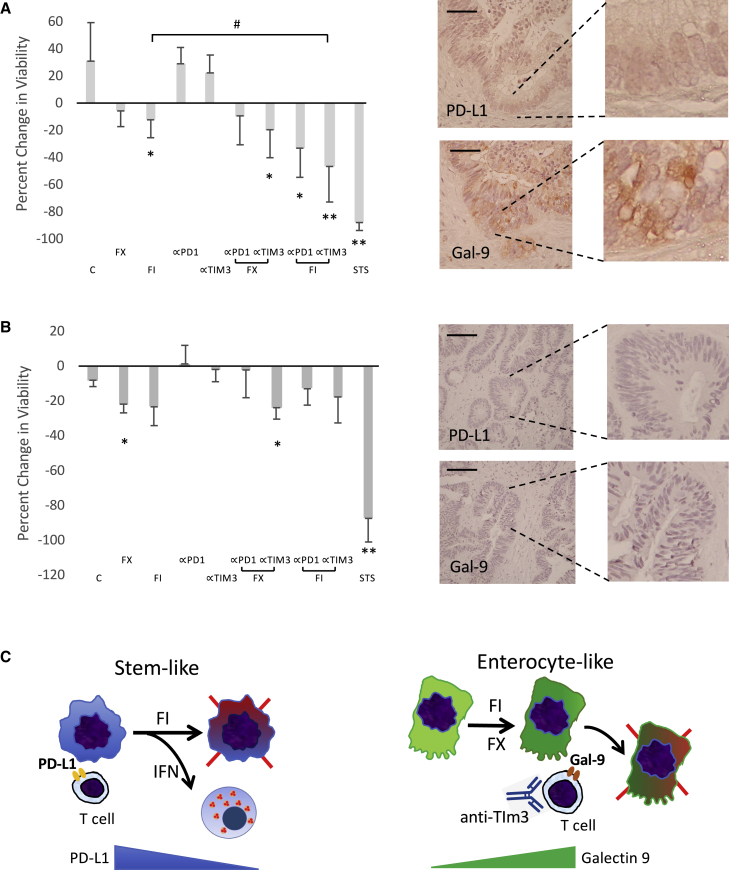
Metastatic colorectal cancer (CRC) is a major cause of cancer-related death, and incidence is rising in younger populations (younger than 50 years). Current chemotherapies can achieve response rates above 50%, but immunotherapies have limited value for patients with microsatellite-stable (MSS) cancers. The present study investigates the impact of chemotherapy on the tumor immune microenvironment. We treat human liver metastases slices with 5-fluorouracil (5-FU) plus either irinotecan or oxaliplatin, then perform single-cell transcriptome analyses. Results from eight cases reveal two cellular subtypes with divergent responses to chemotherapy. Susceptible tumors are characterized by a stemness signature, an activated interferon pathway, and suppression of PD-1 ligands in response to 5-FU+irinotecan. Conversely, immune checkpoint TIM-3 ligands are maintained or upregulated by chemotherapy in CRC with an enterocyte-like signature, and combining chemotherapy with TIM-3 blockade leads to synergistic tumor killing. Our analyses highlight chemomodulation of the immune microenvironment and provide a framework for combined chemo-immunotherapies.

Keywords: PD-L1; TIM3; chemotherapy; colorectal cancer; galectin-9; immune microenvironment; liver metastases; organotypic culture; single-cell analysis; single-cell transcriptome.


Conflict of interest statement

The authors report no competing interests.

Figures

None
Graphical abstract
Figure 1
Figure 1
Correlation between In Vitro and Clinical Responses (A) Human CRLM slices from 5 tumors were treated with 5-FU/oxaliplatin (FX) and 5-FU/irinotecan (FI) for 72 h, and viability was assessed using an MTS assay. Results represent the percentage of change in MTS absorbance (mean ± SD) between time 0 and 72 h. A minimum of 3 tumor slices were used in each treatment. C, vehicle control; STS, staurosporine as positive control. ∗p < 0.05 and ∗∗p < 0.005 compared to control based on pairwise comparison (Student’s t test). (B) Corresponding clinical characteristics of the cases shown in (A). CEA, carcinoembryonic antigen; LAR, low-anterior resection; mut, mutant; NED, no evidence of disease; wt, wild type. (C) Coronal contrast CT images of case D showing divergent tumor response to FOLFIRI in 2 liver metastases. Tumor 1 responded to chemotherapy while tumor 2 progressed. (D) H&E staining of the 2 tumors in case D. The blue (basophilic) cells highlight areas of viable tumors. Original magnification 100×. Scale bar, 200 μm. (E) Temporal gene expression of 3 proliferation markers from bulk RNA-seq analyses of tumor slices derived from tumors D1 (left column) and D2 (right column) at 0, 24, 48, 72, and 96 h. The y axis represents fold change in transcript levels relative to day 0. Three tumor slices independent of the ones used in (A) from each time point were used for RNA extraction. BIRC5, baculoviral IAP repeat containing 5; MKI67, marker of proliferation Ki-67; TOP2A, DNA topoisomerase II alpha.
Figure 2
Figure 2
Single-Cell RNA-Seq Analyses of Tumor Slices from 8 MSS CRLM (A) K-means clustering identifies 7 categories of cells from a total of 7,580 cells derived from all 8 cases in all treatment groups. Three tumor slices were used for single-cell dissociation in each treatment group for each of the 8 cases. The inferred cell type is shown in color on a t-SNE projection. (B) Representative marker gene expressions are shown for cell clusters 2–7. (C and D) Heatmaps showing cell types based on mRNA expression of selected genes (C) and cell surface markers (D). (E) Stem-like cluster 5 is further divided into 2 subtypes, 5.1 and 5.2, with GSEA showing distinct differences in pathway utilization. (F) Uniform manifold approximation and projection for dimension reduction (UMAP) plot of clusters 5.1 and 5.2 highlighting cells in G1, G2/M, and S phases of the cell cycle based on their transcript expression. (G) RNA velocities overlaid on UMAP of cluster 5 showing the trajectories of clusters 5.2 (less proliferative) and 5.1 (higher proliferative) cells.
Figure 3
Figure 3
Response of CRLM Cell Compartments to Chemotherapies (A) Number of cells in individual clusters with respect to total cell count for each treatment group (control, FI, FX) is depicted for cluster 5 (left panels), and cluster 2 (right panels). Cluster 5 is further divided into 5.1 and 5.2, and the relative cell counts in each treatment group are shown in the histograms. p values represent comparisons between indicated treatment groups based on relative cell count. ∗p < 0.004 compared to control. (B) Effects of chemotherapy on relative cell count (mean ± SD) of cluster 6 (fibroblasts), cluster 4 (liver-like), cluster 3 (lymphocytes), and cluster 7 (macrophages). Gene expressions of IL-10 and IL-6 in cluster 7 are also shown. ∗p < 0.05; ∗∗p < 0.001 compared to control. (C) GO term analysis (cell proliferation) of clusters 6, 4, 5.1, and 2 following treatments. The y axis represents the p values (log10) when comparing FI or FX to control treatment for the respective cell clusters. Note that only FI-treated cluster 5.1 showed a p < 0.01 compared with control. (D) Pathway analyses of cluster 5.1 highlight contrasting differences in interferon (IFN) response genes following exposure to FI versus FX. The changes in the IFN pathways to chemotherapies in cluster 2 are shown on the right. Histograms of representative markers (IFI6, ISG15) are shown below.
Figure 4
Figure 4
Expression of Immune Markers in CRLM Cells (A) Expression of immune co-inhibitory genes in different cell clusters highlighted in red. (B) Venn diagrams illustrating the extent of co-expression of PD-1 ligands (PD-L1, PD-L2) and TIM-3 ligands (galectin-9, CEACAM1) in cancer cells from the 8 CRLM samples. Numbers indicate the cell number in each category; those in bold indicate co-expression. (C) Frequencies of tumor cells expressing 0–7 T cell co-inhibitory genes in the 8 cases of CRLM examined. The number of genes (0–7) expressed in any 1 cancer are indicated by the color code. The 12 T cell co-inhibitory genes examined include PD-L1, PD-L2, B7-H3, B7-H4, VISTA, B7-H7, galectin-9, TDO, CEACAM1, CD47, CD200, and CD40. (D) PD-L1 and galectin-9 expression by immunohistochemistry (IHC) analyses in 2 cases of CRLM: stem-like (top, case 5) and enterocyte-like (bottom, case 2). Cancer and stromal cells are marked with “C” and “S,” respectively. Original magnification 200×. Scale bar, 100 μm. The percentage of + tumor cells per high-power field are shown (means ± SDs) based on a minimum of 100 tumor cells.
Figure 5
Figure 5
Effects of Chemotherapy on Immune Checkpoints and Tumor Response (A) Fraction of total tumor cells expressing the indicated immune markers is tabulated according to treatments. (B) Relative expression for PD-L1, PD-L2, Gal-9, and CEACAM1 in cancer cells following drug treatment. (C) Protein expression by IHC of PD-L1 (3 left panels) and PD-1 (right panel with enlargement) following exposure to chemotherapy (FI, FX) versus control was semi-quantified as 0 (no expression), 1+ (weak), 2+ (moderate), and 3+ (strong). Expression levels of PD-L1 in tumor cells (C) relative to stroma (S) are as follows: control group: 2+:0+; FI group: 0–1+:0+; FX group: 3+:0–1+. Original magnification 200×. Scale bar, 100 μm. Arrowheads denote the boundary of the cancer cell cluster. Data represent case 5. (D) Treatment with FI and FX is associated with an expansion in cytotoxic T cells. Left 3 panels represent single-cell histograms of the T cell markers used to group the T cells into cytotoxic (Ttox), helper (Th), and regulatory (Treg) according to treatments. The corresponding CD8+:Treg and CD4+:Treg ratios are shown in the right panels. (E) Expression of activation markers following chemotherapy: FI, FX, compared to control, C. (F) Granzyme B IHC after in vitro treatment of CRLM slices from case 5. Controls: DMSO and STS, staurosporine. Original magnification: 100×. Scale bar, 100 μm. Average percentages (means ± SDs) of + cells per high power field (hpf) are indicated, with a minimum of 10 hpf counted per treatment.
Figure 6
Figure 6
Chemomodulation of Immune Susceptibility (A and B) Response of (A) a PD-L1-;Gal9+ CRLM and (B) a PD-L1;Gal9 CRLM to combination chemo-immunotherapies. Tumor slices (n = 3 per group) were treated with indicated drugs for 72 h, and the percentage of change in MTS absorbance (mean ± SD) was tabulated. Baseline expression of PD-L1 and galectin-9 was determined by IHC (right panels, original magnification 200×, scale bar, 100 μm). STS, staurosporine (positive control). (C) DMSO negative control; α-PD1 and α-TIM3 represent blocking antibodies targeting the respective immune checkpoints. ∗p < 0.5 and ∗∗p < 0.001 compared to control, C. #p < 0.05. Clinical features of these 2 cases are shown in Figure S6D. (C) Models of the effects of chemotherapy in the 2 types of CRLM. Left panel: CRLM with stem-like features expresses PD-1 ligands to evade immune surveillance. FI induces an IFN response along with the suppression of PD-L1 to enhance anti-tumor immune response. Right panel: CRLM with enterocyte-like phenotype expresses TIM-3 ligands, which is further augmented (by FI) or maintained (by FX) with chemotherapy to enforce immune evasion; this is reversible by α-TIM3 blocking antibodies to enhance anti-tumor effects.

References

    1. Global Burden of Disease Cancer Collaboration. Fitzmaurice C., Allen C., Barber R.M., Barregard L., Bhutta Z.A., Brenner H., Dicker D.J., Chimed-Orchir O., Dandona R. Global, Regional, and National Cancer Incidence, Mortality, Years of Life Lost, Years Lived With Disability, and Disability-Adjusted Life-years for 32 Cancer Groups, 1990 to 2015: A Systematic Analysis for the Global Burden of Disease Study. JAMA Oncol. 2017;3:524–548. - PMC - PubMed
    1. Stoffel E.M., Murphy C.C. Epidemiology and Mechanisms of the Increasing Incidence of Colon and Rectal Cancers in Young Adults. Gastroenterology. 2020;158:341–353. - PMC - PubMed
    1. Kow A.W.C. Hepatic metastasis from colorectal cancer. J. Gastrointest. Oncol. 2019;10:1274–1298. - PMC - PubMed
    1. Even Storli P., Johnsen G., Juel I.S., Grønbech J.E., Bringeland E.A. Impact of increased resection rates and a liver parenchyma sparing strategy on long-term survival after surgery for colorectal liver metastases. A population-based study. Scand. J. Gastroenterol. 2019;54:890–898. - PubMed
    1. Tomasello G., Petrelli F., Ghidini M., Russo A., Passalacqua R., Barni S. FOLFOXIRI Plus Bevacizumab as Conversion Therapy for Patients With Initially Unresectable Metastatic Colorectal Cancer: A Systematic Review and Pooled Analysis. JAMA Oncol. 2017;3:e170278. - PMC - PubMed

Publication types

MeSH terms