. 2020 Dec 22;1(9):100161.
doi: 10.1016/j.xcrm.2020.100161.

An Automated Organoid Platform with Inter-organoid Homogeneity and Inter-patient Heterogeneity

Affiliations

An Automated Organoid Platform with Inter-organoid Homogeneity and Inter-patient Heterogeneity

Shengwei Jiang et al. Cell Rep Med. .

Abstract

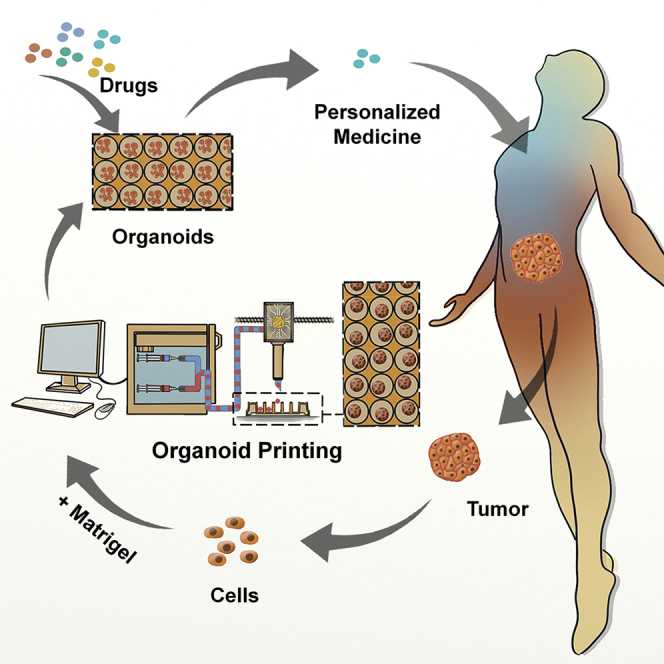
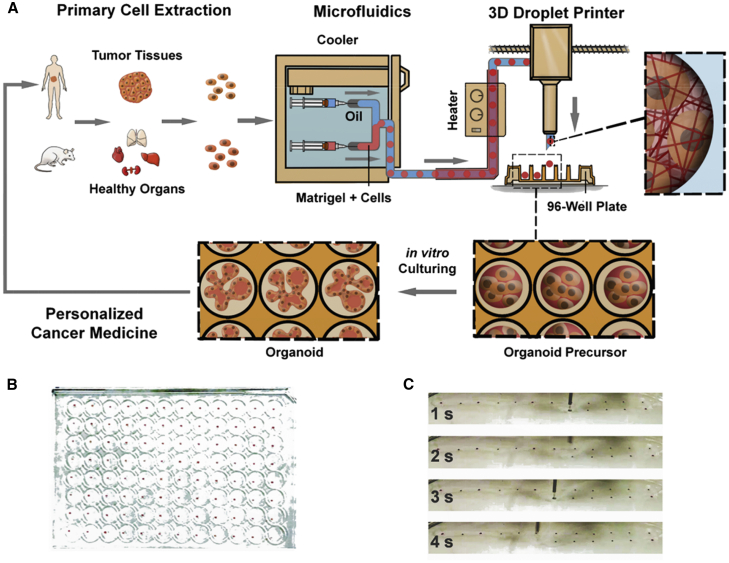
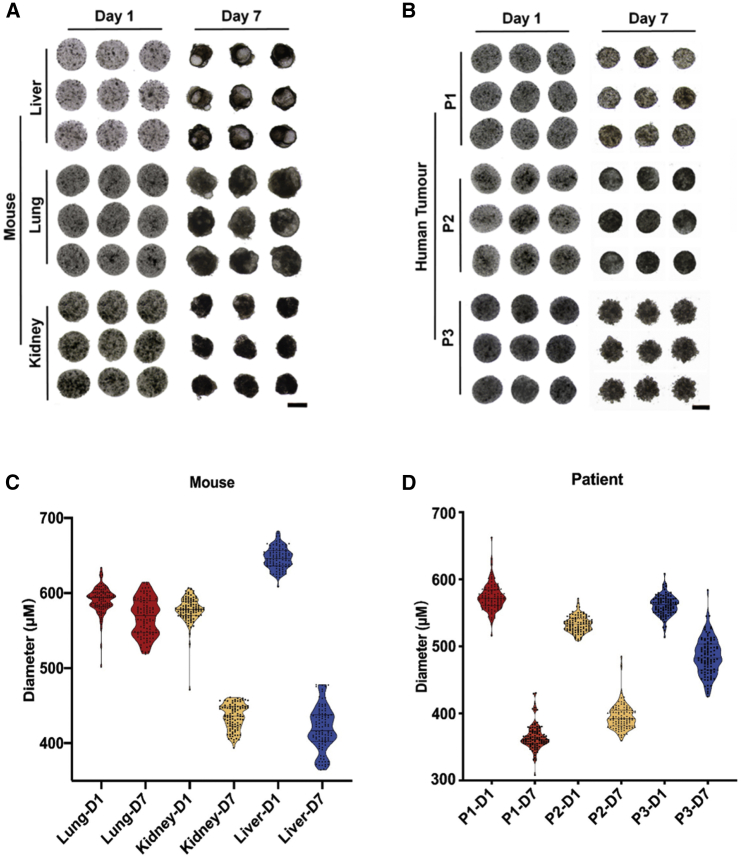
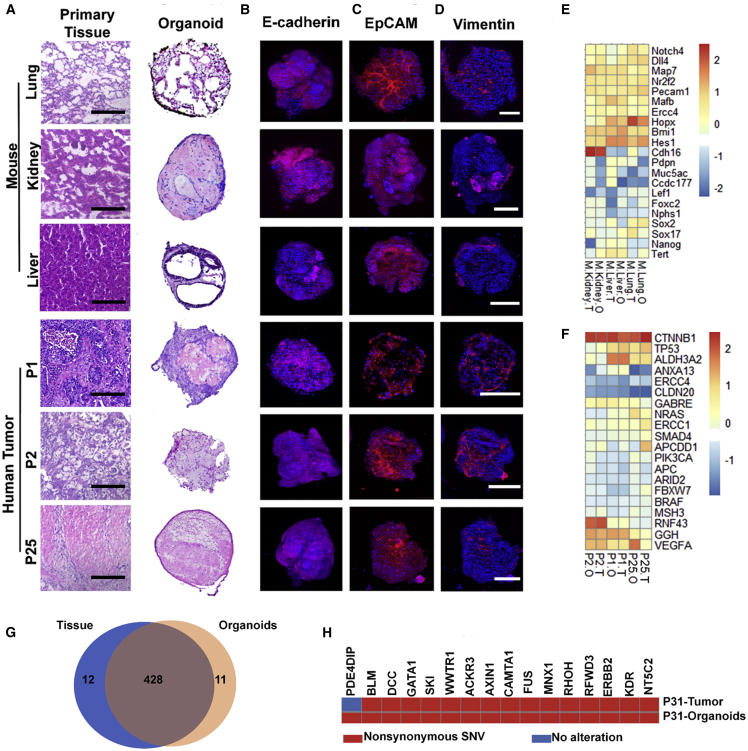
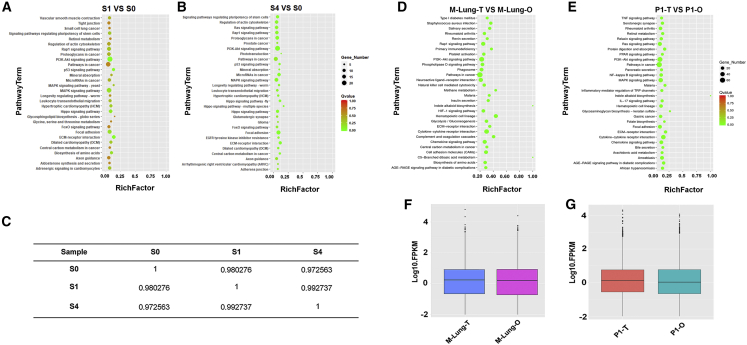
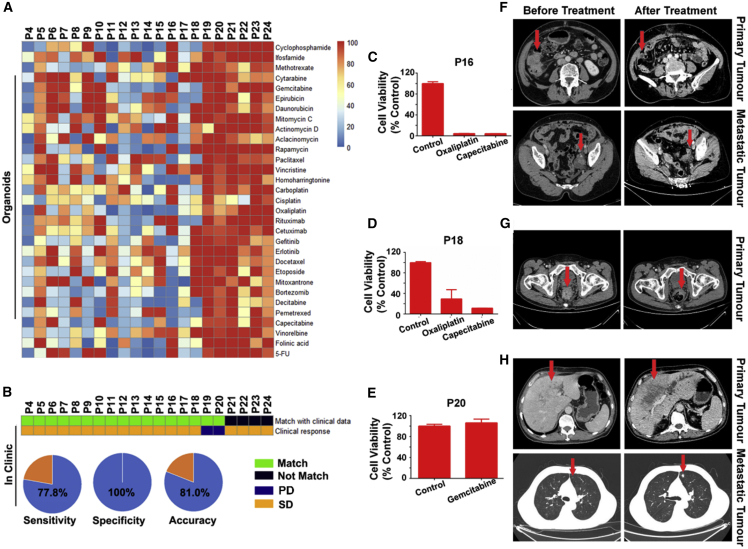
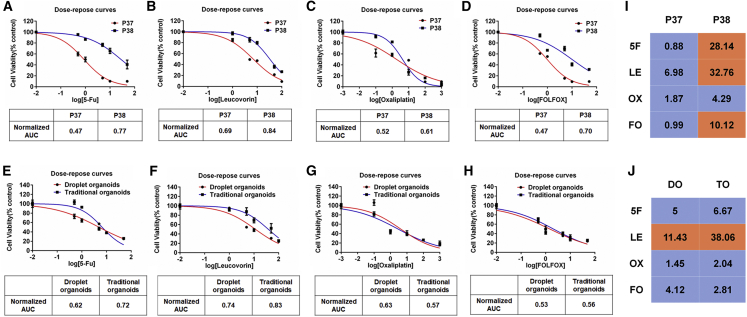
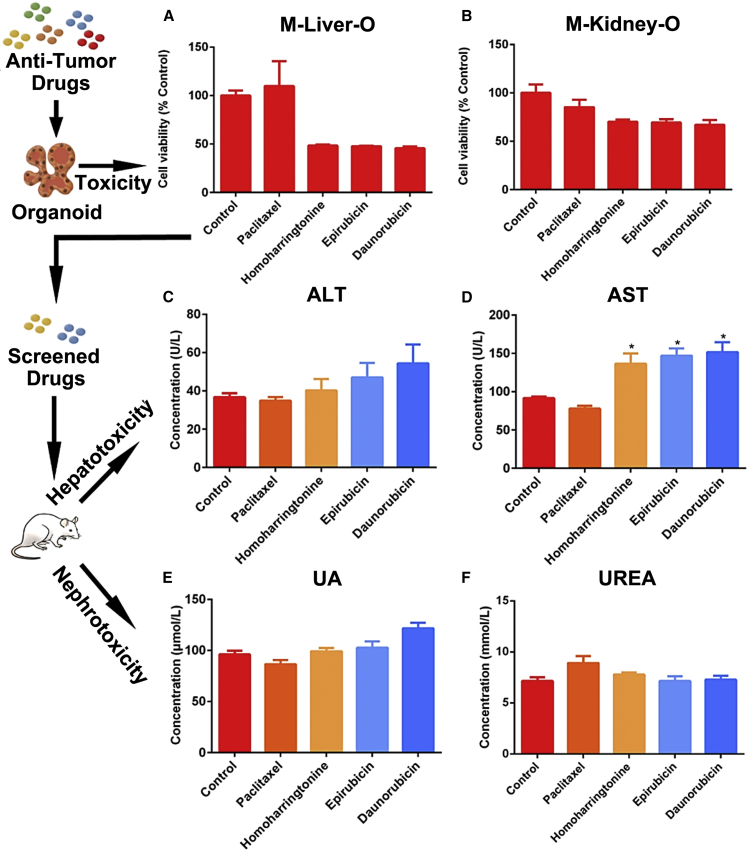
Current organoid technologies require intensive manual manipulation and lack uniformity in organoid size and cell composition. We present here an automated organoid platform that generates uniform organoid precursors in high-throughput. This is achieved by templating from monodisperse Matrigel droplets and sequentially delivering them into wells using a synchronized microfluidic droplet printer. Each droplet encapsulates a certain number of cells (e.g., 1,500 cells), which statistically represent the heterogeneous cell population in a tumor section. The system produces >400-μm organoids within 1 week with both inter-organoid homogeneity and inter-patient heterogeneity. This enables automated organoid printing to obtain one organoid per well. The organoids recapitulate 97% gene mutations in the parental tumor and reflect the patient-to-patient variation in drug response and sensitivity, from which we obtained more than 80% accuracy among the 21 patients investigated. This organoid platform is anticipated to fulfill the personalized medicine goal of 1-week high-throughput screening for cancer patients.

Keywords: droplet; microfluidics; organoid; printing; tumor.


Conflict of interest statement

S.M., L.H., S.J., and H.Z. are listed as inventors on provisional patent applications based on components of this work.

Figures

None
Graphical abstract
Figure 1
Figure 1
The Automated Organoid Platform (A) Sketch of the organoid platform. The platform contains an organoid fabrication module (M1) and an organoid printing module (M2). M1 is a customized droplet-based microfluidics system, where monodisperse cell-laden Matrigel droplets are generated and function as the structural templates for organoid precursors in the PTFE tubing. The tubing outlet is connected to the M2 module that is a modified 3D droplet printer and distributes individual organoid precursors into precision patterns. (B) Display of precision distribution of identical organoid precursors, i.e., cell-laden Matrigel spheres, on the cover of a 96-well plate. Each well cover contains one single sphere and positioned in the center. (C) Snapshot of the printing process, when the tubing outlet is placed on top of a well cover and controlled by the 3D droplet printer. The flow rates of the injection pumps were set at 30 μL/min for the oil phase and 20 μL/min for the droplet phase for formulation. The printer translation speeds were set as XY: 500 mm/s, Z: 20 mm/s, standing time 2 s for each well, at the oil flow rate of 30 μL/min for printing. See also Figures S1.
Figure 2
Figure 2
Inter-organoid Homogeneity (A and B) Bright-field images of identical organoid precursors (day 1) and organoids (day 7) of (A) mouse lung, kidney, liver, and (B) human lung, kidney and stomach tumors from three patients (P1, P2, P3), acquired after they were printed (day 1) and cultured for 7 days (day 7). Scale bar, 400 μm. (C and D) The violin plots of diameters of the mouse and human tumor organoid precursors (D1) and organoids (D7) at (A) and (B). The initial cell seeding density was 2.0 × 107 cells mL–1 for all panels (n = 100). See also Figure S2.
Figure 3
Figure 3
Histopathological Characterization and Gene-Expression Profiling of Healthy and Tumor Organoids (A) Histological images of organoids derived from mouse lung, kidney, liver, and human lung (P1), liver (P2), and gastric (P25) tumors and the comparison with their parental tissues/tumors. Scale bar, 200 μm. (B–D) Immunofluorescence staining for (B) E-cadherin, (C) EpCAM, and (D) vimentin of the organoids in (A). Scale bar, 200 μm. (E and F) Heatmap of gene expression of the organoids and their parental (E) tissues and (F) tumors by RNA-seq. It profiles (E) the organ-associated genes and chemotherapy-related genes and (F) the cancer genes and chemotherapy-related genes. (G) Venn diagram showing ∼97% mutational (SNV) overlap between the P31 tumor organoids and the parental tumor tissue. (H) Overview of the oncogene mutations detected in the P31 tumor organoids and the parental tumor tissue. See also Figure S3.
Figure 4
Figure 4
Cell-Phenotype Consistency of Organoids and Their Parental Tissues/Tumors Profiled by RNA-Seq (A and B) Scatterplot of the KEGG pathway enrichment analysis of differentially expressed genes in paired comparisons of (A) S0 versus S1 and (B) S0 versus S4 iPSCs. The Rich factor in the x axis is the ratio of differentially expressed gene numbers annotated in a pathway term to all gene numbers annotated in this pathway term. A greater Rich factor indicates a higher degree of pathway enrichment. The color codes the p values. (C) Pairwise Spearman’s ρ correlation coefficients between S0, S1, and S4 iPSCs. The iPSCs were loaded in Matrigel at 1.0 × 107 cells mL–1, formulated into droplets, incubated in tubing for 10 min, printed, and cultured in vitro before being sequenced. (D and E) Scatterplot of the KEGG pathway enrichment analysis of differentially expressed genes in paired comparisons of (D) mouse lung tissue (M-Lung-T) versus mouse lung organoid (M-Lung-O) and (E) patient 1 derived organoid (P1-O) versus patient 1 tumor (P1-T, lung). (F and G) Boxplot of the log FPKM expression values in (F) M-Lung-T and M-Lung-O, and (G) P1-O and P1-T.
Figure 5
Figure 5
Tumor Organoids Capture Inter-patient Heterogeneous Responses to Anticancer Drugs (A) Heatmap of cell viability profiled for organoids derived from 21 patients of different tumors conditioned in 31 individual anticancer compounds. The organoids were cultured under the drug-free conditions for 7 days before being dosed with single drugs at 10 μM for 2 days (n = 5). (B) Heatmap of the organoid response and patients’ clinical outcomes. (C–H) Drug efficacy profiles (C–E) (n = 5) and computed tomography (CT) (F–H) of patient tumors matching (C, F, and D, G) or mismatching (E, H) the screening outcomes before and after the anticancer treatment for colon (F), rectal (G), and liver (H) tumors. See also Figures S4–S6 and Tables S1 and S2.
Figure 6
Figure 6
Dose Responses to Chemotherapy in Rectal Tumor Organoids (A–D) Chemosensitivity of P37, P38 organoids to 5-FU (A), leucovorin (B), Oxaliplatin (C), FOLFOX (D) (5-Fu: leucovorin: Oxaliplatin = 25:5:1) in the form of dose-response curves (n = 3). AUC was calculated from the raw dose-response data. (E–H) Dose responses to chemotherapy in droplet organoids and traditional organoids. Chemosensitivity of P33 organoids to 5-FU (E), leucovorin (F), Oxaliplatin (G), and FOLFOX (H) (5-Fu: Leucovorin: Oxaliplatin = 25:5:1) in the form of dose-response curves (n = 3). AUC was calculated from the raw dose response data. (I and J) The heatmaps show the values of IC50 of P37 and P38 organoids (I), and responses of P33 droplet organoids (DO) and traditional organoids (TO) to 5-FU (5F), leucovorin (LE), Oxaliplatin (OX), FOLFOX (FO) (J). The colors code sensitivity (blue) and resistance (orange) at an arbitrary cutoff value of 10 μM. See also Table S2.
Figure 7
Figure 7
Toxicity Evaluation of Anticancer Drugs on Liver and Kidney Organoids (A and B) The toxicity of 4 anticancer drugs screened on organoids derived from mouse (A) livers and (B) kidneys (n = 4). (C–F) Validation of the screening outcomes, by testing Paclitaxel, Homoharringtonine, Epirubicin, and Daunorubicin on mice (n = 6). See also Figure S7.

References

    1. Dagogo-Jack I., Shaw A.T. Tumour heterogeneity and resistance to cancer therapies. Nat. Rev. Clin. Oncol. 2018;15:81–94. - PubMed
    1. Keller L., Pantel K. Unravelling tumour heterogeneity by single-cell profiling of circulating tumour cells. Nat. Rev. Cancer. 2019;19:553–567. - PubMed
    1. Meacham C.E., Morrison S.J. Tumour heterogeneity and cancer cell plasticity. Nature. 2013;501:328–337. - PMC - PubMed
    1. Tuveson D., Clevers H. Cancer modeling meets human organoid technology. Science. 2019;364:952–955. - PubMed
    1. Jin Y., Jin K., Seung L.J., Min S., Suran K., Da-Hee A., Yun-Gon K., Seung-Woo C. Drug Screening: Vascularized Liver Organoids Generated Using Induced Hepatic Tissue and Dynamic Liver-Specific Microenvironment as a Drug Testing Platform. Adv. Funct. Mater. 2018;28:1801954.

Publication types