

Changes in a Frailty Index and Association with Mortality
- PMID: 33377190
- PMCID: PMC8071066
- DOI: 10.1111/jgs.17002
Changes in a Frailty Index and Association with Mortality
Abstract
Background: Although frailty status is dynamic, whether improvements in frailty predict mortality is unknown.
Objective: Describe 1-year changes in a frailty index (FI) and association with 48-month mortality.
Design: Secondary analysis of the National Health in Aging Trends Study.
Setting: Community.
Participants: Five thousand six hundred and seventy two Medicare beneficiaries 65 and older (3,267 (55.8%) females).
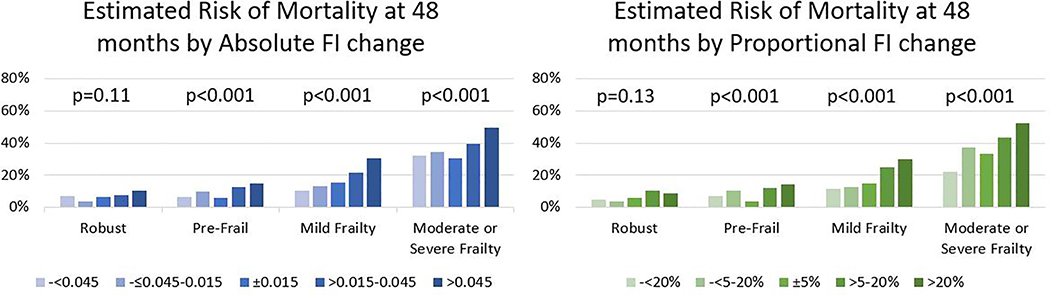
Measurements: A 40-item deficit accumulation FI was measured in 2011 and 2012, based on multidomain assessment including comorbidities, activities of daily living, physical tasks, cognition, and performance testing. We categorized 2011 FI into robust (FI < 0.15), pre-frail (FI = 0.15-0.24), mild frailty (FI = 0.25-0.34), and moderate to severe frailty (FI ≥ 0.35). Change in frailty was calculated as the FI change from 2011 to 2012, categorized as either absolute (>0.045 decrease, 0.015-0.045 decrease, ±0.015 change, 0.015-0.045 increase, >0.045 increase) or proportional change (>20% decrease, 5-20% decrease, ±5% change, 5-20% increase, 20% increase). We measured the association of FI change with 4-year mortality using Cox regression.
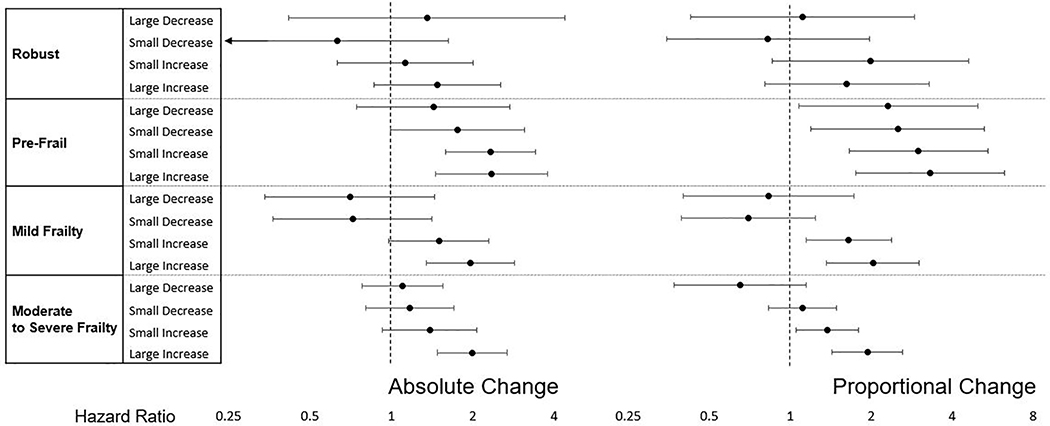
Results: From 2011 to 2012, mean FI increased by 0.02 (standard deviation 0.07), with 58.6% having an increase. Over 4 years, 1,039 participants (13.6%) died. After adjusting for age and sex, compared to stable frailty (±0.015), both absolute (>0.045) and proportional (>20%) increases in frailty were associated with higher mortality among pre-frail participants (hazard ratio (HR) = 2.35, 95% confidence interval (CI) = (1.45-3.79) and HR (95% CI) = 3.32 (1.76-6.26), respectively), participants with mild frailty (HR (95% CI) = 1.96 (1.35-2.85) and 2.03 (1.37-3.02)) and moderate or severe frailty (HR (95% CI) = 1.99 (1.48-2.67) and 1.94 (1.43-2.63)) but not robust participants (HR (95% CI)= 1.48 (0.86-2.54), HR (95% CI) = 1.62 (0.80-3.28)). However, decreases in FI were not significantly associated with decreased risk of mortality.
Conclusions: Increasing deficit accumulation FI over 1 year is associated with increased mortality risk. While decreasing FI occurs, we did not find evidence to support reduced mortality risk.
Keywords: change; frailty; mortality.
© 2020 The American Geriatrics Society.
Conflict of interest statement
CONFLICT OF INTEREST
The authors have no conflicts of interest to disclose
Sponsor’s Role: None
Figures
References
-
- Rockwood K, Mitnitski A . Frailty in relation to the accumulation of deficits. Journals Gerontol - Ser A Biol Sci Med Sci. 2007;62(7):722–727. doi:62/7/722 [pii] - PubMed
Publication types
MeSH terms
Grants and funding
LinkOut - more resources
Full Text Sources
