. 2021 Mar;43(3):e2000257.
doi: 10.1002/bies.202000257. Epub 2020 Dec 30.

Microscopy-based assay for semi-quantitative detection of SARS-CoV-2 specific antibodies in human sera: A semi-quantitative, high throughput, microscopy-based assay expands existing approaches to measure SARS-CoV-2 specific antibody levels in human sera

Affiliations

Microscopy-based assay for semi-quantitative detection of SARS-CoV-2 specific antibodies in human sera: A semi-quantitative, high throughput, microscopy-based assay expands existing approaches to measure SARS-CoV-2 specific antibody levels in human sera

Constantin Pape et al. Bioessays. 2021 Mar.

Abstract

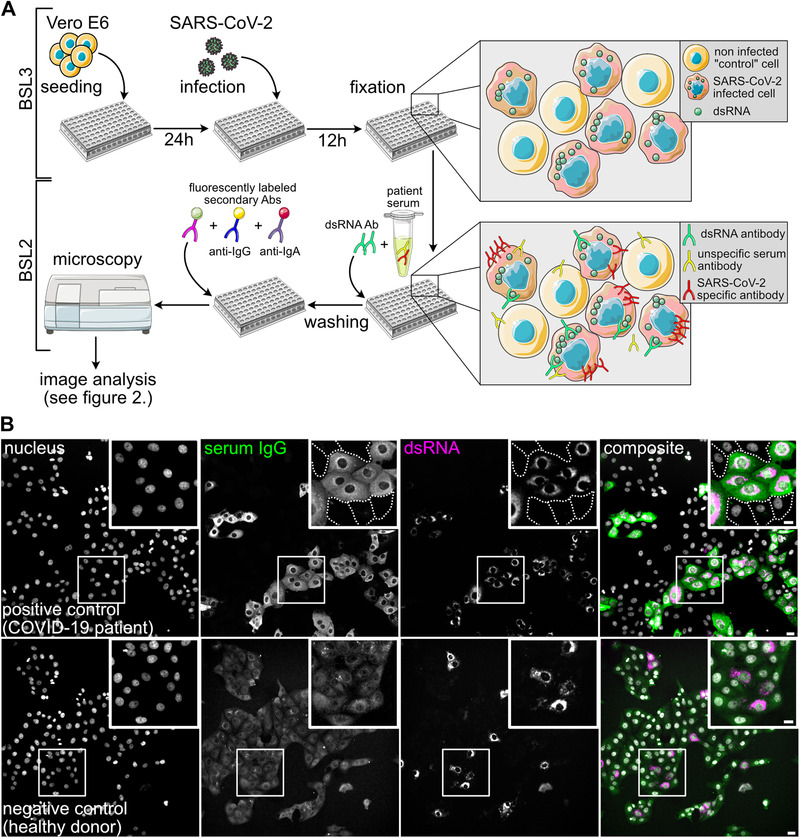
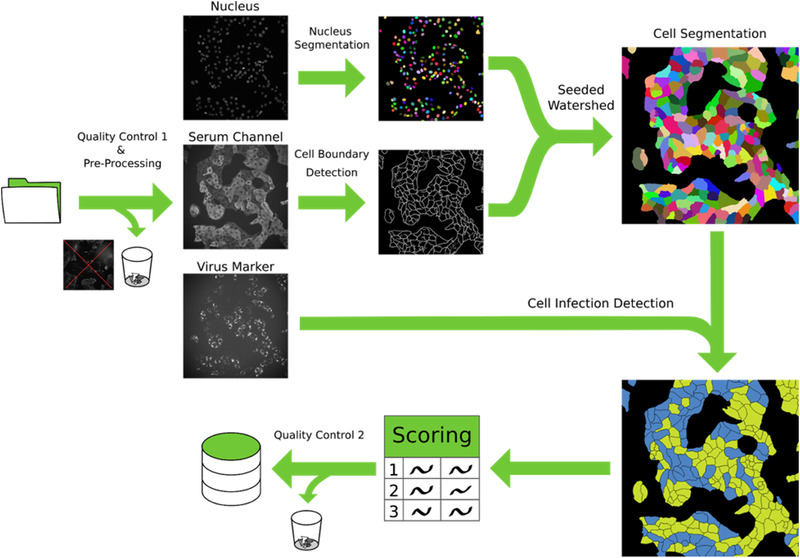
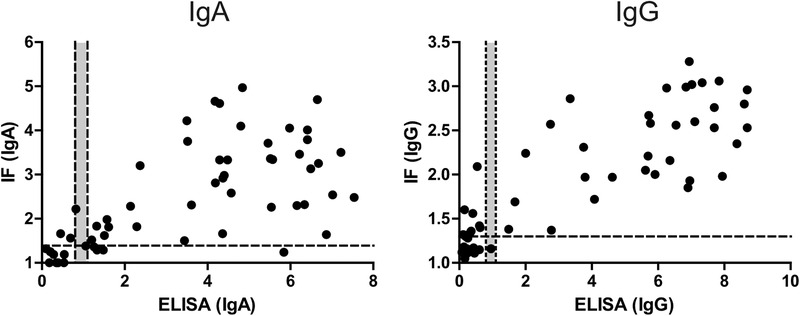
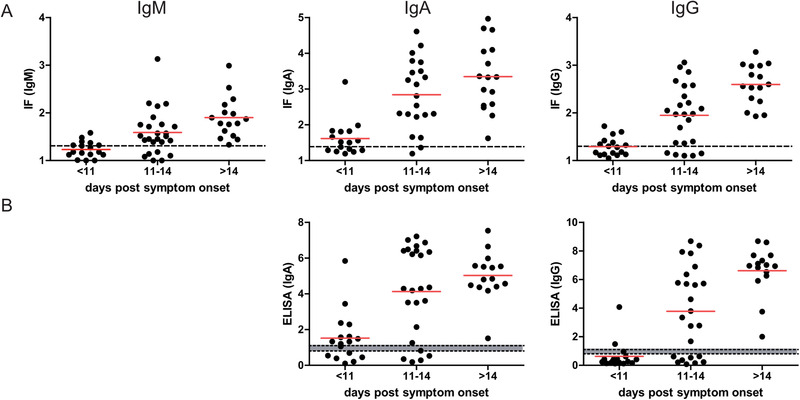
Emergence of the novel pathogenic coronavirus SARS-CoV-2 and its rapid pandemic spread presents challenges that demand immediate attention. Here, we describe the development of a semi-quantitative high-content microscopy-based assay for detection of three major classes (IgG, IgA, and IgM) of SARS-CoV-2 specific antibodies in human samples. The possibility to detect antibodies against the entire viral proteome together with a robust semi-automated image analysis workflow resulted in specific, sensitive and unbiased assay that complements the portfolio of SARS-CoV-2 serological assays. Sensitive, specific and quantitative serological assays are urgently needed for a better understanding of humoral immune response against the virus as a basis for developing public health strategies to control viral spread. The procedure described here has been used for clinical studies and provides a general framework for the application of quantitative high-throughput microscopy to rapidly develop serological assays for emerging virus infections.

Keywords: SARS-CoV-2; antibody; immunofluorescence; machine learning image analysis; quantitative microscopy; serological test.


Conflict of interest statement

The authors declare they have no conflicts of interest.

Figures

FIGURE 1
FIGURE 1
Principle of the immunofluorescence assay for SARS‐CoV‐2 antibody detection. (A) Scheme of the IF workflow and the concept for SARS‐CoV‐2 antibody detection. (B) Representative images showing immunofluorescence results using a COVID‐19 patient serum (positive control, upper panels) and a negative control serum (lower panels), followed by staining with an AlexaFluor488‐coupled anti‐IgG secondary antibody. Nuclei (grey), IgG (green), dsRNA (magenta) channels and a composite image are shown. White boxes mark the zoomed areas. Dashed lines mark borders of non‐infected cells that are not visible at the chosen contrast setting. Note that the upper and lower panels are not displayed with the same brightness and contrast settings. In the lower panels the brightness and contrast scales have been expanded in order to visualize cells in the IgG serum channel where only background staining was detected. Scale bar is 20 μm in overview and 10 μm in the insets
FIGURE 2
FIGURE 2
Schematic overview of the image processing pipeline. Initially, images are subjected to the first manual quality control, where images with acquisition defects are discarded. A pre‐processing step is then applied to correct for barrel artifacts. Subsequently, segmentation is obtained via seeded watershed, this algorithm requires seeds obtained from StarDist segmentation of the nuclei and boundary evidence computed using a neural network. Lastly, using the virus marker channel we classify each cell as infected or not infected and we computed the scoring. A final automated quality control identifies and automatically discards non‐conform results. All intermediate results are saved in a database for ensuring fully reproducibility of the results
FIGURE 3
FIGURE 3
Examples of results from the automated image analysis pipeline. Panels display images that correspond to three different ratio scores (ratio score is indicated above the image) determined from samples stained with three different human sera, followed by staining with an anti‐IgG secondary antibody coupled to AlexaFluore488. Images represent overlays of three channels—nuclei (blue), IgG (green) and dsRNA (red). White boxes mark the zoomed area. Cells in the insets are highlighted with yellow or cyan boundaries, indicating infected and non‐infected cells, respectively. Scale bar = 10 μm
FIGURE 4
FIGURE 4
Correlation between SARS‐CoV‐2 specific IF and ELISA results for the negative control panel obtained in IgA (A) or IgG (B) measurements. Each dot represents one serum sample. Blue, healthy donors; red, ccCoV positive; green, CMV positive; orange, EBV positive; black, mycoplasma positive. Bottom panels represent zoomed‐in versions of the respective top panel to illustrate the borderline region. (C) IgM values for the indicated negative control cohorts determined by IF. Since a corresponding IgM specific ELISA kit from Euroimmun was not available, correlation was not analysed in this case. In some cases, antibody binding above background was undetectable by IF in non‐infected as well as in infected cells, indicating low unspecific cross‐reactivity and lack of specific reactivity of the respective serum. In order to allow for inclusion of these data points in the graph, the IF ratio was set to 1.0. Dotted lines indicate the optimal separation cut‐off values defined for sample classification, grey areas indicate borderline results in ELISA
FIGURE 5
FIGURE 5
Correlation between IgA or IgG values obtained by ELISA and IF for sera from 29 COVID‐19 patients collected at different days’ post infection. In some cases, antibody binding above background was undetectable by IF in non‐infected as well as in infected cells, indicating low unspecific cross‐reactivity and lack of specific reactivity of the respective serum. In order to allow for inclusion of these data points in the graph, the IF ratio was set to 1.0. Dotted lines indicate the cut‐off values defined for classification of readouts, grey areas indicate borderline values
FIGURE 6
FIGURE 6
Detection of SARS‐CoV‐2 specific antibodies in sera from COVID‐19 patients. (A) Fifty‐seven serum samples from 29 PCR confirmed patients collected at the indicated times post symptom onset were analysed by the IF workflow for the presence of SARS‐CoV‐2 specific IgM, IgA and IgG antibodies. Each dot represents one serum sample. Red line: mean value; dotted line: cut‐off between negative and positive values. (B) The same samples as in A were analysed by ELISA for the presence of SARS‐CoV‐2 specific IgA and IgG antibodies. Each dot represents one serum sample. Red line: mean value; dotted lines: cut‐off; grey zone: borderline

References

    1. Wu, F. , Zhao, S. , Yu, B. , Chen, Y. M. , Wang, W. , Song, Z. G. , … Zhang, Y. Z. (2020). A new coronavirus associated with human respiratory disease in China. Nature, 579, 265–269. - PMC - PubMed
    1. Gorbalenya, A. E. , Baker, S. C. , Baric, R. S. , de Groot, R. J. , Drosten, C. , Gulyaeva, A. A. , … Ziebuhr, J. (2020). The species Severe acute respiratory syndrome‐related coronavirus: Classifying 2019‐nCoV and naming it SARS‐CoV‐2. Nat. Microbiol., 5, 536–44. - PMC - PubMed
    1. Zhou, P. , Yang, X. L. , Wang, X. G. , Hu, B. , Zhang, L. , Zhang, W. , … Shi, Z. L. (2020). A pneumonia outbreak associated with a new coronavirus of probable bat origin. Nature, 579, 270–273. - PMC - PubMed
    1. Corman, V. M. , Landt, O. , Kaiser, M. , Molenkamp, R. , Meijer, A. , Chu, D. K. , … Drosten, C. (2020). Detection of 2019 novel coronavirus (2019‐nCoV) by real‐time RT‐PCR. Eurosurveillance, 25, 1–8. - PMC - PubMed
    1. Dao Thi, V. L. , Herbst, K. , Boerner, K. , Meurer, M. , Kremer, L. P. , Kirrmaier, D. , … Anders, S. (2020). A colorimetric RT‐LAMP assay and LAMP‐sequencing for detecting SARS‐CoV‐2 RNA in clinical samples. Sci. Transl. Med., 12, eabc7075. - PMC - PubMed

Publication types