

Multimodal MRI assessment for first episode psychosis: A major change in the thalamus and an efficient stratification of a subgroup
- PMID: 33377594
- PMCID: PMC7856640
- DOI: 10.1002/hbm.25276
Multimodal MRI assessment for first episode psychosis: A major change in the thalamus and an efficient stratification of a subgroup
Abstract
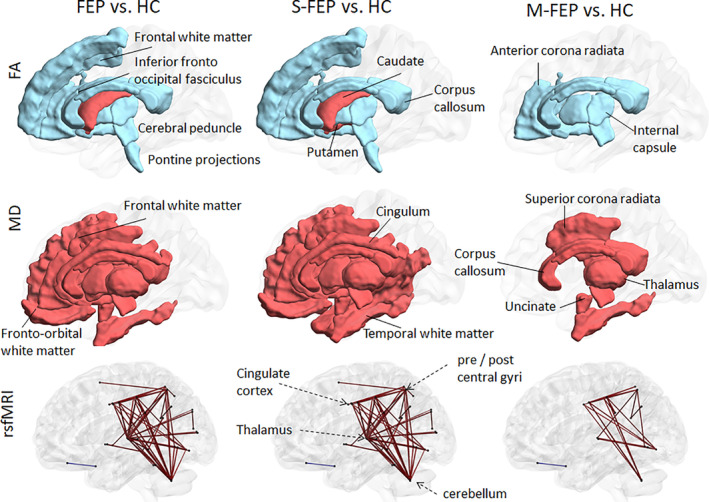
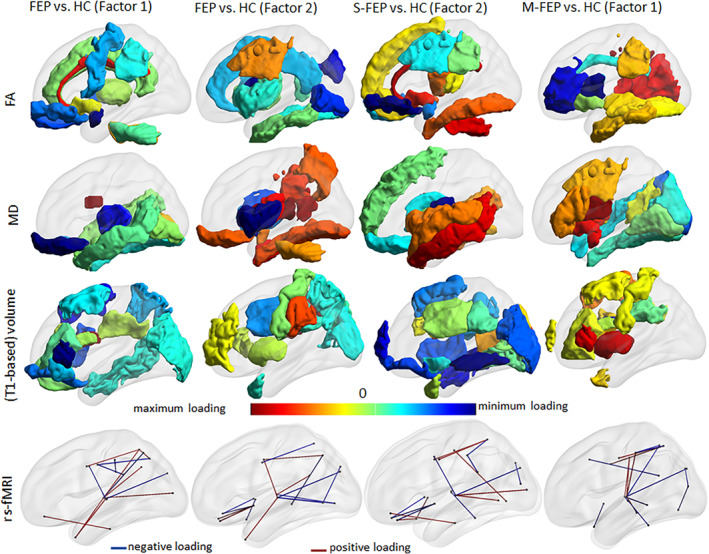
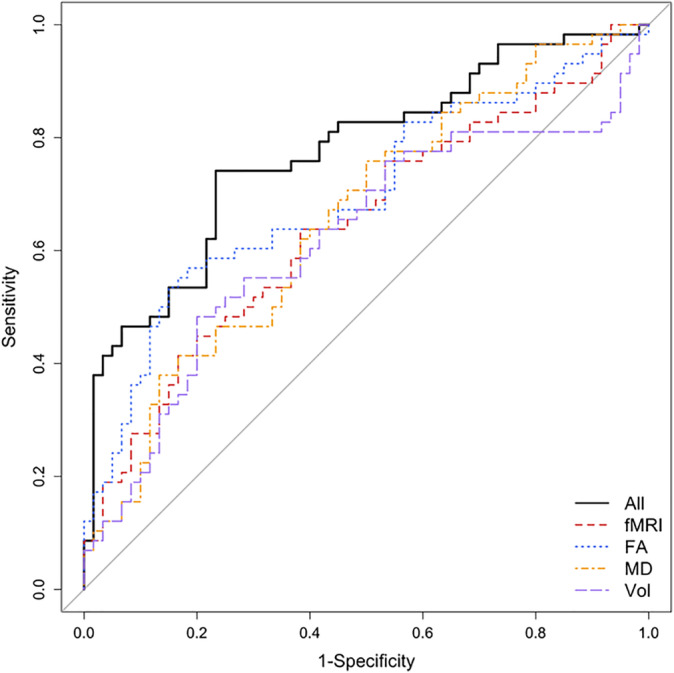
Multi-institutional brain imaging studies have emerged to resolve conflicting results among individual studies. However, adjusting multiple variables at the technical and cohort levels is challenging. Therefore, it is important to explore approaches that provide meaningful results from relatively small samples at institutional levels. We studied 87 first episode psychosis (FEP) patients and 62 healthy subjects by combining supervised integrated factor analysis (SIFA) with a novel pipeline for automated structure-based analysis, an efficient and comprehensive method for dimensional data reduction that our group recently established. We integrated multiple MRI features (volume, DTI indices, resting state fMRI-rsfMRI) in the whole brain of each participant in an unbiased manner. The automated structure-based analysis showed widespread DTI abnormalities in FEP and rs-fMRI differences between FEP and healthy subjects mostly centered in thalamus. The combination of multiple modalities with SIFA was more efficient than the use of single modalities to stratify a subgroup of FEP (individuals with schizophrenia or schizoaffective disorder) that had more robust deficits from the overall FEP group. The information from multiple MRI modalities and analytical methods highlighted the thalamus as significantly abnormal in FEP. This study serves as a proof-of-concept for the potential of this methodology to reveal disease underpins and to stratify populations into more homogeneous sub-groups.
Keywords: DTI; factor analysis; first-episode psychosis; multimodal MRI; resting state fMRI; schizophrenia.
© 2020 The Authors. Human Brain Mapping published by Wiley Periodicals LLC.
Conflict of interest statement
S. Mori and M. I. Miller own “AnatomyWorks”. Dr. Mori is its CEO. This arrangement is managed by the Johns Hopkins University in accordance with its conflict‐of‐interest policies. All the authors have declared no biomedical financial interests or potential conflicts of interest.
Figures

Similar articles
-
Using genetic, cognitive and multi-modal neuroimaging data to identify ultra-high-risk and first-episode psychosis at the individual level.Psychol Med. 2013 Dec;43(12):2547-62. doi: 10.1017/S003329171300024X. Epub 2013 Mar 14. Psychol Med. 2013. PMID: 23507081 Free PMC article.
-
Evaluating accuracy of striatal, pallidal, and thalamic segmentation methods: Comparing automated approaches to manual delineation.Neuroimage. 2018 Apr 15;170:182-198. doi: 10.1016/j.neuroimage.2017.02.069. Epub 2017 Mar 1. Neuroimage. 2018. PMID: 28259781
-
Multimodal Neuroimaging Summary Scores as Neurobiological Markers of Psychosis.Schizophr Bull. 2024 Jul 27;50(4):792-803. doi: 10.1093/schbul/sbad149. Schizophr Bull. 2024. PMID: 37844289 Free PMC article.
-
A meta-analysis and systematic review of single vs. multimodal neuroimaging techniques in the classification of psychosis.Mol Psychiatry. 2023 Aug;28(8):3278-3292. doi: 10.1038/s41380-023-02195-9. Epub 2023 Aug 10. Mol Psychiatry. 2023. PMID: 37563277 Free PMC article.
-
Effects of pharmacological treatments on neuroimaging findings in first episode affective psychosis: A review of longitudinal studies.J Affect Disord. 2020 Nov 1;276:1046-1051. doi: 10.1016/j.jad.2020.07.118. Epub 2020 Jul 29. J Affect Disord. 2020. PMID: 32763589 Review.
Cited by
-
Neuroimaging in schizophrenia: A review article.Front Neurosci. 2022 Nov 15;16:1042814. doi: 10.3389/fnins.2022.1042814. eCollection 2022. Front Neurosci. 2022. PMID: 36458043 Free PMC article. Review.
-
Sex-specific involvement of the Notch-JAG pathway in social recognition.Transl Psychiatry. 2022 Mar 10;12(1):99. doi: 10.1038/s41398-022-01867-4. Transl Psychiatry. 2022. PMID: 35273151 Free PMC article.
-
Brain regions associated with olfactory dysfunction in first episode psychosis patients.World J Biol Psychiatry. 2023 Feb;24(2):178-186. doi: 10.1080/15622975.2022.2082526. Epub 2022 Jun 9. World J Biol Psychiatry. 2023. PMID: 35678361 Free PMC article.
-
Cortical Network Disruption Is Minimal in Early Stages of Psychosis.Schizophr Bull Open. 2024 Apr 22;5(1):sgae010. doi: 10.1093/schizbullopen/sgae010. eCollection 2024 Jan. Schizophr Bull Open. 2024. PMID: 39144115 Free PMC article.
-
Thalamic Connectivity System Across Psychiatric Disorders: Current Status and Clinical Implications.Biol Psychiatry Glob Open Sci. 2021 Oct 7;2(4):332-340. doi: 10.1016/j.bpsgos.2021.09.008. eCollection 2022 Oct. Biol Psychiatry Glob Open Sci. 2021. PMID: 36324665 Free PMC article. Review.
References
-
- Agcaoglu, O. , Miller, R. , Damaraju, E. , Rashid, B. , Bustillo, J. , Cetin, M. S. , … Calhoun, V. D. (2017). Decreased hemispheric connectivity and decreased intra‐ and inter‐hemisphere asymmetry of resting state functional network connectivity in schizophrenia. Brain Imaging and Behavior, 12(3), 615–630. - PMC - PubMed
-
- Altamura, A. C. , Delvecchio, G. , Marotta, G. , Oldani, L. , Pigoni, A. , Ciappolino, V. , … Brambilla, P. (2017). Structural and metabolic differentiation between bipolar disorder with psychosis and substance‐induced psychosis: An integrated MRI/PET study. European Psychiatry: The Journal of the Association of European Psychiatrists, 41, 85–94. - PubMed
-
- Anticevic, A. (2017). Understanding the role of thalamic circuits in schizophrenia neuropathology. Schizophrenia Research, 180, 1–3. - PubMed
Publication types
MeSH terms
Grants and funding
LinkOut - more resources
Full Text Sources
Medical
