. 2020 Dec;10(8):e242.
doi: 10.1002/ctm2.242.

mir15a/mir16-1 cluster and its novel targeting molecules negatively regulate cardiac hypertrophy

Affiliations

mir15a/mir16-1 cluster and its novel targeting molecules negatively regulate cardiac hypertrophy

Hongchang Guo et al. Clin Transl Med. 2020 Dec.

Erratum in

  • CORRIGENDUM.
    [No authors listed] [No authors listed] Clin Transl Med. 2021 Feb;11(2):e302. doi: 10.1002/ctm2.302. Clin Transl Med. 2021. PMID: 33635006 Free PMC article. No abstract available.

Abstract

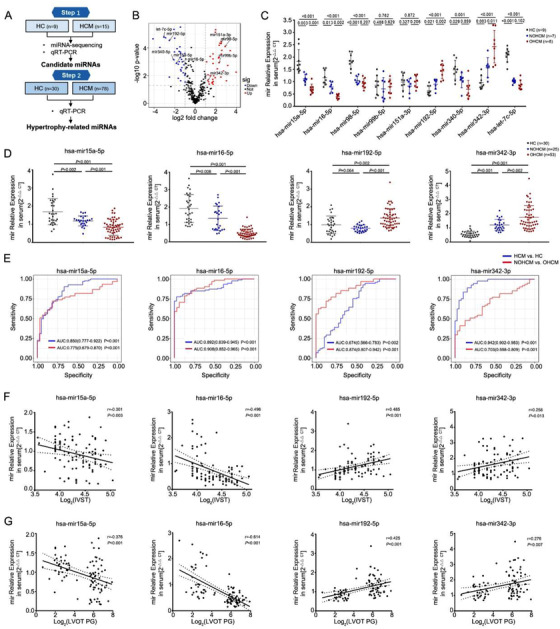
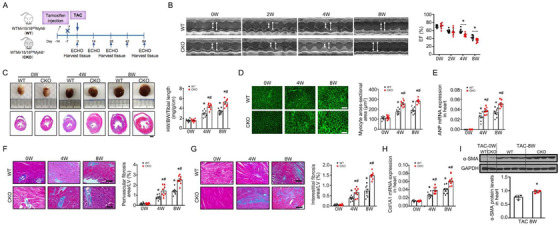
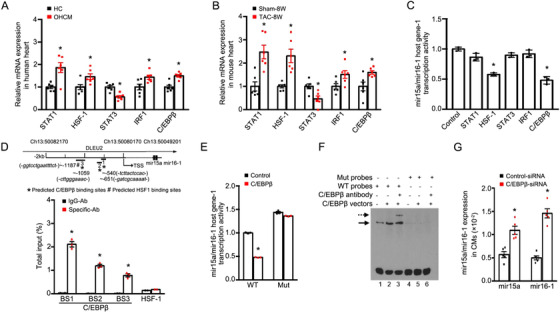
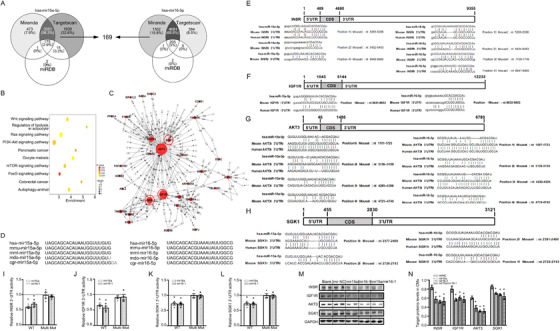
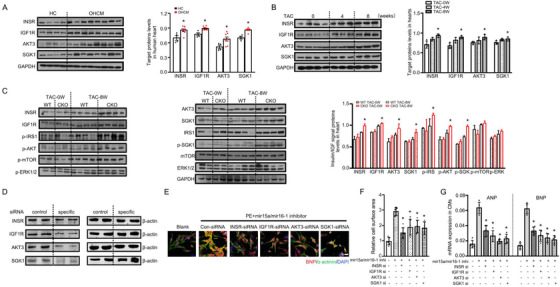
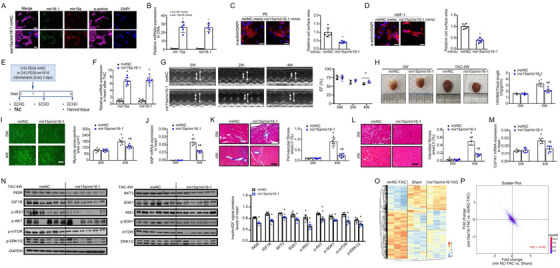
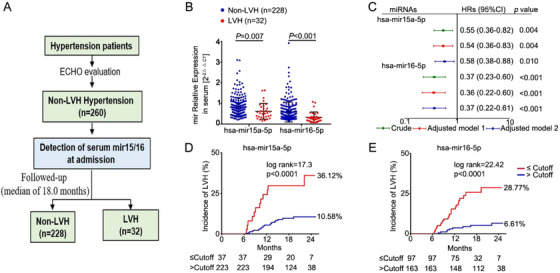
In response to pathological stimuli, the heart develops ventricular hypertrophy that progressively decompensates and leads to heart failure. miRNAs are increasingly recognized as pathogenic factors, clinically relevant biomarkers, and potential therapeutic targets. We identified that mir15a/mir16-1 cluster was negatively correlated with hypertrophic severity in patients with hypertrophic cardiomyopathy. The mir15a/mir16-1 expression was enriched in cardiomyocytes (CMs), decreased in hypertrophic human hearts, and decreased in mouse hearts after transverse aortic constriction (TAC). CM-specific mir15a/mir16-1 knockout promoted cardiac hypertrophy and dysfunction after TAC. CCAAT/enhancer binding protein (C/EBP)β was responsible for the downregulation of mir15a/mir16-1 cluster transcription. Mechanistically, mir15a/mir16-1 cluster attenuated the insulin/IGF1 signal transduction cascade by inhibiting multiple targets, including INSR, IGF-1R, AKT3, and serum/glucocorticoid regulated kinase 1 (SGK1). Pro-hypertrophic response induced by mir15a/mir16-1 inhibition was abolished by knockdown of insulin receptor (INSR), insulin like growth factor 1 receptor (IGF1R), AKT3, or SGK1. In vivo systemic delivery of mir15a/mir16-1 by nanoparticles inhibited the hypertrophic phenotype induced by TAC. Importantly, decreased serum mir15a/mir16-1 levels predicted the occurrence of left ventricular hypertrophy in a cohort of patients with hypertension. Therefore, mir15a/mir16-1 cluster is a promising therapeutic target and biomarker for cardiac hypertrophy.

Keywords: biomarkers; cardiac hypertrophy; heart failure; miRNAs; therapeutic target.


Conflict of interest statement

The authors declare that there is no conflict of interest that could be perceived as prejudicing the impartiality of the research reported

Figures

FIGURE 1
FIGURE 1
Identification of hypertrophy‐related miRNAs in patients with HCM. A, Schematic description of the workflow illustrating the two‐stage‐approach involving independent samples for discovery and validation. B, Volcano plot revealing miRNA‐sequencing results comparing HCM (n = 15) versus HCs (n = 9). Individual miRNAs are displayed by the FDR‐adjusted P‐value and the corresponding fold change. C, qRT‐PCR espression analysis of nine candidate miRNAs in discovery samples (HCs = 9, NOHCM = 7, OHCM = 8). D, qRT‐PCR expression analysis of four miRNAs (mir15a‐5p, mir16‐5p, mir192‐5p, and mir342‐3p) in an independent validation sample (HCs = 30, NOHCM = 25, OHCM = 53). E, Area under the receiver operating curve of 4 miRNAs (values given on the graphs) discriminating HCM versus HC, NOHCM versus OHCM. F and G, Correlation analysis of the expression of single miRNA and the interventricular septum thickness (IVST) (F) and the left ventricular outflow tract (LVOT) pressure gradient (PG) (G) in patients with HCM (n = 93). Statistical significance was determined by 1‐way ANOVA Tukey's post‐hoc test (C and D) by Spearman's correlation test (F and G) Abbreviations: HC, healthy control; HCM, hypertrophic cardiomyopathy; NOHCM, non‐obstructive hypertrophic cardiomyopathy; OHCM, obstructive hypertrophic cardiomyopathy.
FIGURE 2
FIGURE 2
Cardiomyocyte‐specific mir15a/mir16‐1 knockout aggravates cardiac hypertrophy and dysfunction after TAC. A, Cardiomyocyte‐specific mir15a/mir16‐1 knockout (CKO) and wild‐type (WT) control mice were subjected to tamoxifen, followed by TAC operation for 8 weeks. B, M‐mode echocardiographic imaging of the heart before (0) and after (2, 4, and 8 weeks) TAC. Analysis of and ejection fraction (EF)% of hearts of WT and CKO mice subjected to TAC (n = 8 per group). *P < .05 versus WT mice. C, Whole‐mount representation of heart (Upper), representative image of heart sections stained with Masson trichrome (bottom), heart weight/body weight/tibia length ratios in WT and CKO mice before and after (4 and 8 weeks) TAC (n = 8 per group). *P < .05 versus mice before TAC; # P < .05 versus WT‐TAC. Bars = 500 μm. D‐H, WGA‐stained section of left ventricles and quantification of myocyte cross‐sectional area (D), ANP mRNA expression (1.5‐fold at 4 weeks, 1.5‐fold at 8 weeks) (E), representative image of perivascular (F) and interestitital fibrosis (G) and quantification of fibrotic area, Col1A1mRNA expression (1.5‐fold at 4 weeks, 1.5‐fold at 8 weeks) (H) in WT and CKO mice before and after (4 and 8 weeks) TAC (n = 8 per group). *P < .05 versus mice before TAC; # P < .05 versus WT‐TAC. D, Bars = 50 μm; F and G, Bars = 100 μm. I, α‐SMA protein levels (1.3‐fold) in heart from WT and CKO mice before and post‐TAC 8 weeks (n = 4 per group). *P < .05 versus WT‐TAC. Statistical significance was determined by the two‐sided t‐test (B‐H) or Mann–Whitney U test (I)
FIGURE 3
FIGURE 3
Downregulation of mir15a/mir16‐1 cluster in cardiomyocytes by C/EBPβ. A, qRT‐PCR indicated the expression of STAT1 (1.9‐fold), HSF1 (1.5‐fold), STAT3 (0.6‐fold), IRF1(1.4‐fold), and C/EBPβ (1.5‐fold) in human samples from representative normal control and hypertrophic hearts (n = 6 per group). *P < .05 versus HC. B, qRT‐PCR indicated the expression of STAT1 (2.5‐fold), HSF1 (2.3‐fold), STAT3 (0.5‐fold), IRF1(1.4‐fold), and C/EBPβ (1.6‐fold) in hearts from mice subjected to TAC (n = 6 per group). *P < .05 versus sham operation. C, Quantification of luciferase activity in cells with human pri‐mir15a/mir16‐1‐luciferase reporter constructs followed by TF overexpression as indicated (n = 3 experiments with 5 well replicates). *P < .05 versus control vector. D, Putative C/EBPβ or HSF1 binding sites are shown as asterisks or pound signs. Consensus sequences are italicized in parentheses. PCR amplicons 1, 2, and 3 are shown as numbered lines. Chromatin immunoprecipitation assays were performed using IgG, C/EBPβ, or HSF1 antibody (Ab) in cells stimulated with PE (n = 3 experiments). *P < .05 versus IgG Ab. E, Quantification of luciferase activity in cells transfected with wild‐type construct of pri‐mir15a/mir16‐1 or its mutant at the C/EBPβ‐binding site. Luciferase values normalized to the empty vector control (n = 3 experiments with 3 well replicates). *P < .05 versus control vector. F, EMSA assay showed specific binding complexes with 293T cells transfected with C/EBPβ expression vectors (lane 2). A weak signal was observed in non‐transfected 293T cells (lane1). Supershift experiments indicated C/EBPβ‐binding specificity (lane 3). Arrows indicate specific C/EBPβ‐DNA complexes (straight line) or antibody‐ C/EBPβ–DNA supershift complexes (dashed line). When the putative CEBP binding site was mutated, no DNA/protein complex was observed (lanes 4‐6). Bottom signals correspond to free probes. G, mir15a and mir16‐1 expression in CMs transfected with control‐siRNA or C/EBPβ‐siRNA subjected to PE (n = 5 per group). *P < .05 versus Control‐siRNA. Statistical significance was determined by the two‐sided t‐test (A, B, D, and G), by 1‐way ANOVA Tukey's post‐hoc test (C), by Mann‐Whitney test (E) Abbreviation: TSS, transcription start site.
FIGURE 4
FIGURE 4
mir15a/mir16‐1 targets multiple genes of insulin/IGF1 genes. A, Venn intersection of putative target genes of hsa‐mir15a‐5p and has‐mir16‐5p, based upon three databases (Targetscan version 7.1, miRDB, and miRanda). B, Pathway analysis based on 169 putative targets genes. C, Putative target genes were connected in a network based on established protein‐protein interactions and signaling pathways. Nodes represent genes. Node area is the degree to which other genes interact with the given gene. D, Schematic representation of mir15a and mir16 sequence preservation in mammals. E‐H, Schematic diagram representing the potential binding sites for mir15a or mir16 in the 3′UTR of INSR, IGF1R, AKT3, and SGK1 in mice, and the corresponding binding sites in humans. I‐L, Luciferase reporters with wild‐type or mutant target gene‐UTR (INSR, IGF1R, AKT3, SGK1, respectively), were cotransfected with mimic‐mir15a, mimic‐mir16‐1, or mimic‐mir NC, respectively, then luciferase activity was determined. Values are presented as relative fold change of luciferase activity in mimic‐mir15a or mimic‐mir16‐1 transfection relative to luciferase activity in mimic‐mirNC transfection (n = 3 experiments with 3 replicates). *P < .05 versus mimic‐mirNC. M and N, Western blot expression analysis of INSR (0.7‐fold, 0.6‐fold, 0.6‐fold in mir15a, mir16‐1, mir15a/mir16‐1, respectively), IGF1R (0.7‐fold, 0.8‐fold, 0.7‐fold in mir15a, mir16‐1, mir15a/mir16‐1, respectively), AKT3 (0.6‐fold, 0.5‐fold, 0.5‐fold in mir15a, mir16‐1, mir15a/mir16‐1, respectively), SGK1 (0.8‐fold, 0.8‐fold, 0.8‐fold in mir15a, mir16‐1, mir15a/mir16‐1, respectively) expression in CMs untreated (blank) or treated with mimic‐mirNC, mimic‐mir15a, mimic‐mir16‐1, or mimic‐mir15a plus mimic‐mir16‐1 (n = 2 experiments with 2 well replicates). GAPDH levels served as loading control. *P < .05 versus mimic‐mirNC. Statistical significance was determined by the two‐sided t‐test (I‐L), by 1‐way ANOVA Tukey's post hoc test (N)
FIGURE 5
FIGURE 5
Knockdown of mir15a/mir16‐1 hyperactivates insulin/IGF1 signaling. A, Western blot analysis of target genes in human heart samples from representative healthy control (n = 4) and hypertrophic hearts (n = 8). Bar graphs indicate quantitative levels of INSR (1.2‐fold), IGF1R (1.2‐fold), AKT3 (1.3‐fold), SGK1 (1.2‐fold). *P < .05 versus HC. B, Western blot analysis of target genes in hearts before (0) (n = 4) and after 4 and 8 weeks TAC (n = 3). Bar graphs indicate quantitative levels of INSR (1.3‐fold at 8 weeks), IGF1R (1.3‐fold at 8 weeks), AKT3 (1.2‐fold at 8 weeks), SGK1 (1.2‐fold at 8 weeks). *P < .05 versus before TAC. C, Western blot analysis of insulin‐IGF1 signaling‐related proteins in hearts from WT and CKO mice before (n = 2 per group) and after 8 weeks of TAC (n = 4 per group). Bar graphs indicate quantitative levels of INSR (1.2‐fold), IGF1R (1.1‐fold), AKT3 (1.2‐fold), SGK1 (1.2‐fold), p‐IRS (1.3‐fold), p‐AKT (1.2‐fold at 8 weeks), p‐SGK (1.3‐fold at 8 weeks), p‐mTOR (1.1‐fold at 8 weeks), p‐ERK (1.1‐fold at 8 weeks). *P < .05 versus WT‐TAC 8W. D, Western blot analysis of proteins levels in CMs transfected with control‐siRNA or INSR, IGF1R, AKT3, SGK1‐siRNA subjected to mir15a/mir16‐1 inhibitor treatment (50 nM) (n = 2 experiments with 2 well replicates). E‐G, CMs were transfected with control, INSR, IGF1R, AKT3, or SGK1‐siRNA for 24 hours. CMs were then treated with mir15a/mir16‐1 inhibitor and PE for another 48 hours. Hypertrophy was assessed by morphological change (E, bar = 50 um), cell surface area measurement (F), and mRNA expression of ANP (0.5‐fold in INSR‐siRNA, 0.4‐fold in IGF1R‐siRNA, 0.3‐fold in AKT3‐siRNA, 0.4‐fold in SGK1‐siRNA) and BNP (0.5‐fold in INSR‐siRNA, 0.4‐fold in IGF1R‐siRNA, 0.4‐fold in AKT3‐siRNA, 0.3‐fold in SGK1‐siRNA) (G) (n = 5 experiments with 2 well replicates). *P < 0.05 versus control‐siRNA. Statistical significance was determined by the two‐sided t‐test (A and C) or by 1‐way ANOVA Tukey's post hoc test (B, F, and G)
FIGURE 6
FIGURE 6
Replenishment of mir15a/mir16‐1 protects against cardiac hypertrophy and failure. A, In situ hybridization of mir15a and mir16‐1 in CMs transfected with CHO‐PGEA‐containing mirNC or mir15a/mir16‐1 for 24 hours. Scale bar = 25 μm. B, qRT‐PCR revealed mir15a and mir16‐1 expression in CMs transfected with CHO‐PGEA‐containing mirNC or mir15a/mir16‐1. *< .05 versus CHO‐PGEA‐containing mirNC. C and D, CMs transfected with CHO‐PGEA‐containing mirNC or mir15a/mir16‐1 followed by PE at dosage of 100 nM (C) or recombinant murine IGF1(Peprotec, #250‐19) at dosage of 30 ng/mL (D) stimuli for 24 hours. Hypertrophy is assessed by sarcomere organization (bar = 25 um) and cell surface area measurement. *P < .05 versus CHO‐PGEA‐containing mirNC. E, Protocol for CHO‐PEGA‐containing mir15a/mir16‐1 therapy in the mouse TAC heart hypertrophy model. F, qRT‐PCR revealing cardiac mir15a and mir16‐1 expression in mice subjected to CHO‐PEGA‐mirNC or mir15a/mir16‐1 treatment for 4 weeks (n = 8 per group). *P < .05 versus CHO‐PEGA‐ mirNC. G, M‐mode echocardiographic imaging and EF analysis of mice treated with CHO‐PEGA‐mir NC or CHO‐PEGA‐mir 15a/mir16‐1 before and after 2 and 4 weeks TAC. # P < .05 versus CHO‐PEGA‐mir NC‐TAC. H‐M, Whole‐mount representation of heart and heart weight/body weight/tibia length ratios (H), WGA stained section of left ventricles and quantification of myocyte cross‐sectional area (I), ANP mRNA expression (0.5‐fold at 4 weeks) (J), representative image of perivascular (K) and interestitital fibrosis (L) and quantification of fibrotic area, Col1A1 mRNA expression (0.6‐fold at 4 weeks) (M) in mice treated with CHO‐PEGA‐mir NC or CHO‐PEGA‐mir15a/mir16‐1 before and after 4 weeks TAC (n = 6 per group). *P < .05 versus mice before TAC; # P < .05 versus CHO‐PEGA‐mir NC‐TAC. I, Bars = 50 μm; K and L, Bars = 100 μm. N, Western blot analysis of insulin‐IGF1 signaling‐related proteins in hearts from CHO‐PEGA‐mirNC or mir15a/mir16‐1 treated mice after 4 weeks of TAC. Bar graphs indicate quantitative levels of INSR (0.7‐fold), IGF1R (0.7‐fold), AKT3 (0.8‐fold), SGK1 (0.8‐fold), p‐IRS (0.2‐fold), p‐AKT (0.8‐fold), p‐SGK (0.9‐fold), p‐mTOR (0.7‐fold), p‐ERK (0.1‐fold) (n = 6 per group). *P < .05 versus CHO‐PEGA‐mir NC‐TAC. O, Heatmap demonstrating differentially expressed proteins among sham‐operation mice (Sham), TAC mice treated with either CHO‐PEGA‐mir NC (mir NC‐TAC), or mir15a/mir16‐1 (mir15a/mir16‐1‐TAC) (n = 3 per group). P, A representative scatter plot of protein expression fold‐change in mir15a/mir16‐TAC versus mir NC‐TAC (y‐axis) and mirNC‐TAC versus Sham (x‐axis). Each point represents a log2 (fold‐change) value for a protein. Statistical significance was determined by the two‐sided t‐test (B‐D and F‐N) Abbreviation: PCC, Pearson's correlation coefficient.
FIGURE 7
FIGURE 7
Decreased mir15a/mir16‐1 levels associated with LVH in hypertensive patients. A, Flow diagram for assessing the predictive value of serum mir15a‐5p and mir16‐5p for LVH incidence in hypertensive patients. B, qRT‐PCR analysis of mir15a‐5p and mir16‐5p expression at admission in hypertensive patients with (n = 32) or without (n = 228) incidental LVH during follow‐up. C, Univariate and multivariate Cox regression analyses of mir15a‐5p and mir16‐5p levels for incident LVH. Model 1 was adjusted for diabetes mellitus, coronary heart disease, body mass index, and estimated glomerular filtration rate, and LV mass index at admission; model 2 was adjusted for medication treatment of β‐blockers, angiotensin‐converting enzyme inhibitor/angiotensin receptor blocker, calcium antagonists, and diuretics. D and E, The prognostic values of mir15a‐5p or mir16‐5p levels for LVH were determined by Kaplan‐Meier and log‐rank test. Statistical significance was determined by the two‐sided t‐test (B), by Cox regression analysis (C), by log‐rank test (D and E)

References

    1. Heineke J, Molkentin JD. Regulation of cardiac hypertrophy by intracellular signalling pathways. Nat Rev Mol Cell Biol. 2006;7(8):589‐600. - PubMed
    1. Hill JA, Olson EN. Cardiac plasticity. N Engl J Med. 2008;358(13):1370‐1380. - PubMed
    1. Selvetella G, Hirsch E, Notte A, Tarone G, Lembo G. Adaptive and maladaptive hypertrophic pathways: points of convergence and divergence. Cardiovasc Res. 2004;63(3):373‐380. - PubMed
    1. Bisping E, Wakula P, Poteser M, Heinzel FR. Targeting cardiac hypertrophy: toward a causal heart failure therapy. J Cardiovasc Pharmacol. 2014;64(4):293‐305. - PubMed
    1. Vegter EL, van der Meer P, de Windt LJ, Pinto YM, Voors AA. MicroRNAs in heart failure: from biomarker to target for therapy. Eur J Heart Fail. 2016;18(5):457‐468. - PubMed