

Performance of seven consumer sleep-tracking devices compared with polysomnography
- PMID: 33378539
- PMCID: PMC8120339
- DOI: 10.1093/sleep/zsaa291
Performance of seven consumer sleep-tracking devices compared with polysomnography
Abstract
Study objectives: Consumer sleep-tracking devices are widely used and becoming more technologically advanced, creating strong interest from researchers and clinicians for their possible use as alternatives to standard actigraphy. We, therefore, tested the performance of many of the latest consumer sleep-tracking devices, alongside actigraphy, versus the gold-standard sleep assessment technique, polysomnography (PSG).
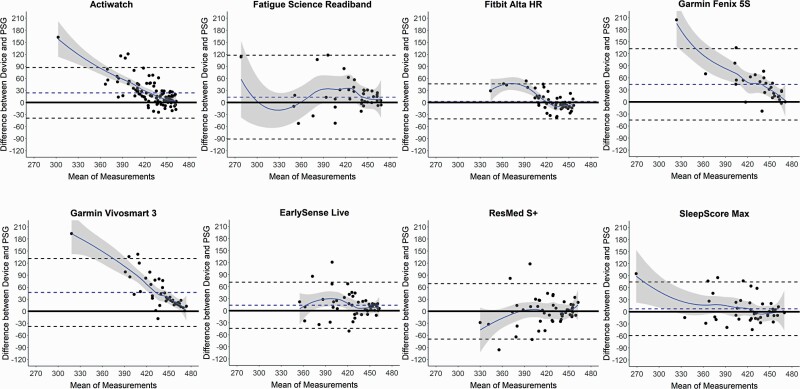
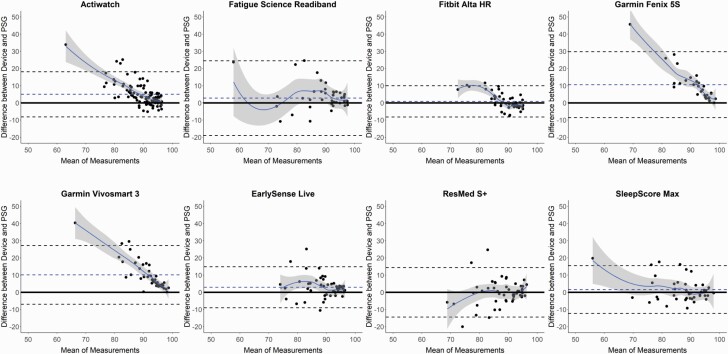
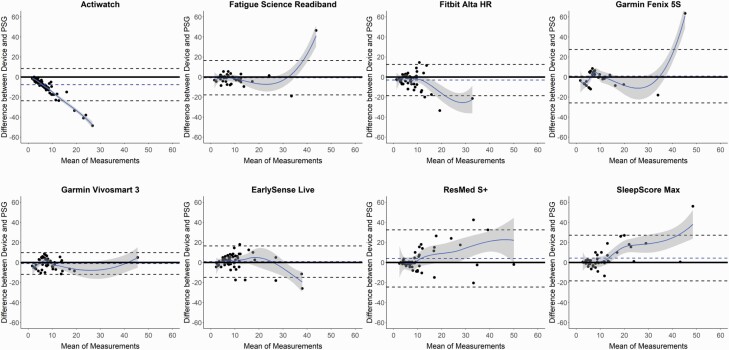
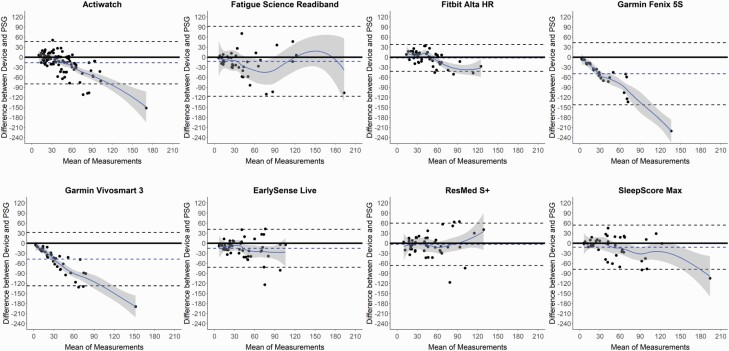
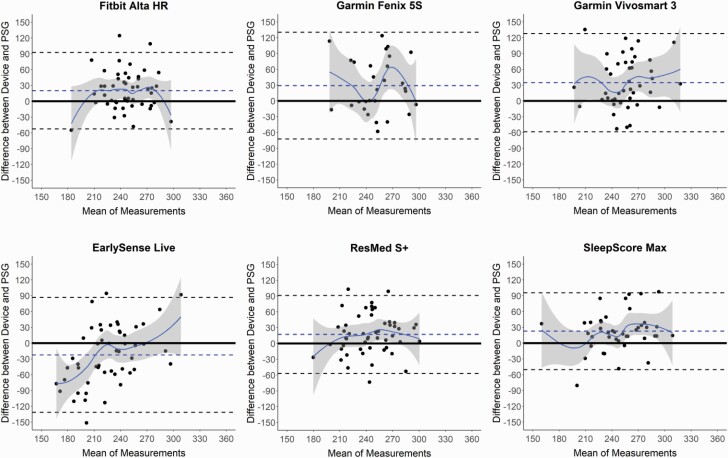
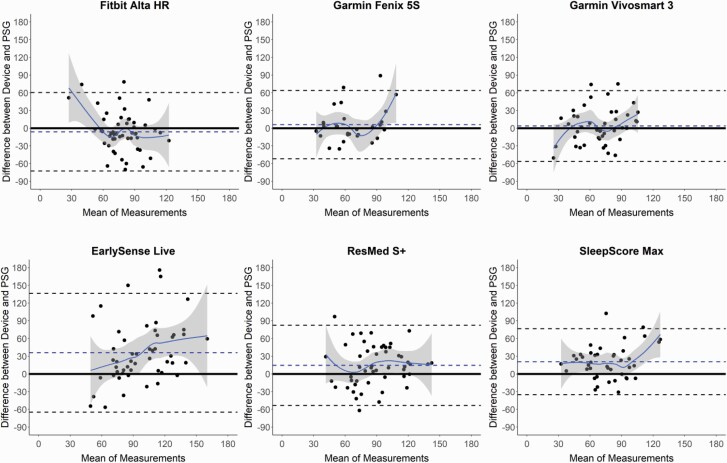
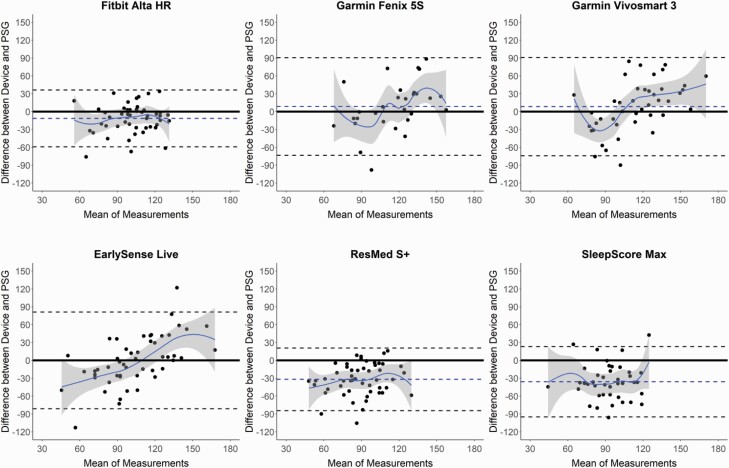
Methods: In total, 34 healthy young adults (22 women; 28.1 ± 3.9 years, mean ± SD) were tested on three consecutive nights (including a disrupted sleep condition) in a sleep laboratory with PSG, along with actigraphy (Philips Respironics Actiwatch 2) and a subset of consumer sleep-tracking devices. Altogether, four wearable (Fatigue Science Readiband, Fitbit Alta HR, Garmin Fenix 5S, Garmin Vivosmart 3) and three nonwearable (EarlySense Live, ResMed S+, SleepScore Max) devices were tested. Sleep/wake summary and epoch-by-epoch agreement measures were compared with PSG.
Results: Most devices (Fatigue Science Readiband, Fitbit Alta HR, EarlySense Live, ResMed S+, SleepScore Max) performed as well as or better than actigraphy on sleep/wake performance measures, while the Garmin devices performed worse. Overall, epoch-by-epoch sensitivity was high (all ≥0.93), specificity was low-to-medium (0.18-0.54), sleep stage comparisons were mixed, and devices tended to perform worse on nights with poorer/disrupted sleep.
Conclusions: Consumer sleep-tracking devices exhibited high performance in detecting sleep, and most performed equivalent to (or better than) actigraphy in detecting wake. Device sleep stage assessments were inconsistent. Findings indicate that many newer sleep-tracking devices demonstrate promising performance for tracking sleep and wake. Devices should be tested in different populations and settings to further examine their wider validity and utility.
Keywords: actigraphy; nearables; noncontact; polysomnography; sensors; sleep technology; validation; wearables.
© Sleep Research Society 2020. Published by Oxford University Press on behalf of the Sleep Research Society.
Figures
Comment in
-
Sleep-tracking technology in scientific research: looking to the future.Sleep. 2021 May 14;44(5):zsab071. doi: 10.1093/sleep/zsab071. Sleep. 2021. PMID: 33782687 Free PMC article. No abstract available.
References
-
- Breslau N, et al. Sleep disturbance and psychiatric disorders: a longitudinal epidemiological study of young adults. Biol Psychiatry. 1996;39(6):411–418. - PubMed
-
- Belenky G, et al. Patterns of performance degradation and restoration during sleep restriction and subsequent recovery: a sleep dose–response study. J Sleep Res. 2003;12(1):1–12. - PubMed
Publication types
MeSH terms
LinkOut - more resources
Full Text Sources
Other Literature Sources
Medical
