. 2021 Feb 8;56(3):366-382.e9.
doi: 10.1016/j.devcel.2020.12.004. Epub 2020 Dec 29.

Inducible Stem-Cell-Derived Embryos Capture Mouse Morphogenetic Events In Vitro

Affiliations

Inducible Stem-Cell-Derived Embryos Capture Mouse Morphogenetic Events In Vitro

Gianluca Amadei et al. Dev Cell. .

Abstract

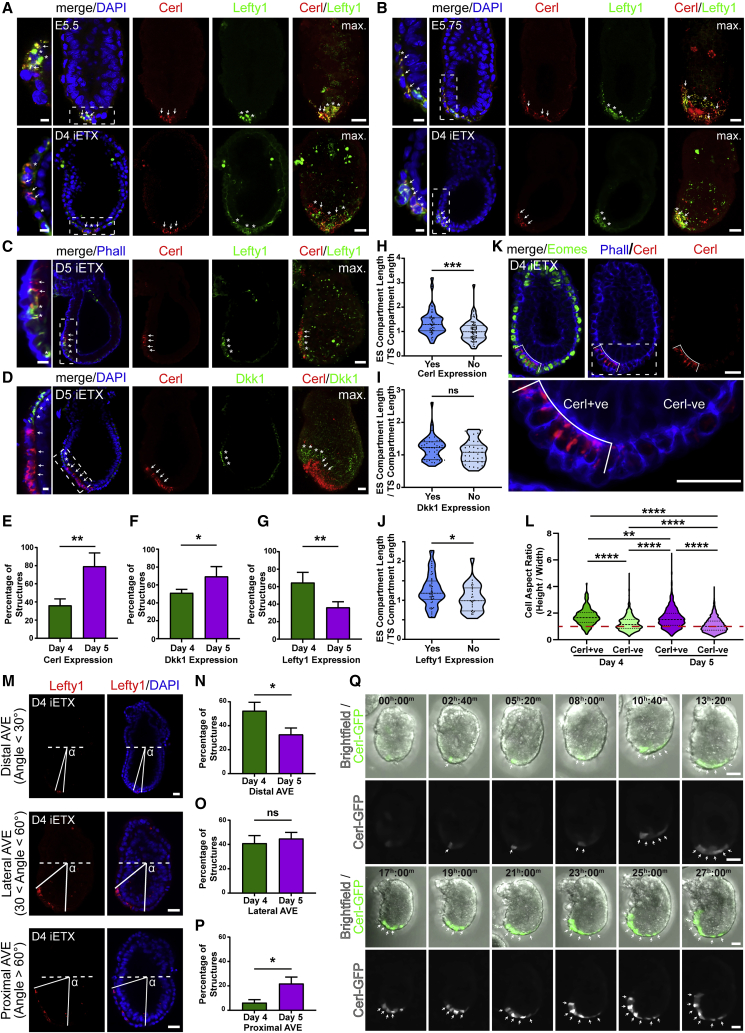
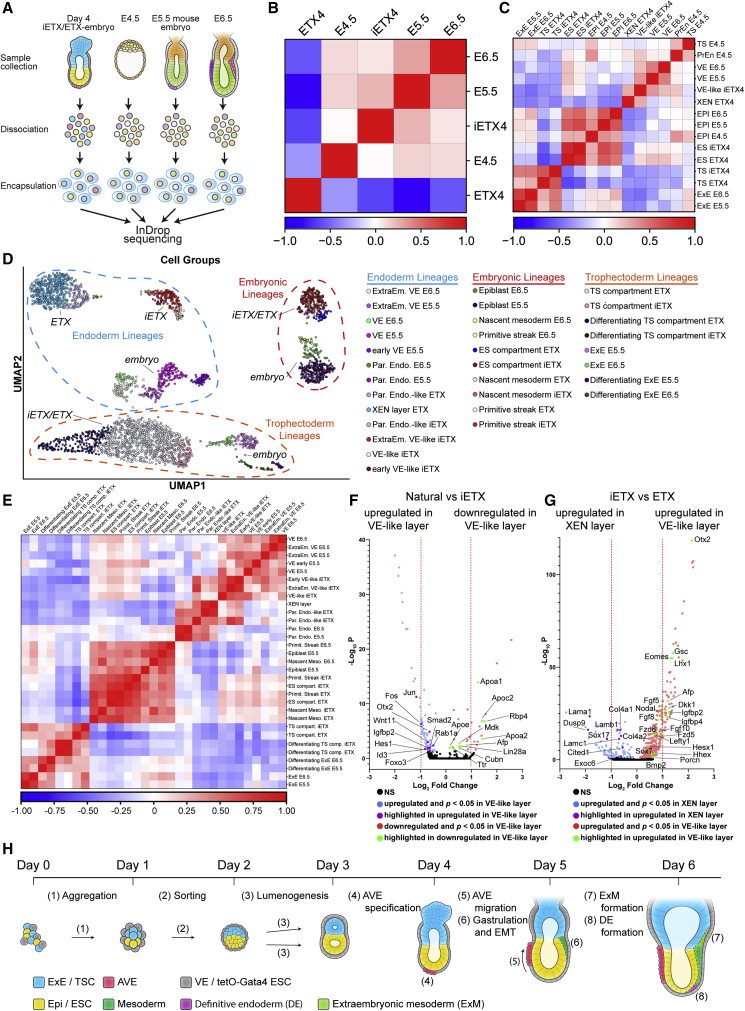
The development of mouse embryos can be partially recapitulated by combining embryonic stem cells (ESCs), trophoblast stem cells (TS), and extra-embryonic endoderm (XEN) stem cells to generate embryo-like structures called ETX embryos. Although ETX embryos transcriptionally capture the mouse gastrula, their ability to recapitulate complex morphogenic events such as gastrulation is limited, possibly due to the limited potential of XEN cells. To address this, we generated ESCs transiently expressing transcription factor Gata4, which drives the extra-embryonic endoderm fate, and combined them with ESCs and TS cells to generate induced ETX embryos (iETX embryos). We show that iETX embryos establish a robust anterior signaling center that migrates unilaterally to break embryo symmetry. Furthermore, iETX embryos gastrulate generating embryonic and extra-embryonic mesoderm and definitive endoderm. Our findings reveal that replacement of XEN cells with ESCs transiently expressing Gata4 endows iETX embryos with greater developmental potential, thus enabling the study of the establishment of anterior-posterior patterning and gastrulation in an in vitro system.

Keywords: EMT; embryogenesis; gastrulation; gastruloid; induced ETX-embryos; stem cells.


Conflict of interest statement

Declaration of interests The authors declare no competing interests.

Figures

None
Graphical abstract
Figure 1
Figure 1
Treated CAG-tetOG4 ESCs Express Endodermal Markers and Contribute to Primitive Endoderm (PrEn) in Chimeras (A) Gata4 mRNA expression in CAG-tetOG4 ESCs in N2B27 2iLIF (left, n = 4), FC 2iLIF (center, n = 4), and IDG 2iLIF (right, n = 3) after 6 h Dox treatment or control. Error bars, SD. (B) Top panel: CAG-tetOG4 ESC aggregates in control condition (top row) or Dox (bottom row), analyzed after 24 h for Gata4 (green, Alexa488), Sox17 (red, Alexa647), mCherry (gray), and DAPI (blue) (control, 49/49 structures; Dox, 37/37 structures; n = 3 each). Scale bar, 20 μm. Bottom panel: same as top, analyzed for Gata6 (green, Alexa488), Oct4 (red, Alexa647), mCherry and Podxl (gray, Alexa568), and DAPI (blue) (control, 49/52 structures; Dox, 45/45 structures; n = 3 each). Scale bar, 20 μm control and 15 μm Dox. Endogenous CAG-GFP in the green channel of control but downregulated in Dox (see Figure S1A). Below, quantification of the percentage of cells with the specified marker combinations in control and Dox aggregates. In the graphs, each dot is an aggregate. (C) Schematic of chimera aggregation: CAG-tetOG4 ESCs treated with Dox for 6 h or untreated and aggregated with E2.5 wild-type embryos. Contribution to either EPI or PrEn was assessed at E4.5. TE, trophectoderm. (D) Chimeras as in (C) analyzed for Sox17 (gray), CAG-GFP (green, with αGFP), and DAPI (blue). Contribution to PrEn with Dox-treated cells (bottom rows): 17/43 embryos from 3 females, 39%. Contribution to EPI of control cells (top rows): 22/22 embryos from 3 females. Scale and zoomed scale: 20 μm. Arrows, Sox17/CAG-GFP+ve cells; arrowhead, Sox17+ve/CAG-GFP-ve cells. In the graph, percentage of inner cell mass cells with PrEn identity was quantified. Each dot is an embryo. (E) CAG-tetOG4 ESC aggregates generated by combining cells either grown in control (top row), or Dox-treated cells for 6 hr (middle) or a 50:50 mixture of control and Dox-treated cells (bottom) and analyzed after 72 h for Gata6 (green), Oct4 (red), Podxl (gray), and DAPI (blue). Control: 41/43 aggregates, Dox: 55/56, 50:50: 60/65; n = 3 each. Scale bar, 20 μm. p < 0.05,∗∗p < 0.01, ∗∗∗∗p < 0.0001, ns, nonsignificant. See also Figure S1.
Figure 2
Figure 2
iETX Embryos Express Canonical Post-implantation Embryo Markers (A) Top: Time course and schematic of iETX embryo generation from cell seeding on day 0 to day 5. Bottom: Images of a representative iETX embryos at specific time points. Scale bar, 100 μm. (B) The contents of a single AggreWell were collected at day 4 to quantify formation efficiency of iETX embryos. ES compartment and VE-like layer express CAG-GFP; the TS compartment is unlabeled. Scale bar, 200 μm. Panels (right) highlight representative structures such as well-formed iETX embryos (1 and 2); an inflated iETX embryo (3); a well-formed iETX embryo in the process of inflating (4). Scale bar, 150 μm. (C) Quantification of iETX embryo formation at either 3 or 4 days. Day 3 = 1,542/4,187 structures (n = 4); day 4 = 960/4,410 structures (n = 4). Error bar: SD. (D) Time-lapse still images of iETX embryo formation over the course of 67 h. Top: The ES compartment and VE-like layer express CAG-GFP; TS compartment is unlabeled. Bottom, CAG-GFP ESCs alone (gray). White arrowheads highlight TS cells, yellow arrow and asterisk the forming ES lumen. Six examples. Scale bar, 30 μm. (E) iETX embryos at 1 day of development. ES and TS compartment are enclosed with a dashed line. Dox-treated CAG-tetOG4 ESCs transiently express mCherry and downregulate CAG-GFP (arrows). 91/109 structures from 2 independent experiments. Scale bar, 30 μm. (F–I) iETX embryo at day 4 stained for (F) Gata6 (green), Oct4 (gray), and Eomes (red) (41/42 structures). (G) Gata4 (green), Oct4 (gray), and Ap2γ (red) (18/19 structures). (H) iETX embryo at day 4 stained for Sox17 (green), Oct4 (gray), and Cdx2 (red) (21/21). (I) iETX embryo at day 3 stained for Otx2 (purple), Eomes (green), and DAPI (blue) (27/31). (F–H) n = 3 each; scale, 30 μm. (I) n = 3; scale bar, 20 μm. (J) Lineage quantification in iETX embryos in comparison with E5.5 and ETX embryos. 15 iETX, n = 3; 10 ETX and 10 E5.5 embryos, n = 3: from (Sozen et al., 2018). Error bars: SD. p < 0.05,∗∗p < 0.01, ∗∗∗∗p < 0.0001, ns, nonsignificant. See also Figure S2.
Figure 3
Figure 3
iETX Embryos Form a Migrating Anterior VE (AVE) (A and B) Wild-type embryos (top) at E5.5 (A) or E5.75 (B) and representative iETX embryo at day 4 (bottom) analyzed for Cerl (red, arrows), Lefty1 (green, asterisks), and DAPI (blue); max, maximum projection. Embryos: (A and B) 1 example each. iETX embryo: (A) 8/16 examples; (B) 8/16 examples, n = 3 each; scale bar, 20 μm. (C and D) Representative iETX embryo at day 5 analyzed for Cerl (red, arrows), Lefty1 (C, green, asterisks), Dkk1 (D, green, asterisks), and DAPI or Phalloidin (blue). (C) 23/63 structures. (D) 46/73 structures, n = 3 each; max., maximum projection; scale bar, 30 μm. (A–D) Dashed rectangles are magnified on the left. Scale bar, 10 μm. (E–G) Expression of Cerl (E), Dkk1 (F), and Lefty (G) at 4 and 5 days in iETX embryos (Cerl: 38/106 [day 4, n = 3] and 133/171 [day 5, n = 4]; Dkk1: 46/89 [day 4, n = 5] and 52/73 [day 5, n = 3]; and Lefty1: 58/89 [day 4, n = 3] and 32/87 [day 5, n = 4] structures). Error bars, SD. (H–J) Plot of ES/TS length ratio of iETX embryos at day 4 with or without Cerl (H), Dkk1 (I), and Lefty1. (J) Cerl: yes, 38; no, 68; n = 3. Dkk1: yes, 43; no, 34 structures; n = 5. Lefty1: yes, 47; no, 25; n = 3. (K) Representative iETX embryo at day 4 analyzed for Cerl (red), Phalloidin (blue) and Eomes (green). Rectangle below shows Cerl+ve and −ve domains. Scale bar, 30 μm. (L) Cell aspect ratio quantification of the Cerl+ve and Cerl−ve domain in iETX embryos at days 4 and 5. Day 4 = 31 iETX embryos, n = 3. Cerl+ve group: 206 cells; Cerl−ve group: 779 cells. Day 5 = 128 iETX embryos, n = 3; Cerl+ve domain: 1,656 cells; Cerl−ve domain: 3,856 cells. In all violin plots, median and quartiles are shown. Line at 1 separates cuboidal/columnar shape ratio. (M) iETX embryos at day 4 analyzed for Lefty1 (red) and DAPI (blue); the AVE angle was traced as the Lefty1+ve cell closest to the ES/TS boundary and the distal tip. Scale bar, 30 μm. (N−P) iETX embryos at 4 and 5 days scored according to the position of the AVE: distal (N), lateral (O), and proximal (P) as described in (M). (N) day 4: 67/142 n = 11. day 5: 79/217 n = 11. (O) day 4: 63/142 n = 11. day 5: 93/217 n = 11. (P) day 4: 12/142 n = 11. day 5: 45/217 n = 11. Error bars: SEM. (Q) Time-lapse stills of AVE formation and migration in a Cerl-GFP reporter iETX embryo filmed from day 3 of development. Top and third row: Cerl-GFP+ve cells are green, every other cell is gray. Second and bottom row: Cerl-GFP+ve cells in gray (arrows). For DVE induction, 34 structures, n = 3, 12/34: induction at the distal tip; 8/34: Cer-GFP was already present; 12/34: no GFP upregulation; 2/34: signal was not induced at the tip. For AVE migration, 32 structures, n = 3, 11/32: migration, 10/32: no migration. 11/32: no signal. Scale bar, 30 μm. p < 0.05, ∗∗p < 0.01, ∗∗∗p < 0.001, ∗∗∗∗p < 0.0001, ns, nonsignificant. See also Figure S3.
Figure 4
Figure 4
iETX Embryos Specify Anterior and Posterior Domains on Opposite Sides (A) E6.5 embryo with Cerl (red, arrows), Bry (green, asterisks), and Oct4 (gray). Natural embryo: 2 examples. (B) iETX embryo at day 5 analyzed for Cerl (red, arrows), Bry (green, asterisks), and Oct4 (gray). iETX embryos: 38/69 structures, n = 4. Scale bar, 30 μm. (C) Schematic of possible Bry/Cerl position combinations: opposite sides, same side, or Cerl is at the distal tip. (D) Scoring iETX embryo at 5 days of development according to (C). Opposite = 33 structures, same side = 0, distal = 4, n = 4. (E) iETX embryo at day 5 analyzed for Cerl (red, white arrows), Dkk1 (green, asterisk), Eomes (gray, yellow arrows), and DAPI (blue); max., maximum projection; 29/69, n = 3. Scale bar, 30 μm. (F) Scoring iETX embryos at day 5 according to the position of Cerl+ve/Dkk1+ve domain in relation to Eomes. Opposite = 28, same side = 1, distal = 2, n = 3. (G) Same as (E) but with Lefty1 (green, asterisks) and Phalloidin (blue). 18/54 examples, n = 3. Scale bar, 30 μm. (H) Same as (F) but with Cerl/Lefty1 in relation to Eomes. Opposite = 19, same side = 1, distal = 1, n = 3. (I) Representative iETX embryo at day 5 with ectopic Bry and analyzed for Cerl (red, white arrows), Bry (gray, yellow arrows), Oct4 (green), and Phalloidin (blue). Scale bar, 30 μm. 11/31, n = 4. (J) Scoring iETX embryo at 5 days according to the position of Cerl in relation to the posterior domain (Bry or Eomes) as described in Figure S4D. Non-ectopic = 5, ectopic = 28, equal sides = 3, distal Cerl = 25, n = 8. (A, B, E, G, and I) Dashed rectangles are magnified on the right. Scale bar, 10 μm. (D, F, H, J) Error bars, SD. ∗∗p < 0.01, ∗∗∗p < 0.001, ∗∗∗∗p < 0.0001. See also Figure S4.
Figure 5
Figure 5
iETX Embryos Undergo EMT and Gastrulation at Day 5 (A) (Top) E6.75 mouse embryo (1 example) and (bottom) iETX embryo at day 5 (21/31 examples, n = 3) analyzed for Cerl (red, arrows), Bry (green, asterisks), Oct4 (gray), and DAPI (embryo, blue) or Phalloidin (iETX embryo, blue). Rectangles are on the right. Scale bar, 30 μm. (B) Orthogonal sections along the dashed lines in (A) to show mesodermal wings. Markers are same as (A). Scale bar, 30 μm. (C) iETX embryo at 5 days of development analyzed for Bry (green), Oct4 (red), and Phalloidin (gray). Orthogonal sections in the xz from indicated dashed lines are at the bottom (1, 2, 3) to highlight mesodermal wings and EMT in the structure (28 examples, n = 3). Scale bar, 30 μm. (D) Time-lapse stills of an iETX embryo imaged from day 4 to day 5. Top row: TS cells are in gray, wild-type CAG-GFP and induced CAG-tetOG4 are in green. Center row: CAG-GFP cells are displayed in gray. Dashed squares are magnified at the bottom and highlight the prospective posterior side. 6/13 structures with comparable EMT, n = 3. Scale bar, 50 μm. (E) Measurement of the thickness of the anterior, nongastrulating side (purple dots), and the posterior, gastrulating side (green dots) over time in the iETX embryo in (D). Error bars, SD. (F) Measurement of iETX embryo length (green dots) and extending PS length over time for the iETX embryo in (D). (G) iETX embryo at day 6 analyzed for Bry (green), N-Cad (red), laminin (gray), and DAPI (blue). PS (white arrows) and breached basement membrane (yellow arrows) at the posterior are highlighted. Squares below highlight (3) the gastrulating posterior, analyzed with Bry (green), N-Cad (red) and laminin (gray), and laminin (fire). Arrows: Bry/N−Cad+ve cells undergoing EMT; arrowheads: intact laminin; asterisks: ruptured laminin tract. Panels (1) and (2) show anterior and distal tip without N-Cad and with intact laminin tract (arrowheads). 21/24 examples, n = 4. Scale bar, 30 μm. (H) iETX embryo at day 5 analyzed for DAPI (gray), Bry (blue), E-Cad (green), and N-Cad (magenta); rectangle is shown on the right. Scale bar, 30 μm. Below, quantification of Bry, E-Cad, and N-Cad expression in the anterior EPI and PS. Mean fluorescent intensities of the markers were normalized to DAPI intensity. 20 examples, n = 3. Error bars, SEM. (I) iETX embryo at day 5 generated with a Snail-YFP reporter line and analyzed for DAPI (gray), Oct4 (blue), Bry (red), and Snail-YFP (green, αGFP). Dashed line marks the PS. White rectangle is on the right. Scale bar, 30 μm. 27/42, n = 3. Bottom, left: quantification of Bry+ve, Snail/Bry+ve, and Snail+ve cells in iETX embryos. Each dot is an iETX embryo. Bottom, right: percentage of Snail+ve cells found in the ES comp. or PS. Each dot is an iETX embryo, 13 examples, n = 3. In all violin plots, median and quartiles are shown. p < 0.05, ∗∗p < 0.01, ∗∗∗∗p < 0.0001, ns, nonsignificant. See also Figure S5.
Figure 6
Figure 6
iETX Embryos Generate Heterogeneity in the Primitive Streak and Form Definitive Endoderm (A, C, and E) Natural embryos at late E6.75 analyzed for DAPI (magenta) and (A) Cerl (green), (C) Dkk1 (green), and (E) Lefty1 (green). The maximum projection of Cerl, Dkk1, and Lefty1 is in the right panels. Dashed line marks the PS. (Cerl, Dkk1, and Lefty1: 3 embryo examples each) Scale bar, 30 μm. (B, D, and F) iETX embryos collected at 5 days of development and analyzed for (B) Bry (red), (D and F) Eomes (red) and (B) Cerl (green), (D) Dkk1 (green), and (F) Lefty1 (green), (B) Oct4 (blue), and (D and F) Phalloidin (blue). Cerl, Dkk1, and Lefty1 maximum projection is in the right panels. Dashed rectangles are magnified on the right. (Cerl: 17/33, n = 3; Dkk1: 21/56, n = 3; Lefty1: 27/34, n = 3) (A–F): white arrows indicate the AVE and white arrowheads posterior expression of the AVE marker; (A–P) indicates the anterior-posterior axis. Scale bar, 30 μm. Cerl, Lefty1 and Dkk1 in these panels were visualized using Alexa-568 or Alexa-647 secondary. Dashed rectangles scale bar, 10 μm. (G and H) E7.5 mouse embryo (G) and iETX embryo at day 6 of development (H) analyzed for FoxA2 (red), Bry (green), and DAPI (blue); dashed squares are magnified on the right (Embryo: 2 examples; iETX embryo: correct patterning: 45/52; extended streak: 37/52, n = 6). Scale bar, 30 μm. (I and J) E7.5 mouse embryo (I) and iETX embryo at day 6 of development (J) analyzed for FoxA2 (red), Sox17 (green), and DAPI (blue); dashed squares are on the right (Embryo: 3 examples; iETX embryo: extended streak with Sox17/FoxA2 in 17/31 examples, n = 3). Scale bar, 30 μm. See also Figure S6 and Table S1.
Figure 7
Figure 7
The VE-like Layer Formed by CAG-tetOG4 ES Cells Is More Similar to Natural VE (A) Schematic of inDrop sequencing. (B) Global correlation matrix of natural embryos (E4.5, E5.5, and E6.5) and ETX and iETX embryos (day 4). (C) Correlation matrix with the same samples in (B) subdivided according to their lineage. Natural samples: EPI, ExE, VE, and PrEn; ETX embryos: embryonic stem cell compartment (ES comp), trophoblast stem cell compartment (TS comp), extra-embryonic endoderm stem cell layer (XEN layer), and tetoG4 cell-derived layer (VE-like layer). (D) Single-cell sequencing UMAP and sample separation in subpopulations based on sample type (natural versus ETX), age (E5.5, E6.5, and day 4) and developmental stage. Developmental stage classification was based on leiden clusters and the markers in Figure S7A. (E) Correlation matrix of the single-cell subpopulations in (D). (F and G) Volcano plot of genes downregulated or upregulated in the VE-like layer of iETX embryos versus natural VE (F) or of genes upregulated in the VE-like layer of iETX embryos versus upregulated in the XEN layer of ETX embryos (G). (H) Summary: Dox-treated, induced tetOG4 ESCs combined with wild-type ES and TS cells aggregate and sort to generate structures organized into discreet ES and TS compartments surrounded by a VE-like layer, called induced ETX embryos. iETX embryos open a lumen between day 2 and day 3 and establish the AVE at day 4, which then migrates between day 4 and day 5 to establish the anterior domain. On the opposite side at day 5, Bry and Eomes expression in the ES compartment indicates formation of the posterior domain. On day 5 and onward, the posterior domain undergoes EMT and gastrulation, forming embryonic and extra-embryonic mesoderm and definitive endoderm. See also Figure 7; Table S2.

References

    1. Andrews S. FastQC: a quality control tool for high throughput sequence data. 2010. https://www.bioinformatics.babraham.ac.uk/projects/fastqc/
    1. Arnold S.J., Robertson E.J. Making a commitment: cell lineage allocation and axis patterning in the early mouse embryo. Nat. Rev. Mol. Cell Biol. 2009;10:91–103. - PubMed
    1. Bedzhov I., Leung C.Y., Bialecka M., Zernicka-Goetz M. In vitro culture of mouse blastocysts beyond the implantation stages. Nat. Protoc. 2014;9:2732–2739. - PubMed
    1. Bedzhov I., Zernicka-Goetz M. Self-organizing properties of mouse pluripotent cells initiate morphogenesis upon implantation. Cell. 2014;156:1032–1044. - PMC - PubMed
    1. Boroviak T., Loos R., Bertone P., Smith A., Nichols J. The ability of inner-cell mass cells to self-renew as embryonic stem cells is acquired upon epiblast specification. Nat. Cell Biol. 2014;16:516–528. - PMC - PubMed

Publication types