. 2020 Dec 29;33(13):108571.
doi: 10.1016/j.celrep.2020.108571.

Distinct Populations of Immune-Suppressive Macrophages Differentiate from Monocytic Myeloid-Derived Suppressor Cells in Cancer

Affiliations

Distinct Populations of Immune-Suppressive Macrophages Differentiate from Monocytic Myeloid-Derived Suppressor Cells in Cancer

Taekyoung Kwak et al. Cell Rep. .

Abstract

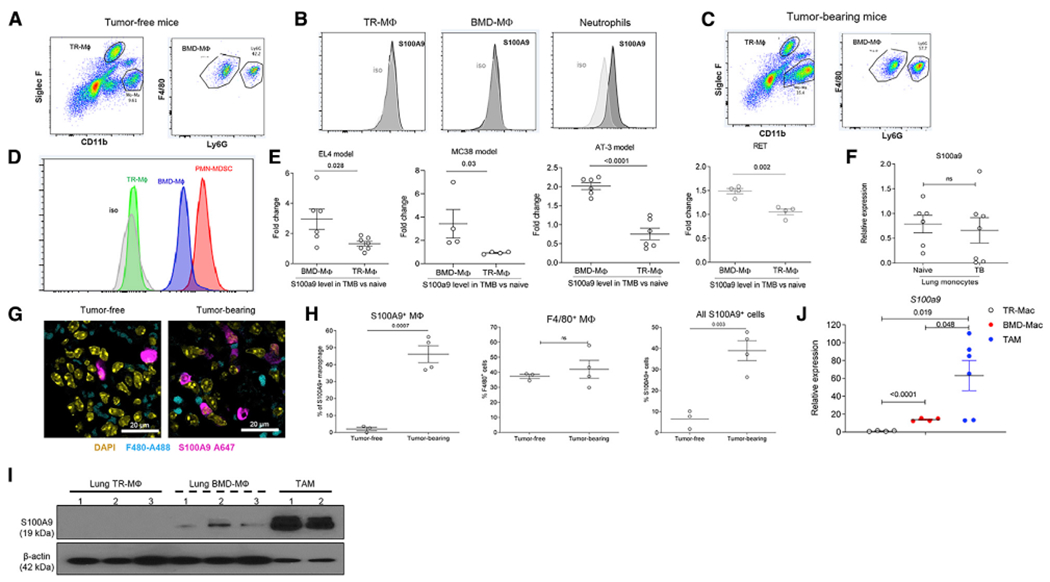
Here, we report that functional heterogeneity of macrophages in cancer could be determined by the nature of their precursors: monocytes (Mons) and monocytic myeloid-derived suppressor cells (M-MDSCs). Macrophages that are differentiated from M-MDSCs, but not from Mons, are immune suppressive, with a genomic profile matching that of M-MDSCs. Immune-suppressive activity of M-MDSC-derived macrophages is dependent on the persistent expression of S100A9 protein in these cells. S100A9 also promotes M2 polarization of macrophages. Tissue-resident- and Mon-derived macrophages lack expression of this protein. S100A9-dependent immune-suppressive activity of macrophages involves transcription factor C/EBPβ. The presence of S100A9-positive macrophages in tumor tissues is associated with shorter survival in patients with head and neck cancer and poor response to PD-1 antibody treatment in patients with metastatic melanoma. Thus, this study reveals the pathway of the development of immune-suppressive macrophages and suggests an approach to their selective targeting.

Keywords: S100A9; immune suppression; myeloid-derived suppressor cells; tumor associated macrophages; tumor immunology.


Conflict of interest statement

Declaration of Interests D.I.G. is a current employee of AstraZeneca.

Figures

Figure 1.
Figure 1.. Mons and M-MDSCs Differentiate to Functionally Distinct Macrophages in Cancer Patients
(A) Relative mRNA expression of indicated genes in macrophages derived from M-MDSCs and Mons. For each patient, gene expression in macrophages derived from Mons was set as 1. Results of individual patients are shown (n = 6–9). (B) Relative protein expression (geometric mean) of indicated proteins in macrophages derived from M-MDSCs and Mons. For each patient, protein expression in macrophages derived from Mons was set as 1. Results of individual patients are shown (n = 3–11). p values in Mann-Whitney test are shown. (C) T cell proliferation stimulated by anti-CD3/CD28 dynabeads in the presence of macrophages derived from M-MDSCs or Mons measured in triplicate. CPM, counts per minute. Three experiments with similar results were performed. p values in unpaired two-tailed Student’s t test are shown. (D) Relative expression of indicated genes and proteins in macrophages derived from Mons or M-MDSCs in the presence or absence of TESs. For each individual, gene or protein expression in macrophages differentiated from Mons in the absence of TESs was set as 1 (n = 3–7).
Figure 2.
Figure 2.. Mons and M-MDSCs Differentiate to Functionally Distinct Macrophages in Mice
(A) Proliferation of splenocytes in the presence of CD3/CD28 and Mons from naive mice or M-MDSCs from EL4 TB mice. (B) Proliferation of OT-1 splenocytes in response to specific peptides in the presence of Mon-derived or M-MDSC-derived macrophages. In (A) and (B), T cell proliferation was measured in triplicate by CPM of incorporation of [3H] thymidine. Three experiments with the same results were performed. *p < 0.05; **p < 0.01 in two-sided Student’s t test. (C-E) Relative expression of indicated genes in Mon-derived and M-MDSC-derived macrophages. (F) S100a9 expression in tumor-free Mon-derived macrophage in the absence or presence of TESs. (G) Relative gene expression in lung macrophage 3 days after transfer of CD45.1 BM Mon from naive mice and CD45.2 spleen M-MDSCs from EL4 TB mice. Recipient mice: congenic CD45.1xCD45.2 tumor-free mice. Single positive CD45.1 and CD45.2 macrophages were sorted, and indicated gene expression was evaluated by qRT-PCR. In (C)-(G), results of individual mice are shown. n = 3–4. p values were calculated in two-sided Student’s t test. In all panels, mean and SD are shown.
Figure 3.
Figure 3.. S100A9 Expression in Macrophages Depends on Their Origin and State of Polarization
(A) Example of gating of TR macrophages and BMDMs in lung tissue of tumor-free mouse. (B) Example of intracellular staining for S100A9 in TR macrophages, BMDMs, and neutrophils in lung tissue of naive mouse. (C) Example of gating of TR macrophages and BMDMs in lung tissue of EL4 TB mouse. (D) Example of intracellular staining for S100A9 in TR macrophages, BMDMs, and PMN-MDSCs in lung tissue of EL4 TB mouse. (E) Relative intracellular level of S100A9 protein in TR macrophages and BMDMs in lungs of indicated TB mice normalized to the values in tumor-free mice in the experiments performed at the same time. The results of individual mice are shown (n = 4–6). Mean and SD are shown. p values were calculated in two-sided Student’s t test. (F) Relative intracellular S100A9 protein level in CD11b+Ly6ChighF4/80 cells from lungs of tumor-free and TB (EL4) mice. n = 5–7. Mean and SD are shown. (G) IHC image of lung tissue. Mouse F4/80 Alexa488 and mouse S100A9 Alexa647 antibody are used for detecting S100A9 positive macrophage. Scale bar: 20 μm. (H) Proportion of indicated population of macrophages in lungs of EL4 TB mice detected by IHC. The results of individual mice are shown (n = 3–4). Mean and SD are shown. p values were calculated in two-sided Student’s t test. (I) S100A9 protein on TR macrophages, BMDMs, and TAMs measured by western blot. TR macrophages and BMDMs were sorted from lung tissue of EL4 TB mice and TAMs from tumors of the same mice. (J) Relative gene expression of s100a9 from each sorted macrophage population described in (I). The results of individual mice are shown (n = 4–6). Mean and SD are shown. p values were calculated in two-sided Student’s t test.
Figure 4.
Figure 4.. Tumor Growth in WT, S100A9 Tg, and S100A9 KO Mice
Lewis lung carcinoma (LLC), LLC with overexpression of OVA (LLC-OVA), melanoma (B16), breast carcinoma (AT-3), lymphoma (EL4), and colon carcinoma (MC38). Each group included four mice. p values were calculated in two-way ANOVA test with correction for repeated measurements.
Figure 5.
Figure 5.. Effect of S100A9 on Suppressive Activity of Macrophages
(A) Proliferation of OT-1 splenocytes in response to specific peptides in the presence of TAMs isolated from WT or S100A9 Tg or S100A9 KO TB mice. Proliferation was measured by 3H-thymidine uptake in triplicate. Experiments were performed three times. Dotted line shows T cell proliferation in the absence of TAMs. Mean and SD are shown. p values were calculated between WT and S100A9TG or WT and S100A9KO TAMs at the same TAMs: splenocytes ratios in two-sided Student’s t test. *p < 0.05, **p < 0.01 in two-sided Student’s t test. (B) The number of TAMs in WT or S100A9 Tg mice. (C) The number of TAMs in WT and S100A9 KO mice. Mean and SD are shown. p values were calculated in two-sided Student’s t test. n = 3–4.
Figure 6.
Figure 6.. Mechanism of S100A9 Effect on Macrophages
(A) Left: proliferation of OT-1 splenocytes in the presence of specific peptides in the presence of CD11b+Gr-1+ myeloid cells from BM of WT or S100A9 Tg tumor-free mice. Right: IFN-γ ELISpot. Experiments were performed in triplicate and repeated twice. Mean and SD are shown. (B) T cell proliferation of OT-1 splenocytes in the presence of specific peptides and Mon-derived macrophages from WT or S100A9 Tg tumor-free mice. Dotted line indicates cell proliferation in the absence of macrophages. Experiments were performed in triplicate. Results of individual mice (n = 3–5) and mean and SD are shown. p values were calculated in two-sided Student’s t test. (C) Indicated gene expression in WT or S100A9 Tg Mon-derived macrophages. Expression was normalized togadph. Results of individual mice (n = 3) and mean and SD are shown. p values were calculated in two-sided Student’s t test. (D) Relative expression of cebpb in WT or S100A9 Tg TAMs isolated from LLC TB mice. (E) Expression of C/EBPβ-targeted genes in WT, S100A9Tg, and S100AKO TAMs isolated from LLC TB mice. Expression was normalized to gadph. Results of individual mice (n = 3–5) and mean and SD are shown. p values were calculated in two-sided Student’s t test. (F) Expression of C/EBP-β-targeted genes in BMDMs or TR macrophages isolated from lung tissue of EL4 TB mice. Expression was normalized to actb. Results of individual mice (n = 4) and mean and SD are shown. p values were calculated in two-sided Student’s t test. (G) Expression of Arg-1 in control siRNA or C/EBP-β siRNA S100A9 Tg Mon-derived macrophages. n = 4. (H) Proliferation of OT-1 splenocytes in response to specific peptides in the presence of Mon-derived macrophages treated with control siRNA or C/EBP-β siRNA. n = 5. Dotted line indicates cell proliferation in the absence of macrophages. Mean and SD are shown. p values were calculated in two-sided Student’s t test.
Figure 7.
Figure 7.. Clinical Association of S100A9-Positive Macrophages
(A) Analysis of S100A9 gene expression from cancer patients compared with adjacent normal tissues. The results were based on The Cancer Genome Atlas (TCGA) Research Network (https://www.cancer.gov/tcga). For computational analysis, the results were generated by The Cancer Immunome Atlas (TCIA) (https://tcia.at/home). (B) Survival in 41 patients with head and neck cancer based on staining of TAMs. Patients were split based on the median number of indicated cells per 0.65 mm2. Chi square was calculated. (C) Number of indicated populations of TAMs per 0.65 mm2 in patients treated with pembrolizumab. Tissues were collected prior to the start of therapy. Results of individual patients as well as mean and SD are shown.

References

    1. Arts RJW, Moorlag SJCFM, Novakovic B, Li Y, Wang SY, Oosting M, Kumar V, Xavier RJ, Wijmenga C, Joosten LAB, et al. (2018). BCG Vaccination Protects against Experimental Viral Infection in Humans through the Induction of Cytokines Associated with Trained Immunity. Cell Host Microbe 23, 89–100.e5. - PubMed
    1. Austermann J, Spiekermann C, and Roth J (2018). S100 proteins in rheumatic diseases. Nat. Rev. Rheumatol 14, 528–541. - PubMed
    1. Baratelli F, Lin Y, Zhu L, Yang SC, Heuzé-Vourc’h N, Zeng G, Reckamp K, Dohadwala M, Sharma S, and Dubinett SM (2005). Prostaglandin E2 induces FOXP3 gene expression and T regulatory cell function in human CD4+ T cells. J. Immunol 175, 1483–1490. - PubMed
    1. Bekkering S, Arts RJW, Novakovic B, Kourtzelis I, van der Heijden CDCC, Li Y, Popa CD, Ter Horst R, van Tuijl J, Netea-Maier RT, et al. (2018). Metabolic Induction ofTrained Immunitythrough the Mevalonate Pathway. Cell 172, 135–146.e9. - PubMed
    1. Binnewies M, Roberts EW, Kersten K, Chan V, Fearon DF, Merad M, Coussens LM, Gabrilovich DI, Ostrand-Rosenberg S, Hedrick CC, et al. (2018). Understanding the tumor immune microenvironment (TIME) for effective therapy. Nat. Med 24, 541–550. - PMC - PubMed

Publication types

MeSH terms