

Ultrasensitive bio-detection using single-electron effect
- PMID: 33379008
- PMCID: PMC7554471
- DOI: 10.1016/j.talanta.2020.121769
Ultrasensitive bio-detection using single-electron effect
Abstract
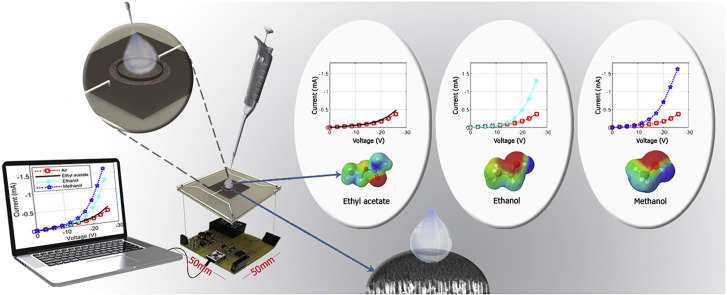
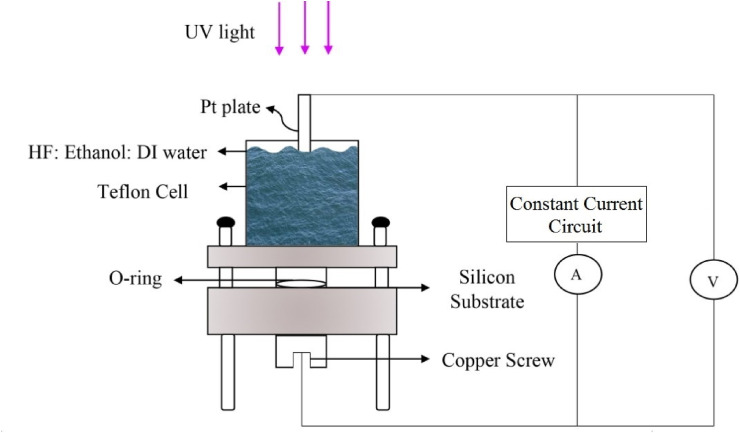
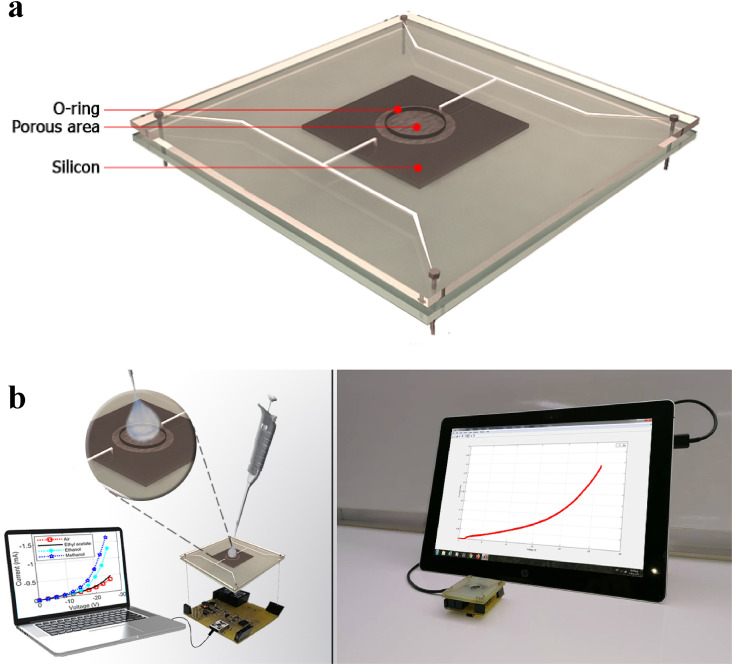
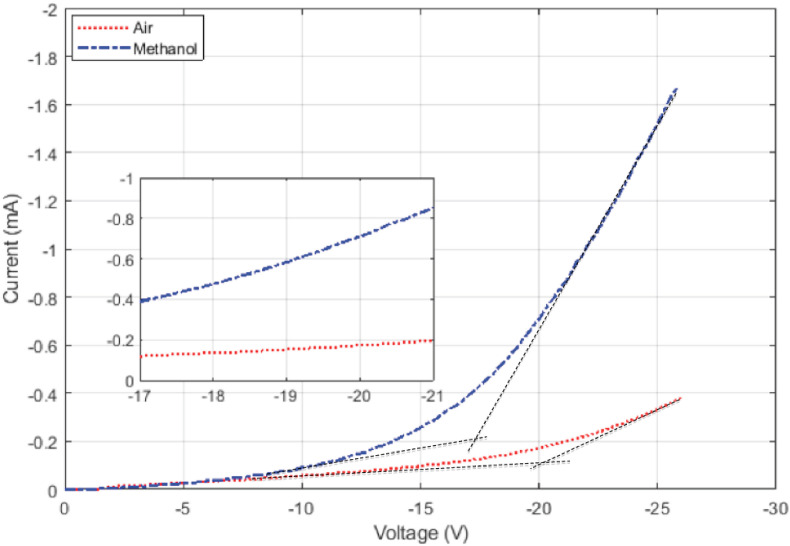
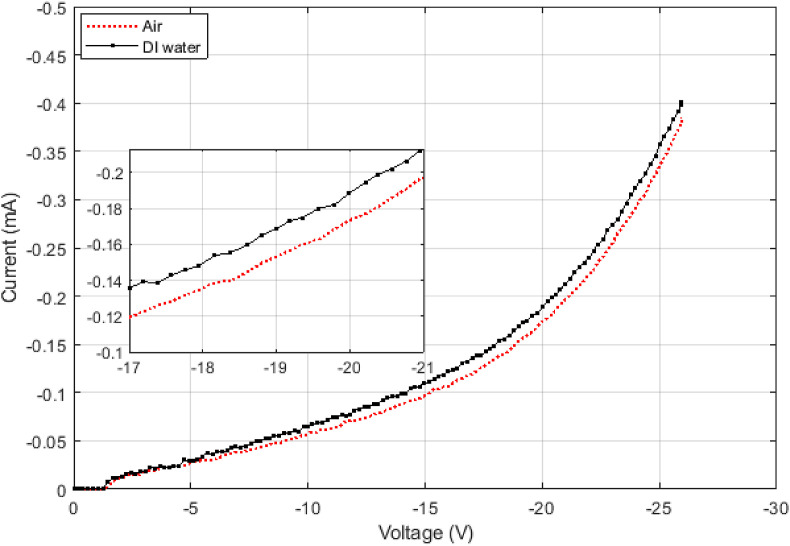
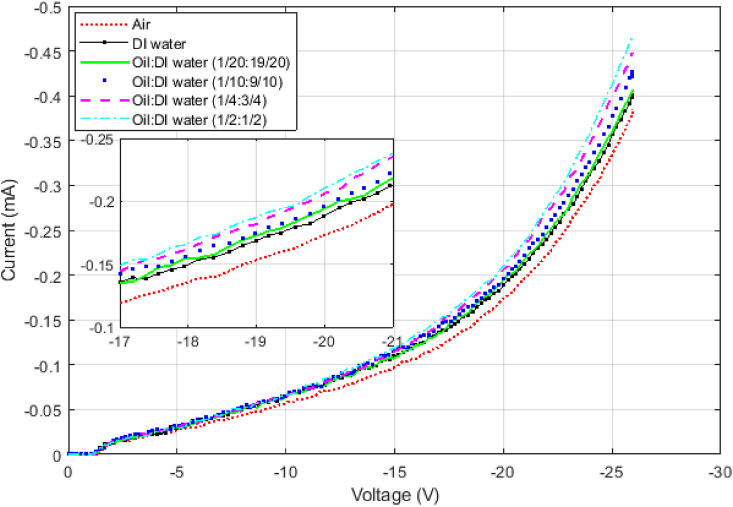
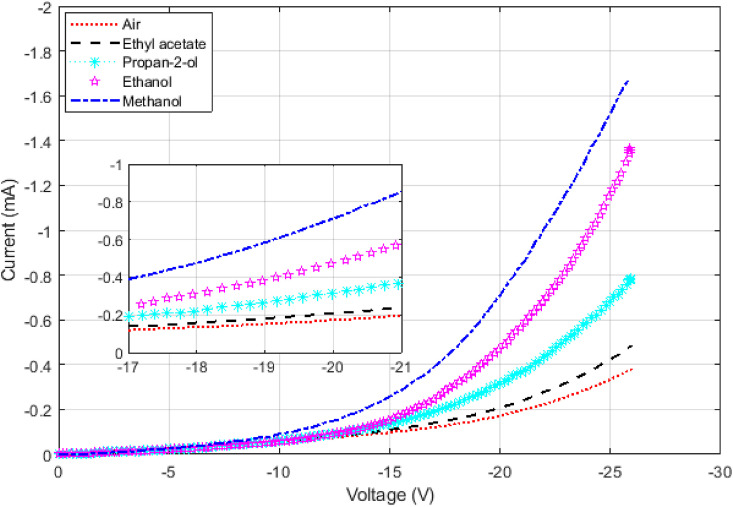
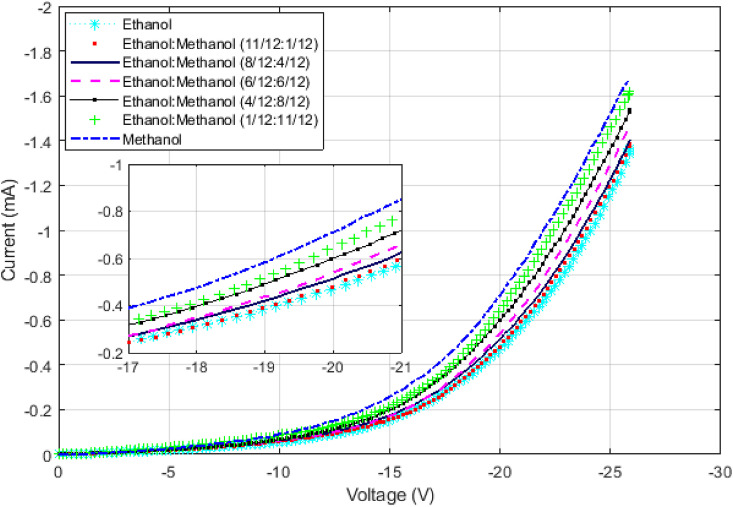
Single-electron devices are capable of detecting changes of the electric field caused by the presence of one single electron in their environment. These devices are optimized to identify the material that is in close contact with them based on the material's internal charge distribution or dipole moment. As an important practical use, they present the possibility of detecting bacteria, viruses, or pathogens. However, their practical use is hampered by their nano-meter size, which is normally an order of magnitude smaller than that of detected species, their very complex fabrication techniques, their cryogenic operational temperature, and the problem of bringing the said species in contact with the single-electron structure. In this document, a large scaled room temperature single-electron structure is introduced, and its ability to distinguish liquids based on their internal dipole moments is demonstrated. The device is a Schottky junction made of PtSi, as the metal contact, and the walls and surfaces of the porous Si, as the semiconductor. The reverse bias current-voltage (IV) characteristic of this device is sensitive to 1 ppm change in the dipole moment of the liquid entering its pores. The simple fabrication, easy testing procedure, high sensitivity, and fast response can make this device an optimized testing kit to identify the given bacteria, viruses, or pathogens dissolved in liquids.
Keywords: Bacteria identification; Liquid dielectric constant; Pathogen dipole moment; Porous silicon; Single-electron effect; Virus identification.
Copyright © 2020 Elsevier B.V. All rights reserved.
Conflict of interest statement
The authors declare that they have no known competing financial interests or personal relationships that could have appeared to influence the work reported in this paper.
Figures
Similar articles
-
CMOS-compatible fabrication of room-temperature single-electron devices.Nat Nanotechnol. 2008 Oct;3(10):603-8. doi: 10.1038/nnano.2008.267. Epub 2008 Sep 14. Nat Nanotechnol. 2008. PMID: 18838999
-
Immobilisation and synthesis of DNA on Si(111), nanocrystalline porous silicon and silicon nanoparticles.Faraday Discuss. 2004;125:235-49; discussion 293-309. doi: 10.1039/b302845c. Faraday Discuss. 2004. PMID: 14750674
-
Donor deactivation in silicon nanostructures.Nat Nanotechnol. 2009 Feb;4(2):103-7. doi: 10.1038/nnano.2008.400. Epub 2009 Jan 11. Nat Nanotechnol. 2009. PMID: 19197312
-
Issues of nanoelectronics: a possible roadmap.J Nanosci Nanotechnol. 2002 Jun-Aug;2(3-4):235-66. doi: 10.1166/jnn.2002.115. J Nanosci Nanotechnol. 2002. PMID: 12908252 Review.
-
Introduction to spin-polarized ballistic hot electron injection and detection in silicon.Philos Trans A Math Phys Eng Sci. 2011 Sep 28;369(1951):3554-74. doi: 10.1098/rsta.2011.0137. Philos Trans A Math Phys Eng Sci. 2011. PMID: 21859721 Review.
Cited by
-
Engineered M13 phage as a novel therapeutic bionanomaterial for clinical applications: From tissue regeneration to cancer therapy.Mater Today Bio. 2023 Mar 24;20:100612. doi: 10.1016/j.mtbio.2023.100612. eCollection 2023 Jun. Mater Today Bio. 2023. PMID: 37063776 Free PMC article. Review.
References
-
- Önal A., Tekkeli S.E.K., Önal C. Review of the liquid chromatographic methods for the determination of biogenic amines in foods. Food Chem. 2013;138:509–515. - PubMed
-
- Rodriguez-Gomez R., Vandeput M., Zafra-Gomez A., Kauffmann J.M. Liquid chromatography-electrochemical detection for the determination of ethoxyquin and its dimer in pear skin and salmon samples. Talanta. 2018;177:157–162. - PubMed
-
- Zheng Z., Wu L., Li L., Zong S., Wang Z., Cui Y. Simultaneous and highly sensitive detection of multiple breast cancer biomarkers in real samples using a SERS microfluidic chip. Talanta. 2018;188:507–515. - PubMed
-
- Wang C.H., Chang C.J., Wu J.J., Lee G.B. An integrated microfluidic device utilizing vancomycin conjugated magnetic beads and nanogold-labeled specific nucleotide probes for rapid pathogen diagnosis. Nanomedicine: NBM (NMR Biomed.) 2014;10:809–818. - PubMed
MeSH terms
LinkOut - more resources
Full Text Sources
Other Literature Sources
Research Materials
