Accurate MP2-based force fields predict hydration free energies for simple alkanes and alcohols in good agreement with experiments
- PMID: 33380083
- PMCID: PMC7771999
- DOI: 10.1063/5.0035032
Accurate MP2-based force fields predict hydration free energies for simple alkanes and alcohols in good agreement with experiments
Abstract
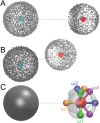
Force fields for four small molecules, methane, ethane, methanol, and ethanol, were created by force matching MP2 gradients computed with triple-zeta-quality basis sets using the Adaptive Force Matching method. Without fitting to any experimental properties, the force fields created were able to predict hydration free energies, enthalpies of hydration, and diffusion constants in excellent agreements with experiments. The root mean square error for the predicted hydration free energies is within 1 kJ/mol of experimental measurements of Ben-Naim et al. [J. Chem. Phys. 81(4), 2016-2027 (1984)]. The good prediction of hydration free energies is particularly noteworthy, as it is an important fundamental property. Similar hydration free energies of ethane relative to methane and of ethanol relative to methanol are attributed to a near cancellation of cavitation penalty and favorable contributions from dispersion and Coulombic interactions as a result of the additional methyl group.
Figures


Similar articles
-
Determining the hydration free energies of selected small molecules with MP2 and local MP2 through adaptive force matching.J Chem Phys. 2021 Mar 14;154(10):104113. doi: 10.1063/5.0044712. J Chem Phys. 2021. PMID: 33722038 Free PMC article.
-
Estimated MP2 and CCSD(T) interaction energies of n-alkane dimers at the basis set limit: comparison of the methods of Helgaker et al. and Feller.J Chem Phys. 2006 Mar 21;124(11):114304. doi: 10.1063/1.2178795. J Chem Phys. 2006. PMID: 16555885
-
The Effect of Core Correlation on the MP2 Hydration Free Energies of Li(+), Na(+), and K(.).J Phys Chem B. 2016 Sep 1;120(34):9088-96. doi: 10.1021/acs.jpcb.6b06102. Epub 2016 Aug 11. J Phys Chem B. 2016. PMID: 27464064
-
Alchemical prediction of hydration free energies for SAMPL.J Comput Aided Mol Des. 2012 May;26(5):551-62. doi: 10.1007/s10822-011-9528-8. Epub 2011 Dec 24. J Comput Aided Mol Des. 2012. PMID: 22198475 Free PMC article.
-
Van der Waals interactions between hydrocarbon molecules and zeolites: periodic calculations at different levels of theory, from density functional theory to the random phase approximation and Møller-Plesset perturbation theory.J Chem Phys. 2012 Sep 21;137(11):114111. doi: 10.1063/1.4750979. J Chem Phys. 2012. PMID: 22998253
Cited by
-
Exploring the promise and limitations of point-charge-free potentials for hydrocarbon modeling.Sci Rep. 2025 Jul 2;15(1):23055. doi: 10.1038/s41598-025-06558-w. Sci Rep. 2025. PMID: 40594397 Free PMC article.
-
Δ-Machine Learning to Elevate DFT-Based Potentials and a Force Field to the CCSD(T) Level Illustrated for Ethanol.J Chem Theory Comput. 2024 Oct 22;20(20):8807-8819. doi: 10.1021/acs.jctc.4c00977. Epub 2024 Oct 3. J Chem Theory Comput. 2024. PMID: 39361051 Free PMC article.
-
Performing Molecular Dynamics Simulations and Computing Hydration Free Energies on the B3LYP-D3(BJ) Potential Energy Surface with Adaptive Force Matching: A Benchmark Study with Seven Alcohols and One Amine.ACS Phys Chem Au. 2021 Nov 24;1(1):14-24. doi: 10.1021/acsphyschemau.1c00006. Epub 2021 Jul 21. ACS Phys Chem Au. 2021. PMID: 34939071 Free PMC article.
-
Development and Validation of a DFT-Based Force Field for a Hydrated Homoalanine Polypeptide.J Phys Chem B. 2021 Feb 18;125(6):1568-1581. doi: 10.1021/acs.jpcb.0c11618. Epub 2021 Feb 8. J Phys Chem B. 2021. PMID: 33555880 Free PMC article.
-
Fragmentation Method for Computing Quantum Mechanics and Molecular Mechanics Gradients for Force Matching: Validation with Hydration Free Energy Predictions Using Adaptive Force Matching.J Phys Chem A. 2022 Apr 28;126(16):2609-2617. doi: 10.1021/acs.jpca.2c01615. Epub 2022 Apr 14. J Phys Chem A. 2022. PMID: 35420821 Free PMC article.
References
-
- Xu P., Guidez E. B., Bertoni C., and Gordon M. S., J. Chem. Phys. 148(9), 090901 (2018).10.1063/1.5009551 - DOI
-
- Demerdash O., Yap E. H., and Head-Gordon T., in Annual Review of Physical Chemistry, edited by Johnson M. A. and Martinez T. J. (Annual Reviews, 2014), Vol. 65, pp. 149–174. - PubMed
-
- Cornell W. D., Cieplak P., Bayly C. I., Gould I. R., Merz K. M., Ferguson D. M., Spellmeyer D. C., Fox T., Caldwell J. W., and Kollman P. A., J. Am. Chem. Soc. 117(19), 5179–5197 (1995).10.1021/ja00124a002 - DOI
Grants and funding
LinkOut - more resources
Full Text Sources

