. 2021 Feb;41(2):839-853.
doi: 10.1161/ATVBAHA.120.315556. Epub 2020 Dec 31.

Electronic Cigarettes Induce Mitochondrial DNA Damage and Trigger TLR9 (Toll-Like Receptor 9)-Mediated Atherosclerosis

Affiliations

Electronic Cigarettes Induce Mitochondrial DNA Damage and Trigger TLR9 (Toll-Like Receptor 9)-Mediated Atherosclerosis

Jieliang Li et al. Arterioscler Thromb Vasc Biol. 2021 Feb.

Abstract

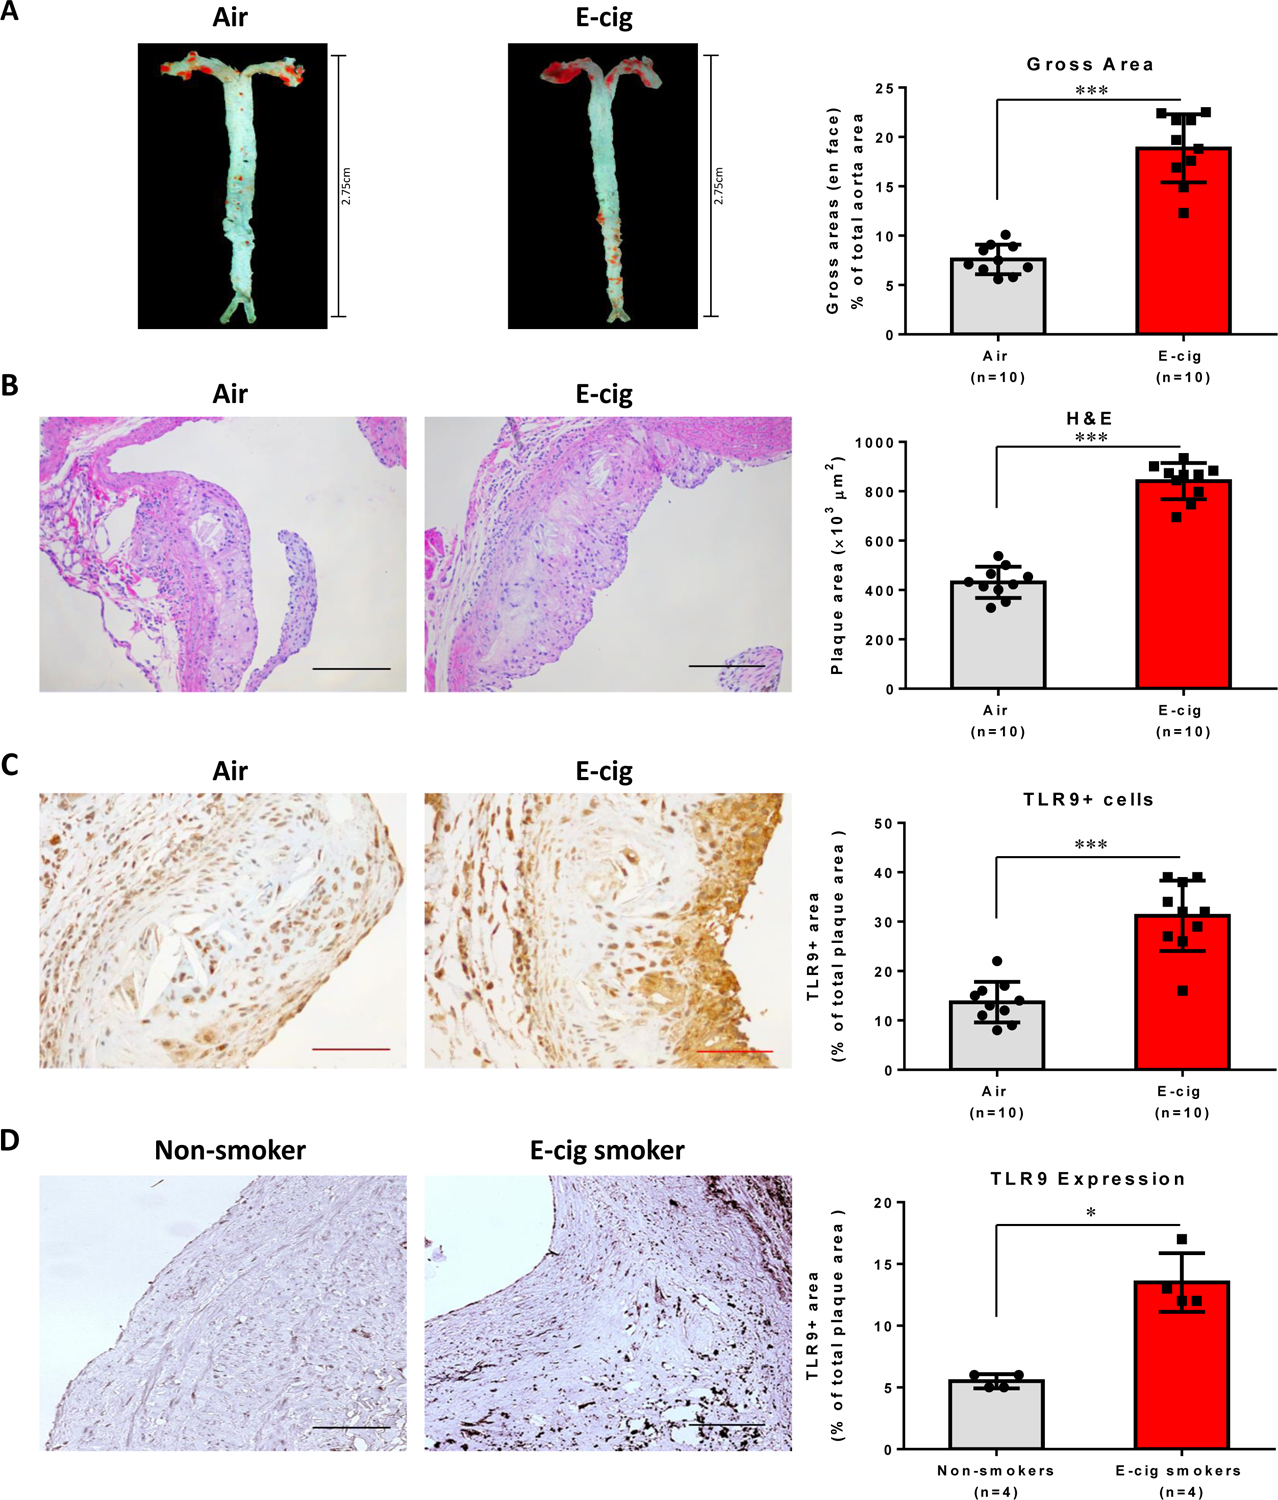
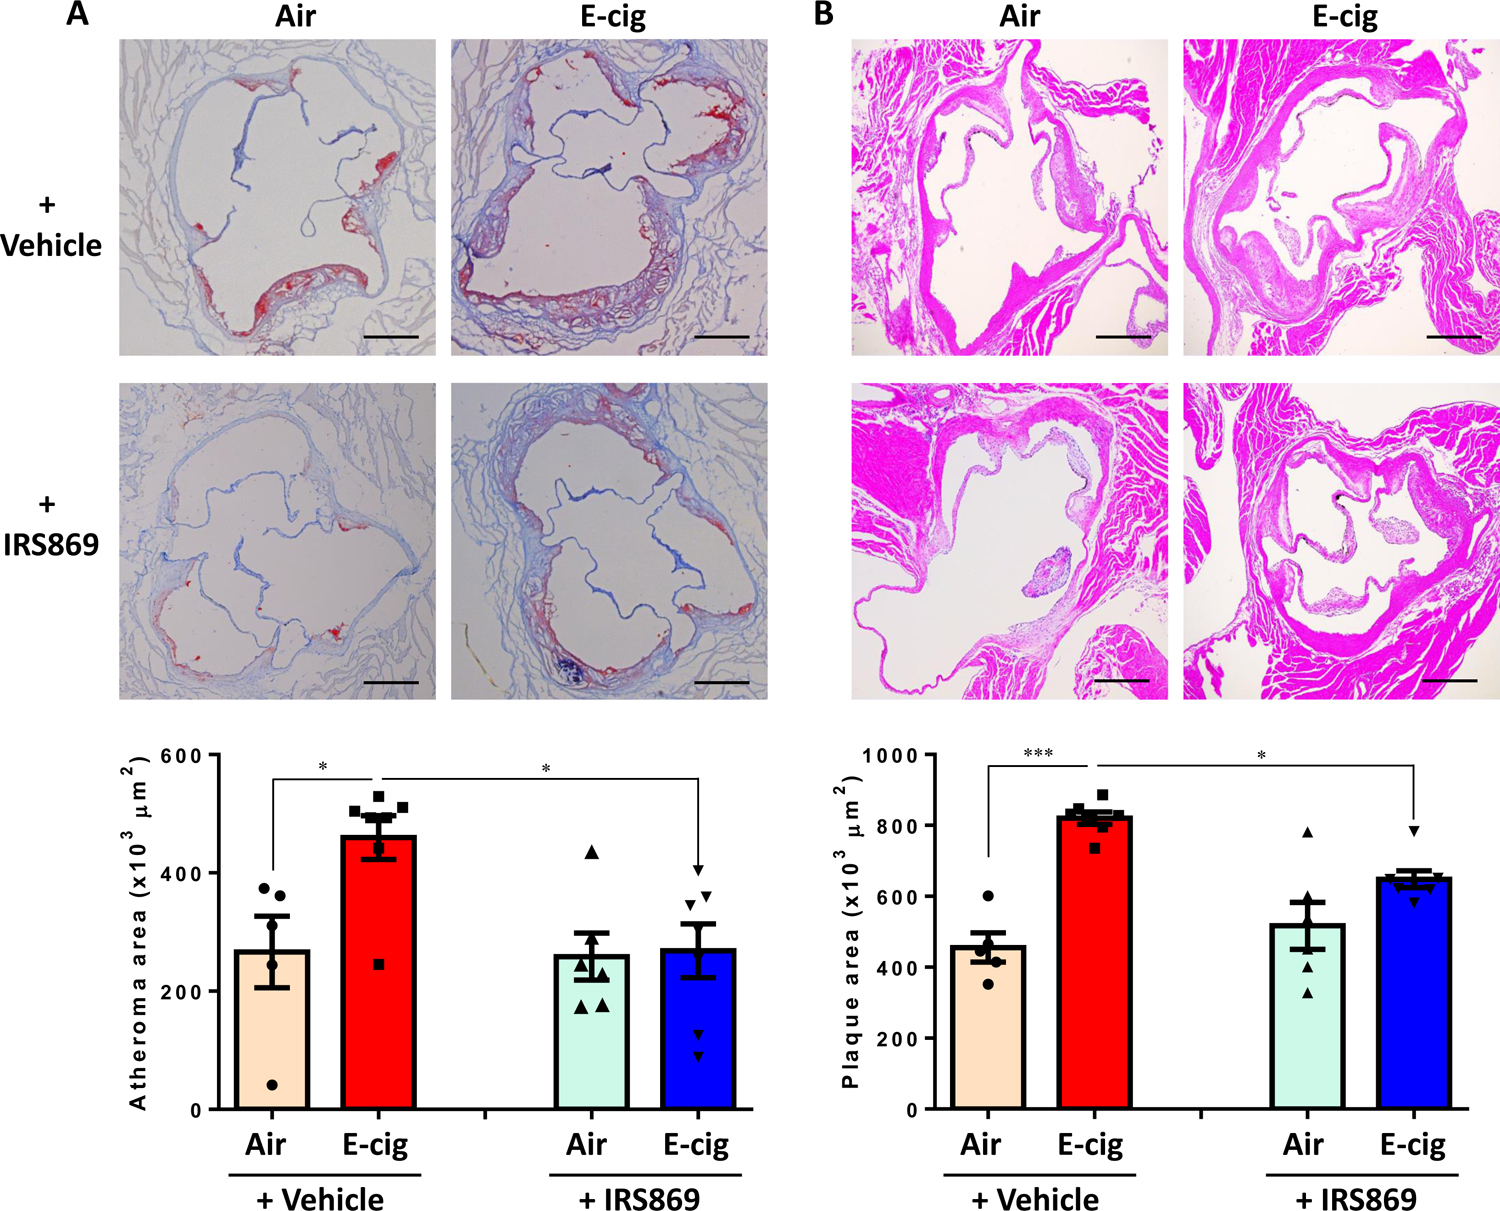
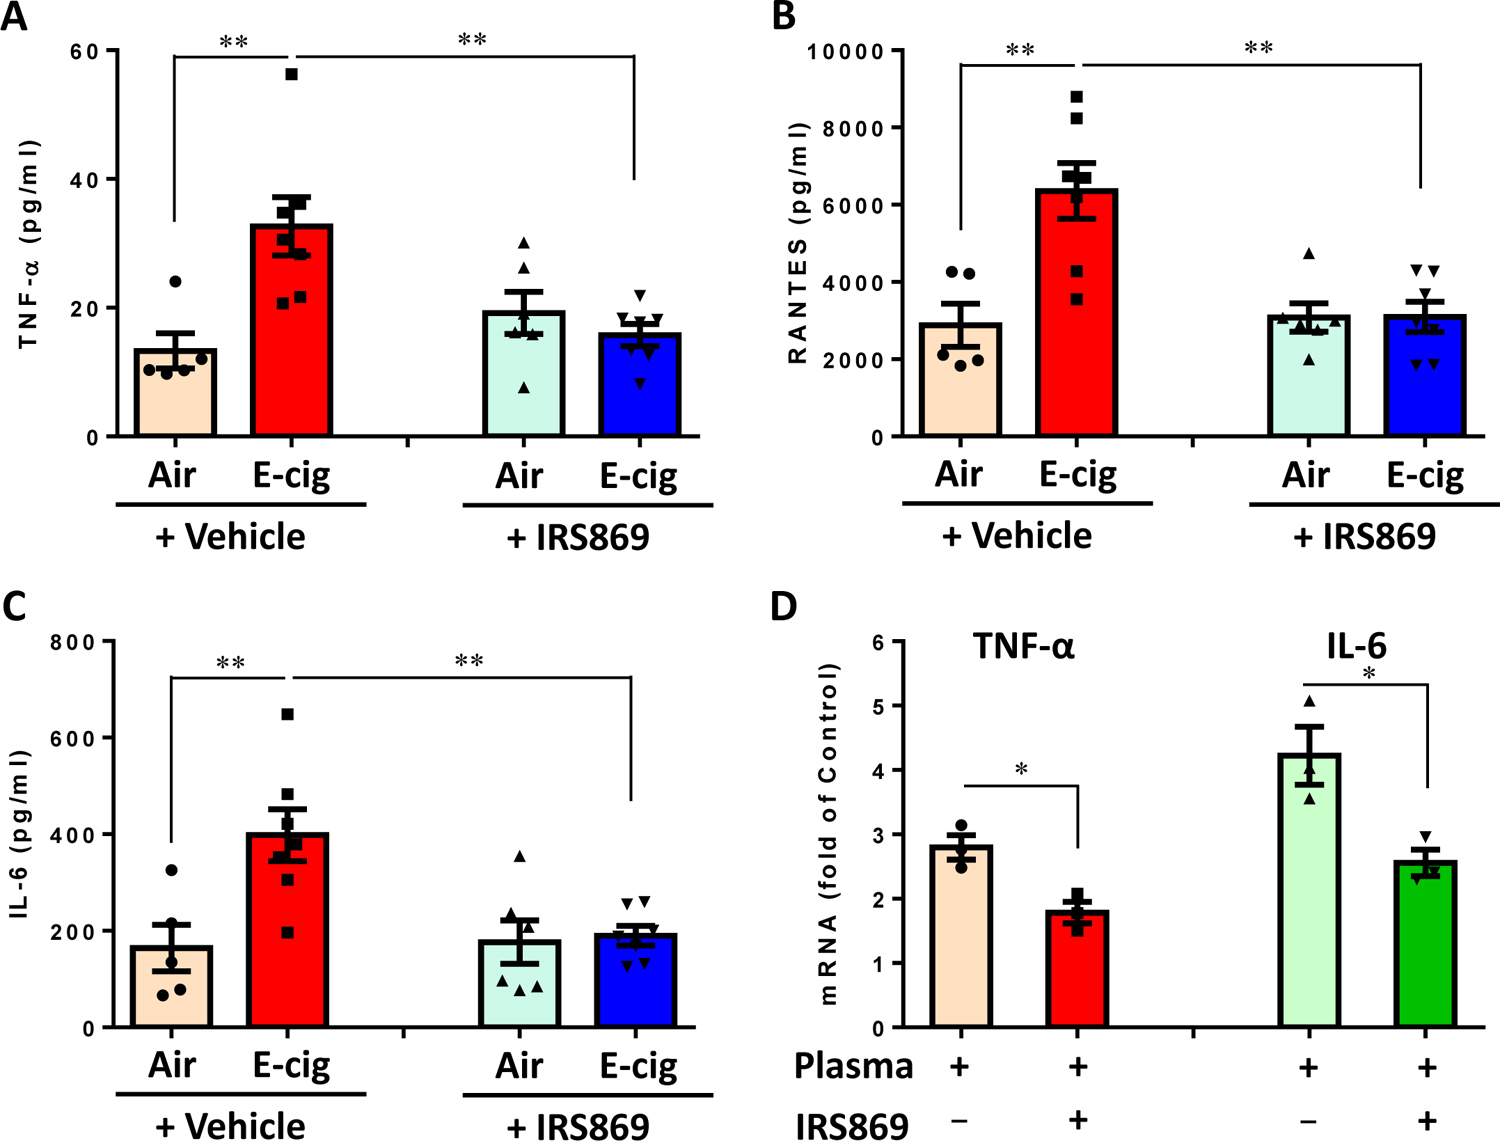
Objective: Electronic cigarette (e-cig) use has recently been implicated in promoting atherosclerosis. In this study, we aimed to investigate the mechanism of e-cig exposure accelerated atherosclerotic lesion development. Approach and Results: Eight-week-old ApoE-/- mice fed normal laboratory diet were exposed to e-cig vapor (ECV) for 2 hours/day, 5 days/week for 16 weeks. We found that ECV exposure significantly induced atherosclerotic lesions as examined by Oil Red O staining and greatly upregulated TLR9 (toll-like receptor 9) expression in classical monocytes and in the atherosclerotic plaques, which the latter was corroborated by enhanced TLR9 expression in human femoral artery atherosclerotic plaques from e-cig smokers. Intriguingly, we found a significant increase of oxidative mitochondria DNA lesion in the plasma of ECV-exposed mice. Administration of TLR9 antagonist before ECV exposure not only alleviated atherosclerosis and the upregulation of TLR9 in plaques but also attenuated the increase of plasma levels of inflammatory cytokines, reduced the plaque accumulation of lipid and macrophages, and decreased the frequency of blood CCR2+ (C-C chemokine receptor type 2) classical monocytes. Surprisingly, we found that cytoplasmic mitochondrial DNA isolated from ECV extract-treated macrophages can enhance TLR9 activation in reporter cells and the induction of inflammatory cytokine could be suppressed by TLR9 inhibitor in macrophages.

Conclusions: E-cig increases level of damaged mitochondrial DNA in circulating blood and induces the expression of TLR9, which elevate the expression of proinflammatory cytokines in monocyte/macrophage and consequently lead to atherosclerosis. Our results raise the possibility that intervention of TLR9 activation is a potential pharmacological target of ECV-related inflammation and cardiovascular diseases.

Keywords: atherosclerosis; cytokines; electronic cigarette; mice; monocyte.


Figures

Figure 1.
Figure 1.. E-cig vapor exposure increased atherosclerotic lesion and TLR9 expression in atherosclerotic plaques in normal laboratory diet-fed ApoE−/− mice, substantiated by the upregulation of TLR9 expression in femoral arterial plaques in e-cig smokers as compared to that in the plaques from nonsmokers.
(A) Representative pictures of en face Oil Red O (ORO) staining of freshly dissected intact aorta and quantification analysis of atherosclerosis burden. 8-week-old mice were exposed to air or e-cig vapor for 2 h a day, 5 days per week for 16 weeks. (B) Hematoxylin-eosin (H&E) staining to measure the intimal microscopic lesions in the cross-sectional aortic roots. Scale bar: 100 µm. (C) TLR9 positive cells in atherosclerotic plaques in ApoE−/− mice. Cross-sectioned aortic roots were subjected to TLR9 immunohistochemistry staining. Scale bar: 50 µm. A-C: Data are shown as mean ± SEM (n=10 per group) and statistical analysis was performed using the Students’ t-test. ***P < 0.001. (D) TLR9 expression in the femoral arterial plaques from e-cig smokers (>6 months) as compared to in non-smoking-derived plaques in non-smokers. Scale bar: 100 µm. Data are shown as mean ± SEM (n=4 per group) and statistical analysis was performed using Mann-Whitney test. *P < 0.05.
Figure 2.
Figure 2.. TLR9 inhibitor attenuated ECV-exacerbated atherosclerotic lesion development TLR9 inhibitor in ApoE−/− mice.
(A) Oil Red O (ORO) staining of the cross-sectioned aortic roots. Lipid deposition in plaques was quantified as ORO-positive lesion areas and expressed as percentage to the total area of the atheroma. (B). Cross-sectional hematoxylin-eosin staining to measure the intimal microscopic lesions in the aortic roots. Scale bar:  200 µm. Numbers of animals in each group: Air + Ctrl-ODN: n=5; E-cig + Ctrl-ODN: n=7; Air + IRS869: n=6; E-cig + IRS869: n=7. Data are shown as mean ± SEM and statistical multiple comparisons were made by one-way ANOVA with Tukey’s post hoc analysis. *P<0.05; ***P < 0.001.
Figure 3.
Figure 3.. TLR9 frequency in different subset of monocytes and the effect of ECV exposure on TLR9 expression classical monocytes of ApoE−/− mice.
(A) Representative histogram of TLR9 expression in different subsets of monocytes in air-exposed ApoE−/− mice. N=5. (B) Mean fluorescence intensity (MFI) of TLR9 expression in classical monocytes. Numbers of animals in each group: Air + Ctrl-ODN: n=5; E-cig + Ctrl-ODN: n=7; Air + IRS869: n=6; E-cig + IRS869: n=7. Data are shown as mean ± SEM and statistical multiple comparisons were made by one-way ANOVA with Tukey’s post hoc analysis. *P < 0.05; **P < 0.01.
Figure 4.
Figure 4.. Pretreatment of mice with TLR9 inhibitor alleviated ECV exposure-induced macrophage accumulation and expression of adhesion molecule and TLR9 in atherosclerotic lesion.
(A) Representative pictures of immunostaining of cross-sectioned aortic root with TLR9 antibody (0.1 µg/mL) and quantification analysis between groups. (B) Representative pictures of immunostaining of cross-sectioned aorta with VCAM-1 antibody (1 µg/mL) and quantification analysis between groups. (C) Immunohistochemical staining of aortic cross-section with mouse macrophage marker Mac2 (0.2 µg/mL) and macrophage content was expressed as percentage of Mac2-positive cells. Scale bar: 100 µm. Numbers of animals in each group: Air + Ctrl-ODN: n=5; E-cig + Ctrl-ODN: n=7; Air + IRS869: n=6; E-cig + IRS869: n=7. Data are shown as mean ± SEM and statistical multiple comparisons were made by one-way ANOVA with Tukey’s post hoc analysis. *P<0.05; **P<0.01; ***P < 0.001.
Figure 5.
Figure 5.. Effect of ECV exposure on the frequency of classical monocytes expressing CCR2 and CD62L in ApoE−/− mice.
(A) Representative histograms of CCR2 expression in classical monocytes in ApoE−/− mice exposed to air, e-cig, or e-cig with pre-administration of TLR9 inhibitor IRS869. (B) Expression of CD62L in classical monocytes. Numbers of animals in each group: Air + Ctrl-ODN: n=5; E-cig + Ctrl-ODN: n=7; Air + IRS869: n=6; E-cig + IRS869: n=7. Data are shown as mean ± SEM and statistical multiple comparisons were made by one-way ANOVA with Tukey’s post hoc analysis. *P < 0.05, ***P<0.001.
Figure 6.
Figure 6.. Effect of ECV exposure on the plasma levels of inflammatory cytokines in ApoE−/− mice and impact of plasmas from different groups of mice on cytokine expression in RWA264.7 cells ex vivo.
(A, B, C) Plasma were collected from different groups of ApoE−/− mice and subjected to immunoassay for a panel of inflammatory cytokines using the mouse Cytokine 9-Plex ELISA Kit. Images were scanned and the dot density was quantified by a parallel set of individual cytokine standards. N means the number of mice whose plasmas were used for cytokine measurement. Numbers of animals in each group: Air + Ctrl-ODN: n=5; E-cig + Ctrl-ODN: n=7; Air + IRS869: n=6; E-cig + IRS869: n=7. Data are shown as mean ± SEM and statistical multiple comparisons between different groups were made by one-way ANOVA with Tukey’s post hoc analysis. **P < 0.01. (D) Effect of plasma from ECV-exposed mice on proinflammatory cytokines in murine monocytes/macrophages. RAW264.7 cells were pretreated with or without IRS869 at 5 μM for 30 min, then with plasma from ECV-exposed ApoE−/− mice for 3 h. The expression of cytokines was examined by quantitative real time PCR. Data are shown as mean ± SEM from three independent experiments using plasma from 3 mice and statistical analysis was performed using Mann-Whitney test. *P < 0.05.
Figure 7.
Figure 7.. Effect of e-cig on mitochondrial DNA damage.
(A) ECV exposure increased plasma levels of circulating damaged DNA in ApoE−/− mice. Plasma were collected from air or ECV-exposed ApoE−/− mice with or without IRS869 pre-administration. The plasma levels of circulating damaged DNA were measured by DNA damage ELISA kit and expressed by the plasma levels of 8-OHdG. Numbers of animals in each group: Air + Ctrl-ODN: n=5; E-cig + Ctrl-ODN: n=7; Air + IRS869: n=6; E-cig + IRS869: n=7. Data are shown as mean ± SEM and statistical multiple comparisons between different groups were made by one-way ANOVA with Tukey’s post hoc analysis. **P < 0.01. (B) The expression of mtCO-1 and 18S rDNA in the plasma circulating DNA was measured by SYBR qPCR and the ratio of mtDNA against nDNA was calculated. Numbers of animals in each group: Air + Ctrl-ODN: n=5; E-cig + Ctrl-ODN: n=7. Data are shown as mean ± SEM and statistical analysis was performed using the Students’ t-test. **P < 0.01. (C) EVE treatment upregulated cytoplasmic levels of mtDNA. RAW264.7 cells were treated with 0.5% of EVE for indicated period. The cytoplasmic mtDNA was extracted and the expression of mtCO-1 was measured by quantitative PCR. (D) HEK-Blue™ mTLR9 reporter cells were stimulated with 25 µg/ml of cytoplasmic mtDNA extracted from EVE-treated RAW264.7 cells after indicated time periods. After 24h incubation, NF-kB-induced SEAP activity was assessed using HEK-Blue™ Detection and reading the optical density (OD) at 655 nm. (E) The 8-OHdG levels in the cytoplasmic mtDNA from RAW264.7 cells treated with or without EVE for 48 h was measured by Competitive DNA Damage ELISA. (F) Pharmacological inactivation of TLR9 on lesioned mtDNA-induced inflammatory cytokine expression in macrophages. RAW264.7 cells were pretreated with Ctrl-ODN or IRS869 (10 µM) for 1 h and then exposed to cytoplasmic mtDNA from RAW264.7 cells treated with or without EVE. After 3 h, RNA was extracted and the mRNA expression of IL-6 was measured by quantitative PCR. Data are shown as mean ± SEM from three independent experiments and statistical analysis was performed using Mann-Whitney test. *P < 0.05 as compared with control treatment.

References

    1. Ross R Atherosclerosis--an inflammatory disease. The New England journal of medicine. 1999;340:115–126 - PubMed
    1. Roth GA, Huffman MD, Moran AE, Feigin V, Mensah GA, Naghavi M, Murray CJ. Global and regional patterns in cardiovascular mortality from 1990 to 2013. Circulation. 2015;132:1667–1678 - PubMed
    1. Health. NCfCDPaHPUOoSa UA. The health consequences of smoking—50 years of progress: A report of the surgeon general. 2014
    1. Messner B, Bernhard D. Smoking and cardiovascular disease: Mechanisms of endothelial dysfunction and early atherogenesis. Arteriosclerosis, thrombosis, and vascular biology. 2014;34:509–515 - PubMed
    1. Gairola CG, Drawdy ML, Block AE, Daugherty A. Sidestream cigarette smoke accelerates atherogenesis in apolipoprotein e−/− mice. Atherosclerosis. 2001;156:49–55 - PubMed

Publication types

MeSH terms