. 2021 Jan 12;118(2):e2002232118.
doi: 10.1073/pnas.2002232118.

Optimal utility and probability functions for agents with finite computational precision

Affiliations

Optimal utility and probability functions for agents with finite computational precision

Keno Juechems et al. Proc Natl Acad Sci U S A. .

Abstract

When making economic choices, such as those between goods or gambles, humans act as if their internal representation of the value and probability of a prospect is distorted away from its true value. These distortions give rise to decisions which apparently fail to maximize reward, and preferences that reverse without reason. Why would humans have evolved to encode value and probability in a distorted fashion, in the face of selective pressure for reward-maximizing choices? Here, we show that under the simple assumption that humans make decisions with finite computational precision--in other words, that decisions are irreducibly corrupted by noise--the distortions of value and probability displayed by humans are approximately optimal in that they maximize reward and minimize uncertainty. In two empirical studies, we manipulate factors that change the reward-maximizing form of distortion, and find that in each case, humans adapt optimally to the manipulation. This work suggests an answer to the longstanding question of why humans make "irrational" economic choices.

Keywords: computational precision; prospect theory; uncertainty; utility.


Conflict of interest statement

The authors declare no competing interest.

Figures

Fig. 1.
Fig. 1.
Optimal value and probability distortions under decision noise. (A) Optimal (i.e., reward-maximizing) values for v(x) and w(p) as derived from Eq. 4 under the assumption that Yi=xipi (y axis) plotted against their untransformed counterparts (x axis) under variable levels of decision noise (columns). Note that for convenience the y axis was scaled to unity and its values thus do not reflect supra- or sublinear coding with respect to an ideal observer. (B) Optimal (i.e., reward- and certainty-maximizing) values for v(x) and w(p) as derived from Eq. 4 under the assumption that Yi=xipi(1Hi) (y axis) plotted against their untransformed counterparts (x axis) under variable levels of decision noise (columns).
Fig. 2.
Fig. 2.
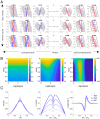
Illustrating optimal value distortion of parametric utility functions. (A) Each subpanel plots the relative difference in decision utility as a function of the relative expected value of a gamble. Each dot is a unique gamble of the form [x1,p1;x2,p2]. The x axis denotes EV1EV2 and the y axis denotes dvlindvdis, where dv=U1U2+ε under linear (dvlin) and distorted (dvdis) transduction, respectively. For dvlin,κ=1,γ=1 whereas κ/γ vary from compressive (left columns) to anticompressive (right columns) under increasing levels of noise (top to bottom; ε0.1,0.3,0.5). Red dots signal those gambles where sign(EV1EV2)=sign(dvlin) but sign(EV1EV2)sign(dvdis) and blue dots signal the converse, i.e., where sign(EV1EV2)sign(dvlin) but sign(EV1EV2)=sign(dvdis). The number above each plot indicates the relative fraction of blue dots minus red dots; positive numbers thus indicate that there were more gambles where distortion led to more rewarding choices. (B) The relative fraction of decision utilities that were of consistent sign with EV1EV2 under linear recoding (Left), distorted recoding (Middle), and their difference (Right), as a function of noise and distortion level (κ). The yellow area shows that compression is reward maximizing where noise is nonzero. (C, Left) How the relative density of decision utilities changes with different levels of distortion, under various levels of κ. (C, Middle) The expected reward obtained, relative to linear transduction, as a function of EV1EV2 under various levels of κ. (C, Right) The change in probability of choosing gamble 1, relative to linear transduction as a function of EV1EV2, under various levels of κ.
Fig. 3.
Fig. 3.
(Upper) Loss landscapes showing parameterizations of the winning model in each group that maximize reward (for the certain outcome condition; A [experiment 1] and B [experiment 2]) and that maximize reward/minimize risk (for the uncertain outcome condition; C [experiment 1] and D [experiment 2]). Warmer colors signal parameterizations that are closer to optimal, and the black circle shows the maximum. Red circles show parameter estimates for individual human participants in each experiment (A and B) Double-exponent model; (C and D) PT model). Note how humans cluster in the same quadrant as the maximum; see statistics below. (Lower) The difference in loss between the distorted model and a linear model, i.e., a model with the same estimated noise but with log(κ)=0 and log(γ)=0. Red circles are individual participants. Warmer colors show regions where the distortion increases return over the linear model. (E) Exceedance probabilities for the PT model and double-exponent model in the certain outcome condition (Left) and uncertain outcome condition (Right).
Fig. 4.
Fig. 4.
Each panel shows the reward-maximizing form of the functions v(x) (blue shading) and w(p) (red shading). Each function is expressed as a density over optimal estimates derived from each participant in the certain outcome condition (A [experiment 1] and B [experiment 2]) and the uncertain outcome condition (C [experiment 1] and D [experiment 2]). Optimal estimates vary from participant to participant because of distinct noise levels and variation in lottery sampling. Superimposed on each reward-maximizing function is the form of the distortion that best fit human choices (estimated from median; parameters, shown on each plot). This was estimated from the double-exponent model for the certain outcome condition (A and B) and from PT for the uncertain outcome condition (C and D).

References

    1. Starmer C., Developments in nonexpected-utility theory: The hunt for a descriptive theory of choice under risk. J. Econ. Lit. 38, 104–147 (2000).
    1. Harless D. W., Camerer C. F., The predictive utility of generalized expected utility theories. Econometrica 62, 1251–1289 (1994).
    1. Camerer C. F., “Prospect theory in the wild: Evidence from the field” in Choices, Values and Frames, Kahneman D., Tversky A., Eds. (Cambridge University Press, 2000), pp. 288–300.
    1. Kahneman D., Tversky A., Prospect theory: An analysis of decision under risk. Econometrica 47, 263–292 (1979).
    1. Findling C., Skvortsova V., Dromnelle R., Palminteri S., Wyart V., Computational noise in reward-guided learning drives behavioral variability in volatile environments. Nat. Neurosci. 22, 2066–2077 (2019). - PubMed

Publication types

LinkOut - more resources