. 2021 Feb 10;41(6):1274-1287.
doi: 10.1523/JNEUROSCI.2140-20.2020. Epub 2020 Dec 30.

Microglia Elimination Increases Neural Circuit Connectivity and Activity in Adult Mouse Cortex

Affiliations

Microglia Elimination Increases Neural Circuit Connectivity and Activity in Adult Mouse Cortex

Yong-Jun Liu et al. J Neurosci. .

Abstract

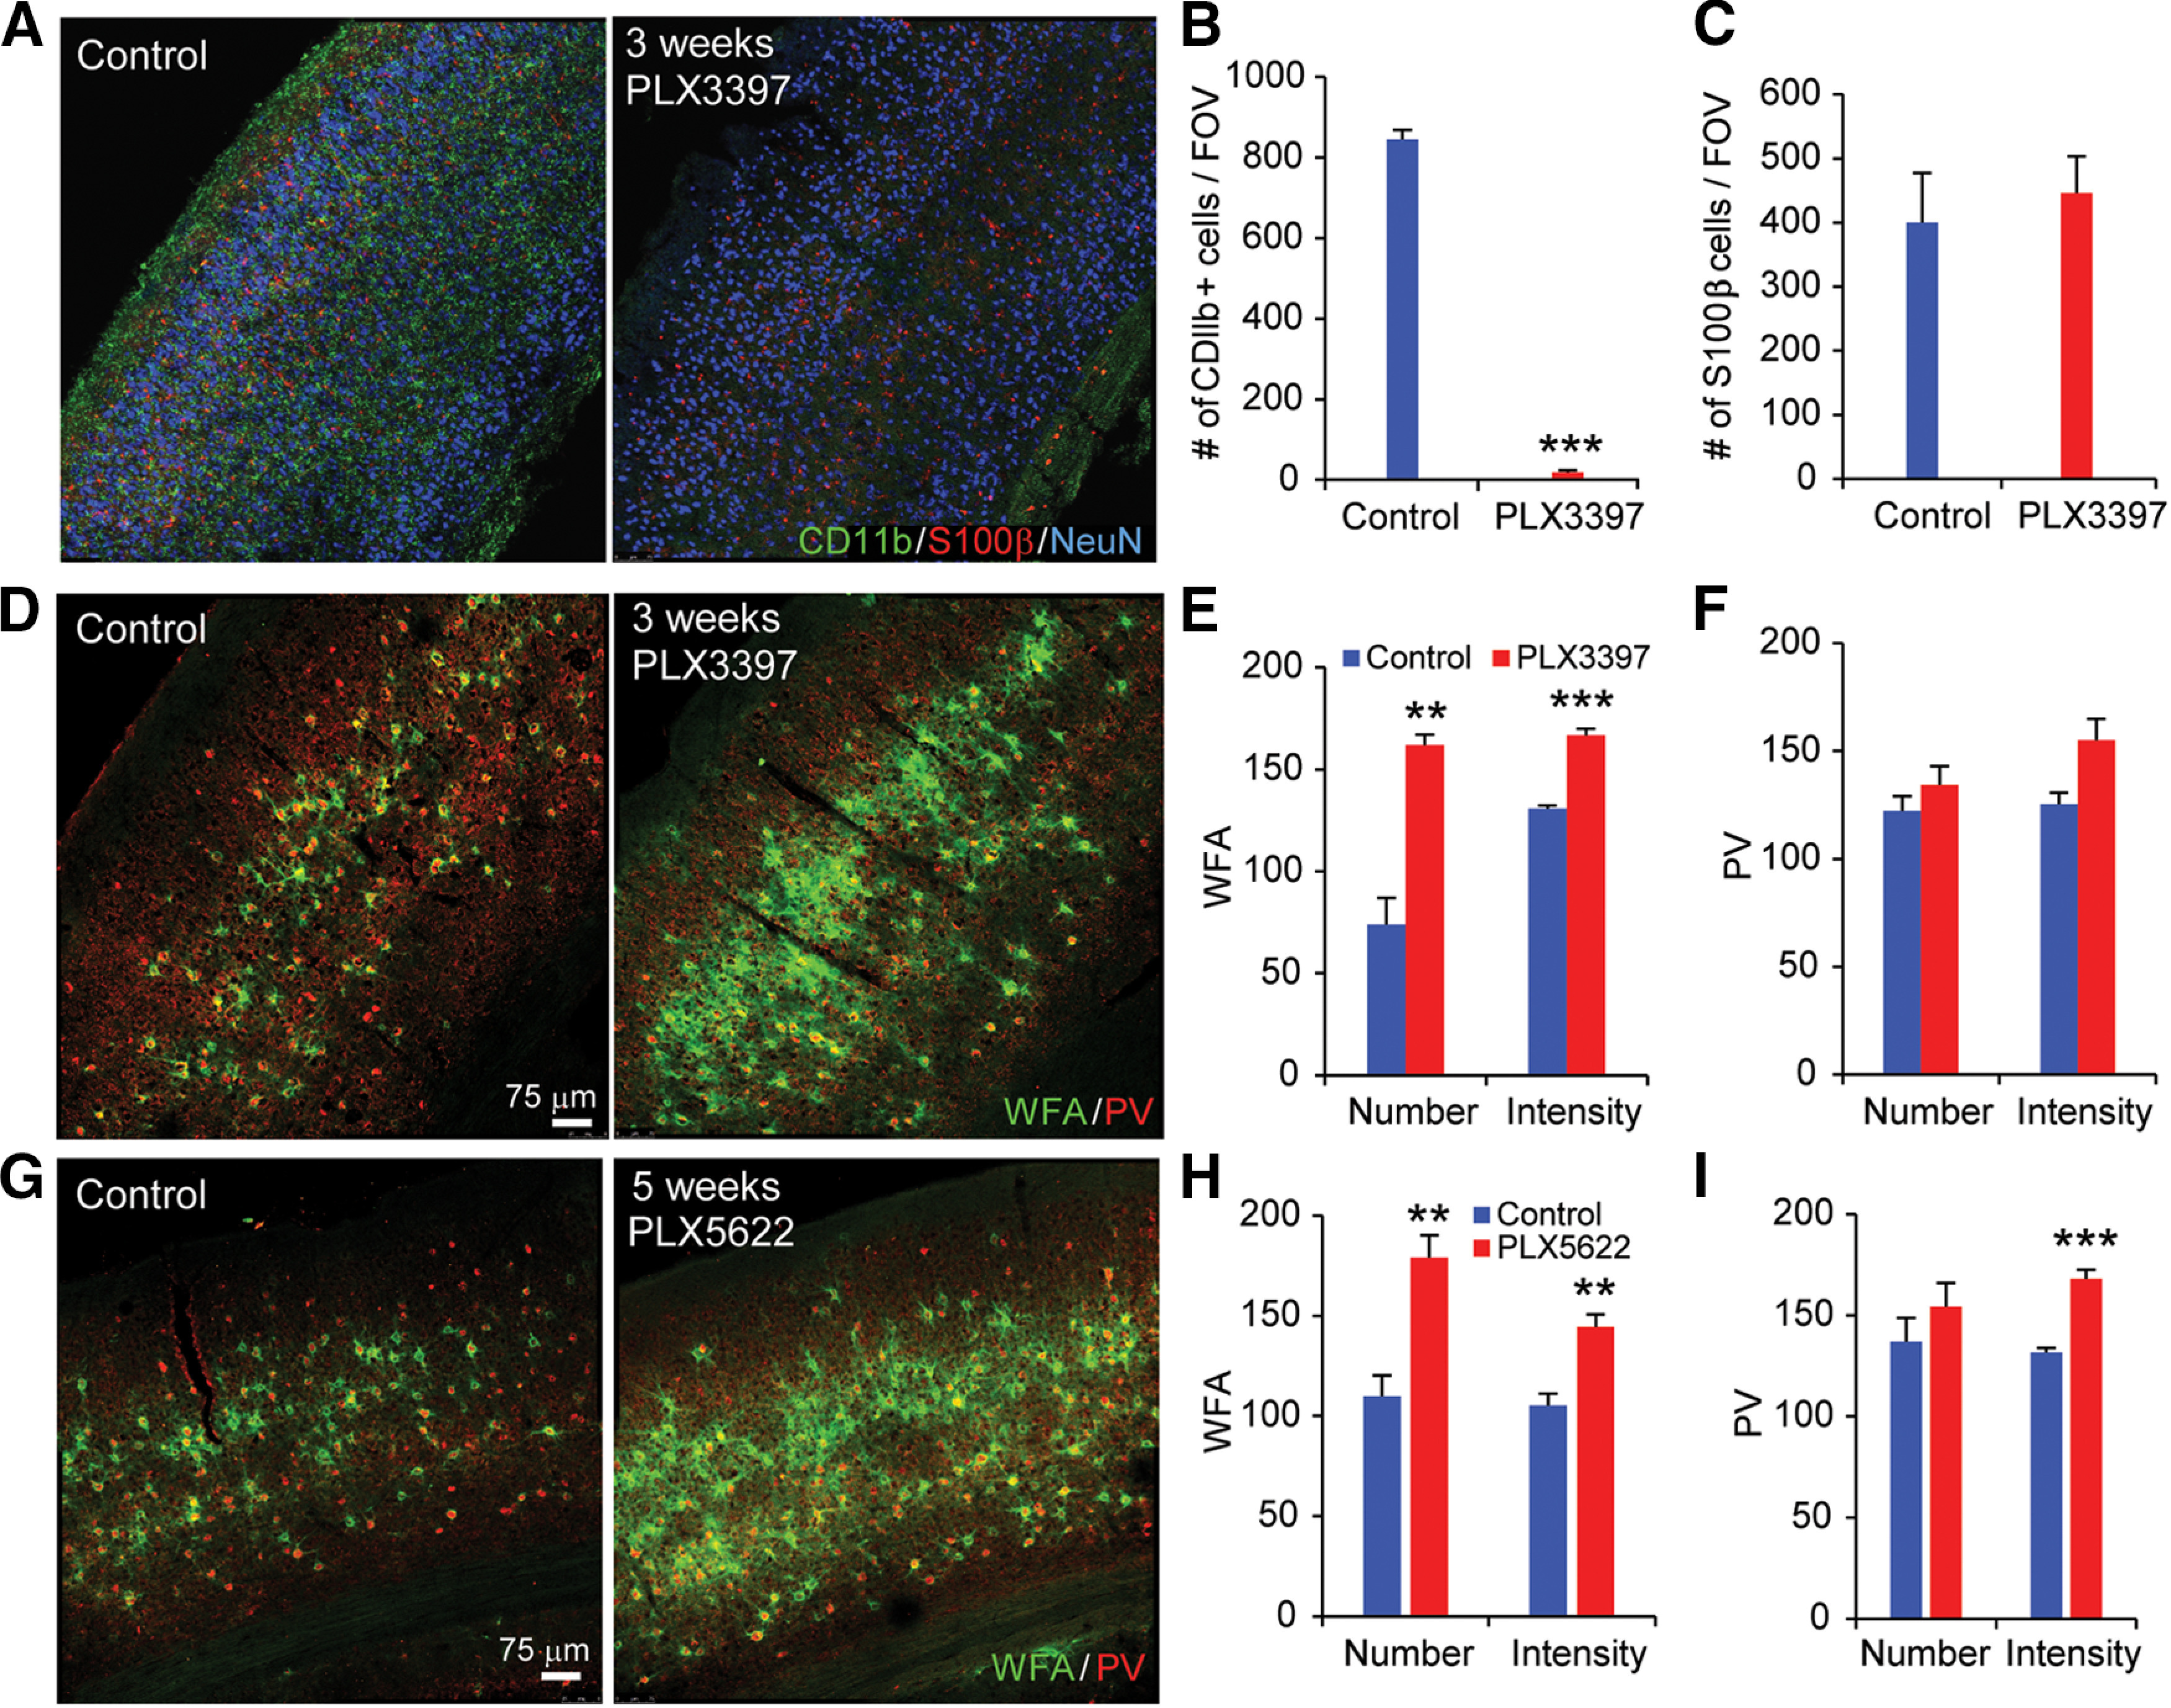
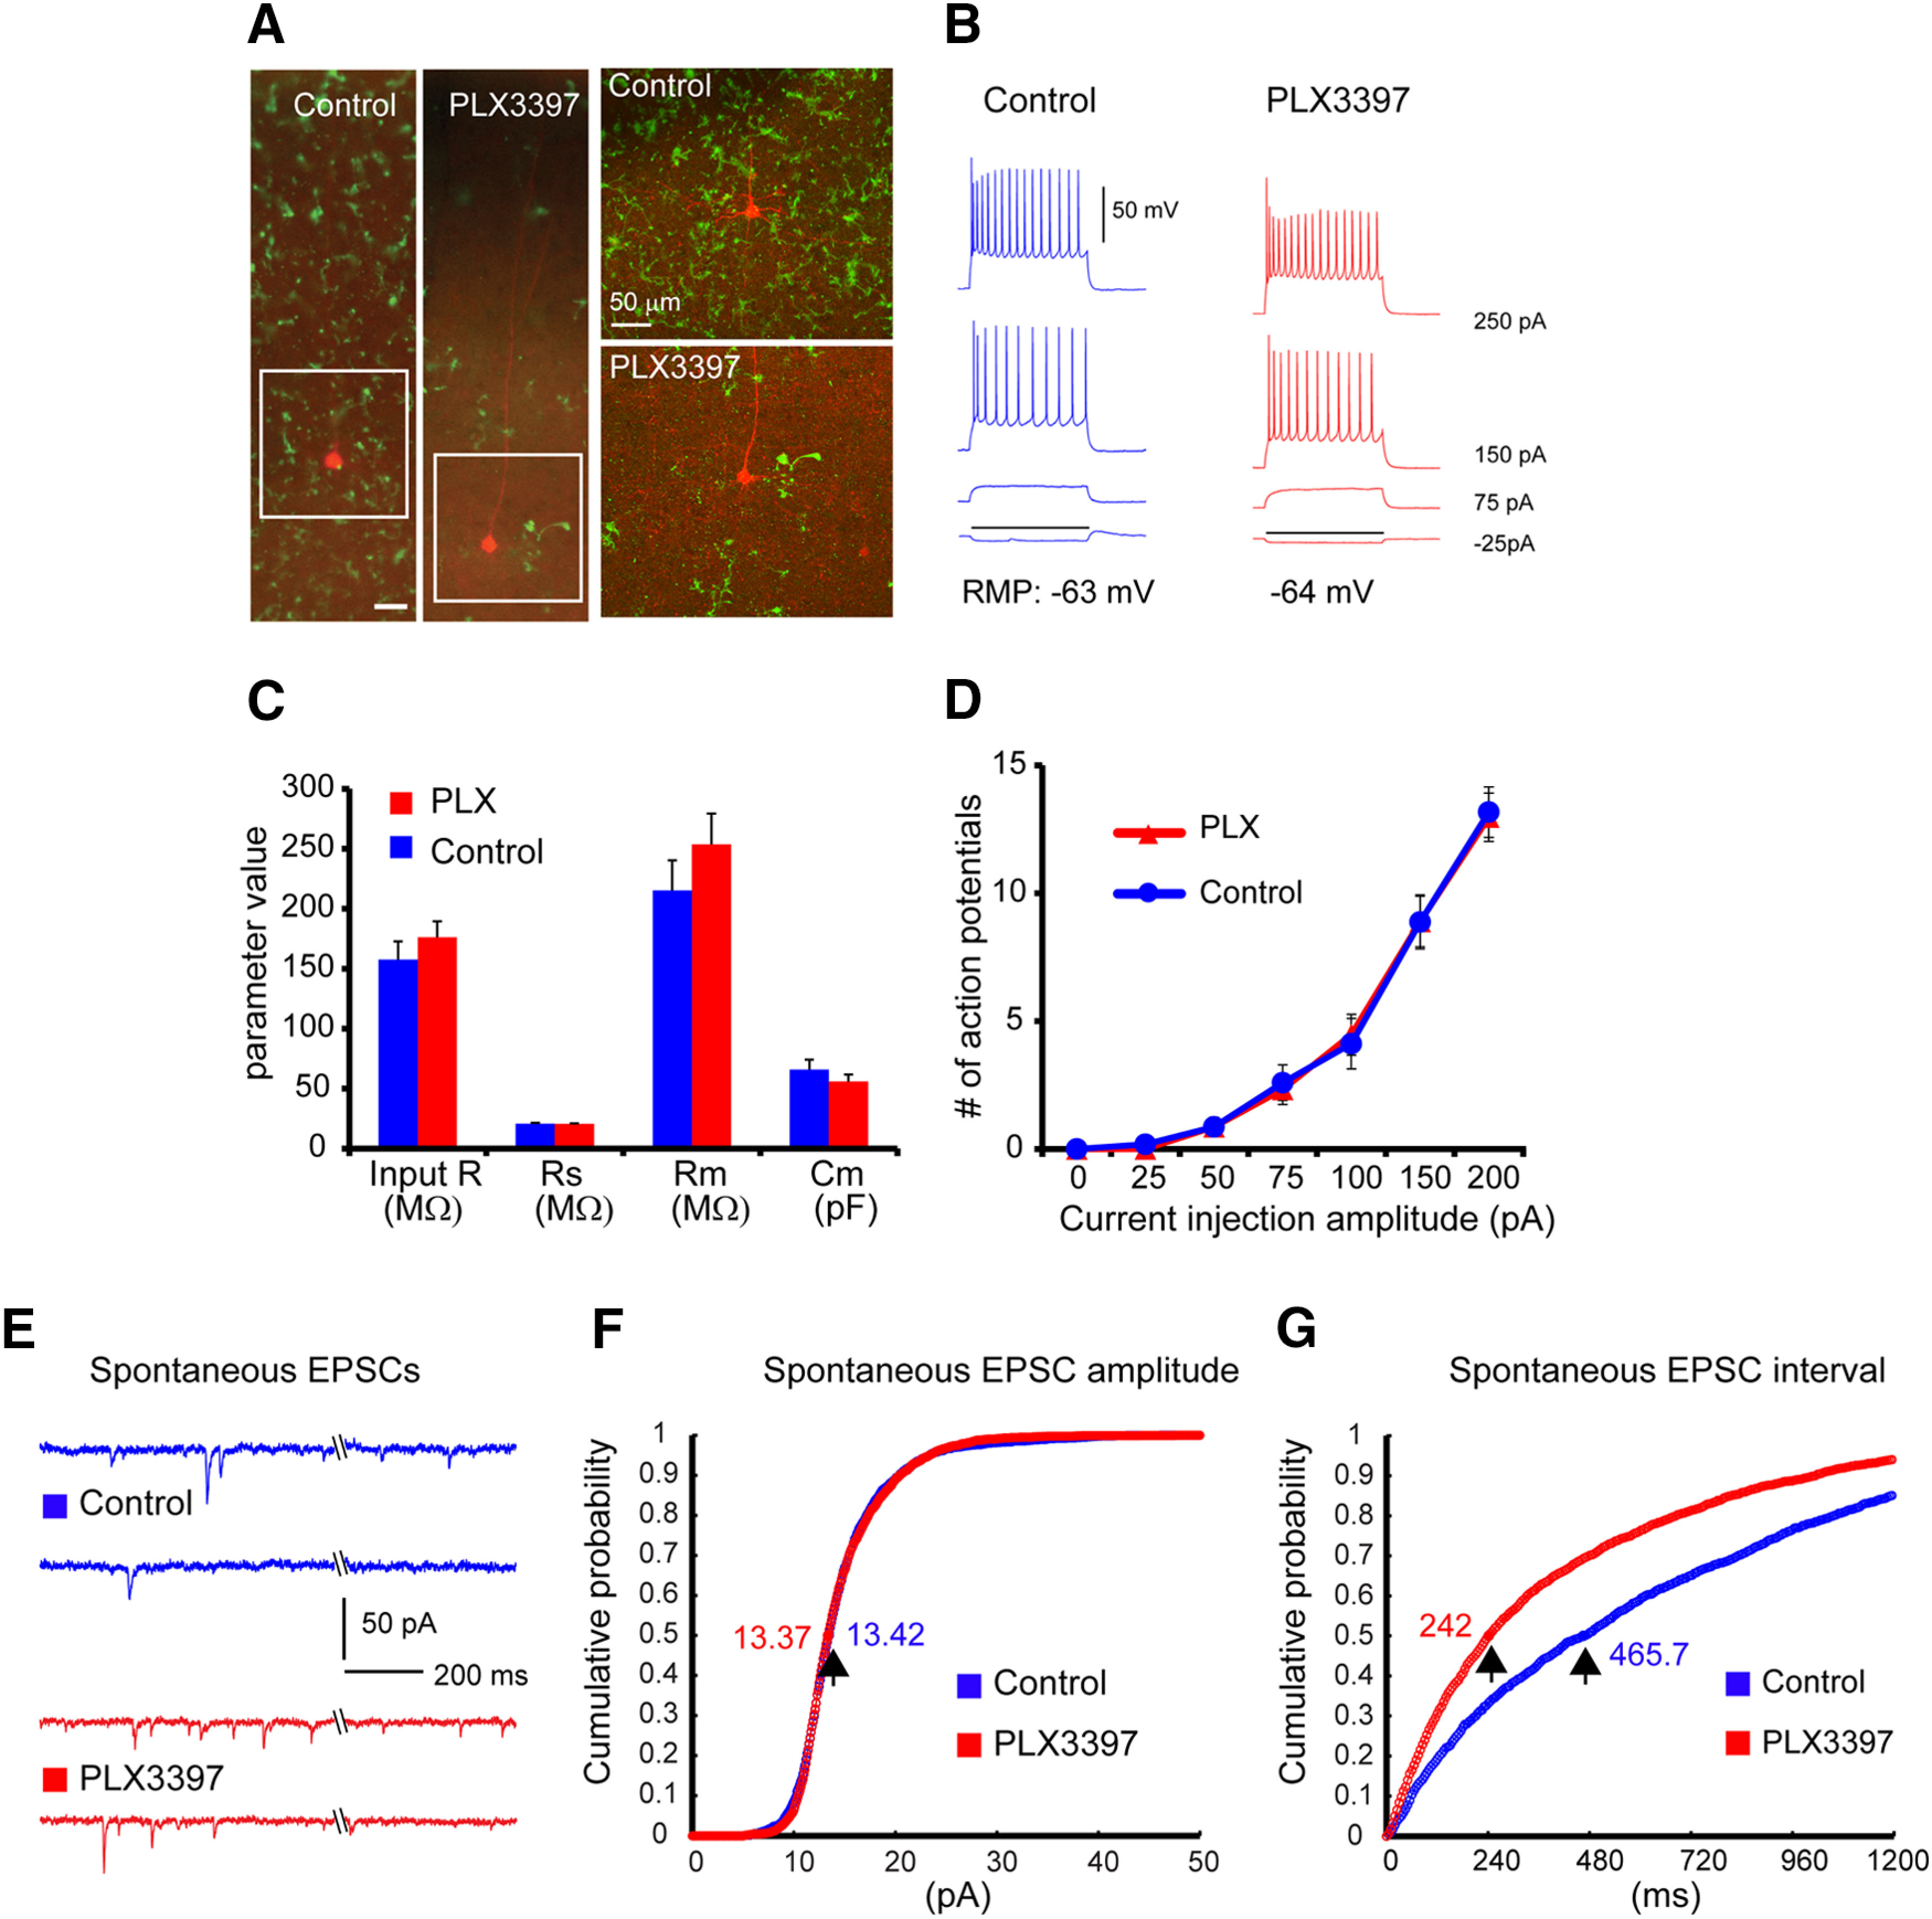
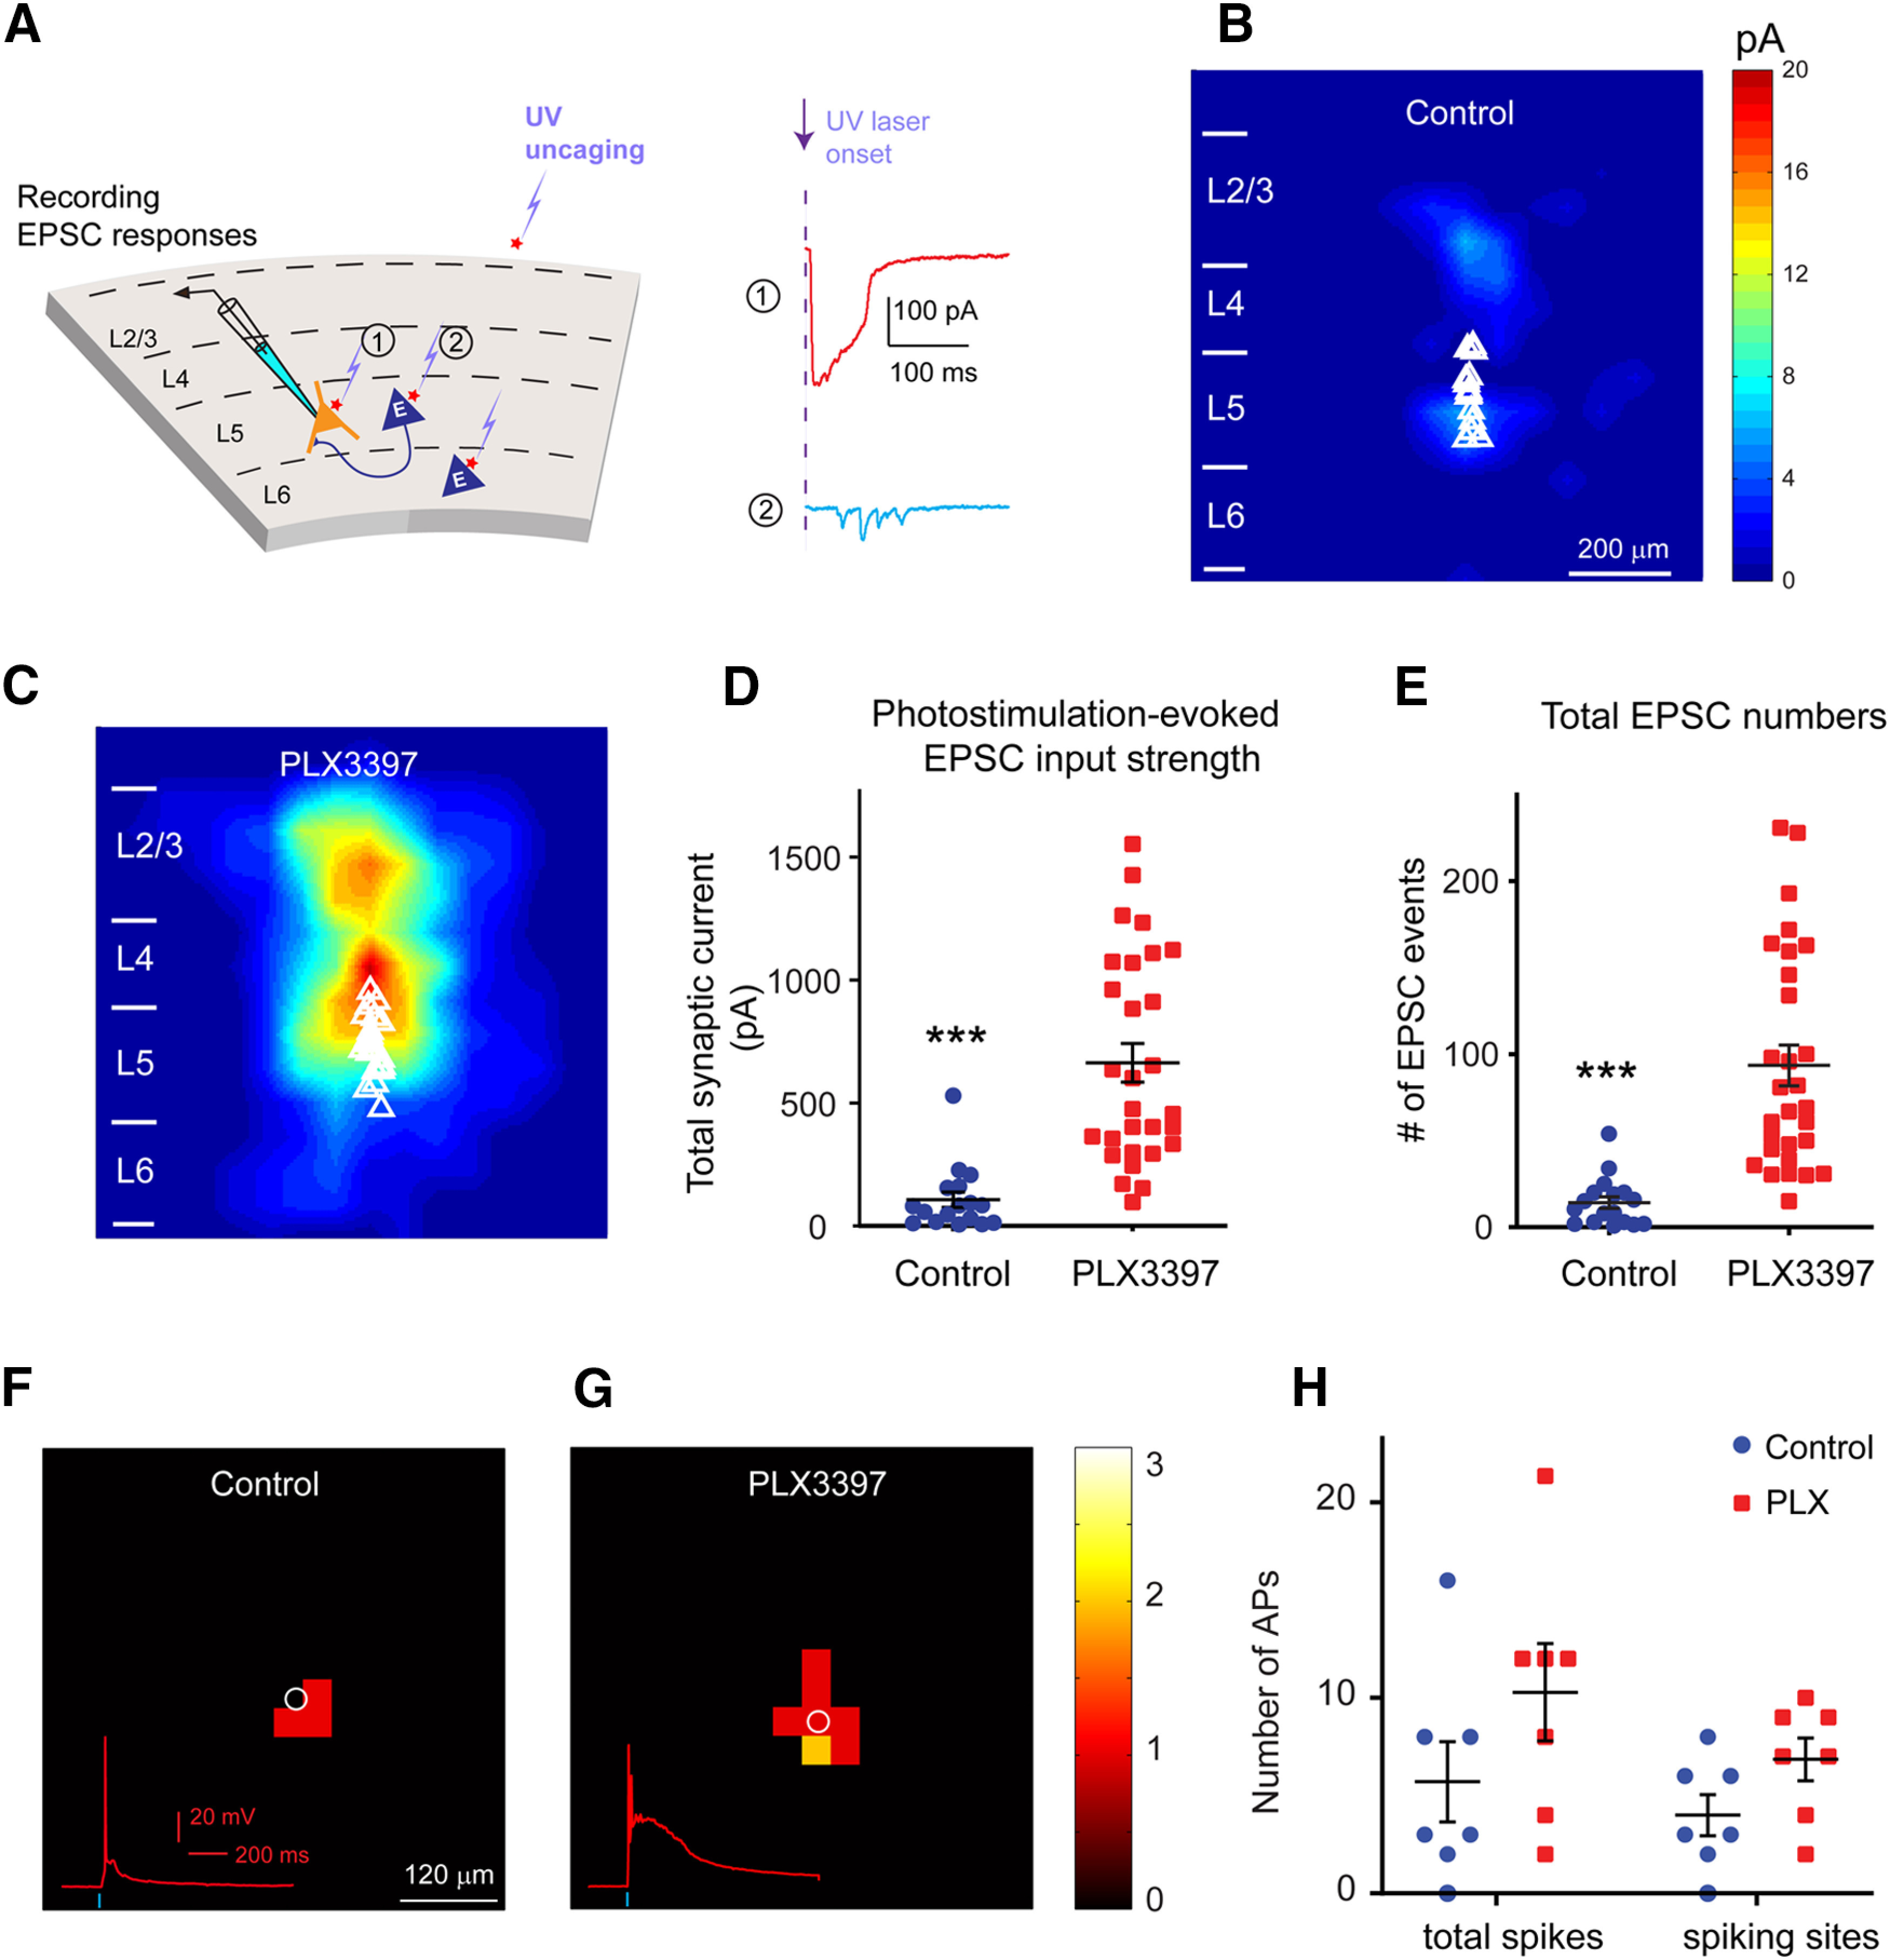
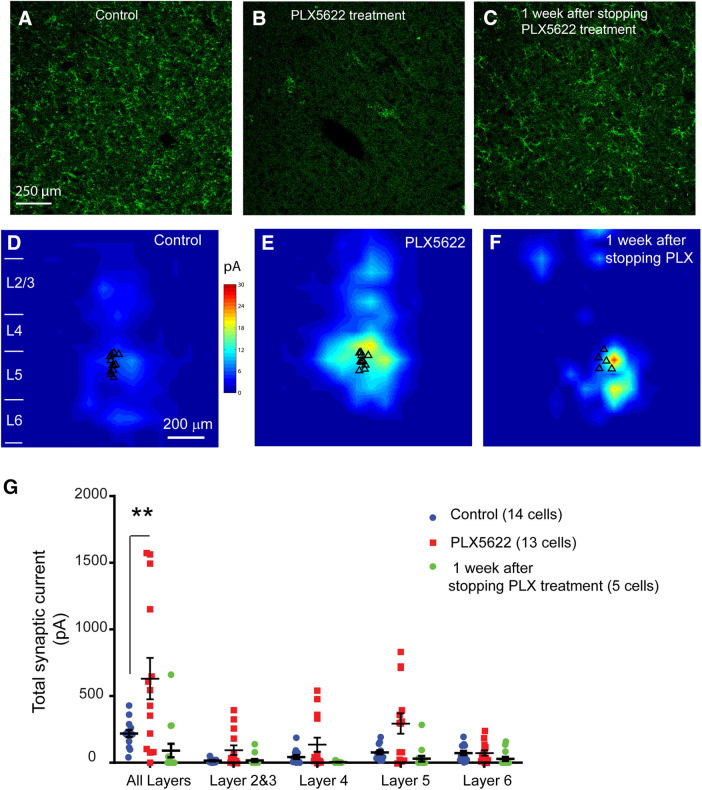
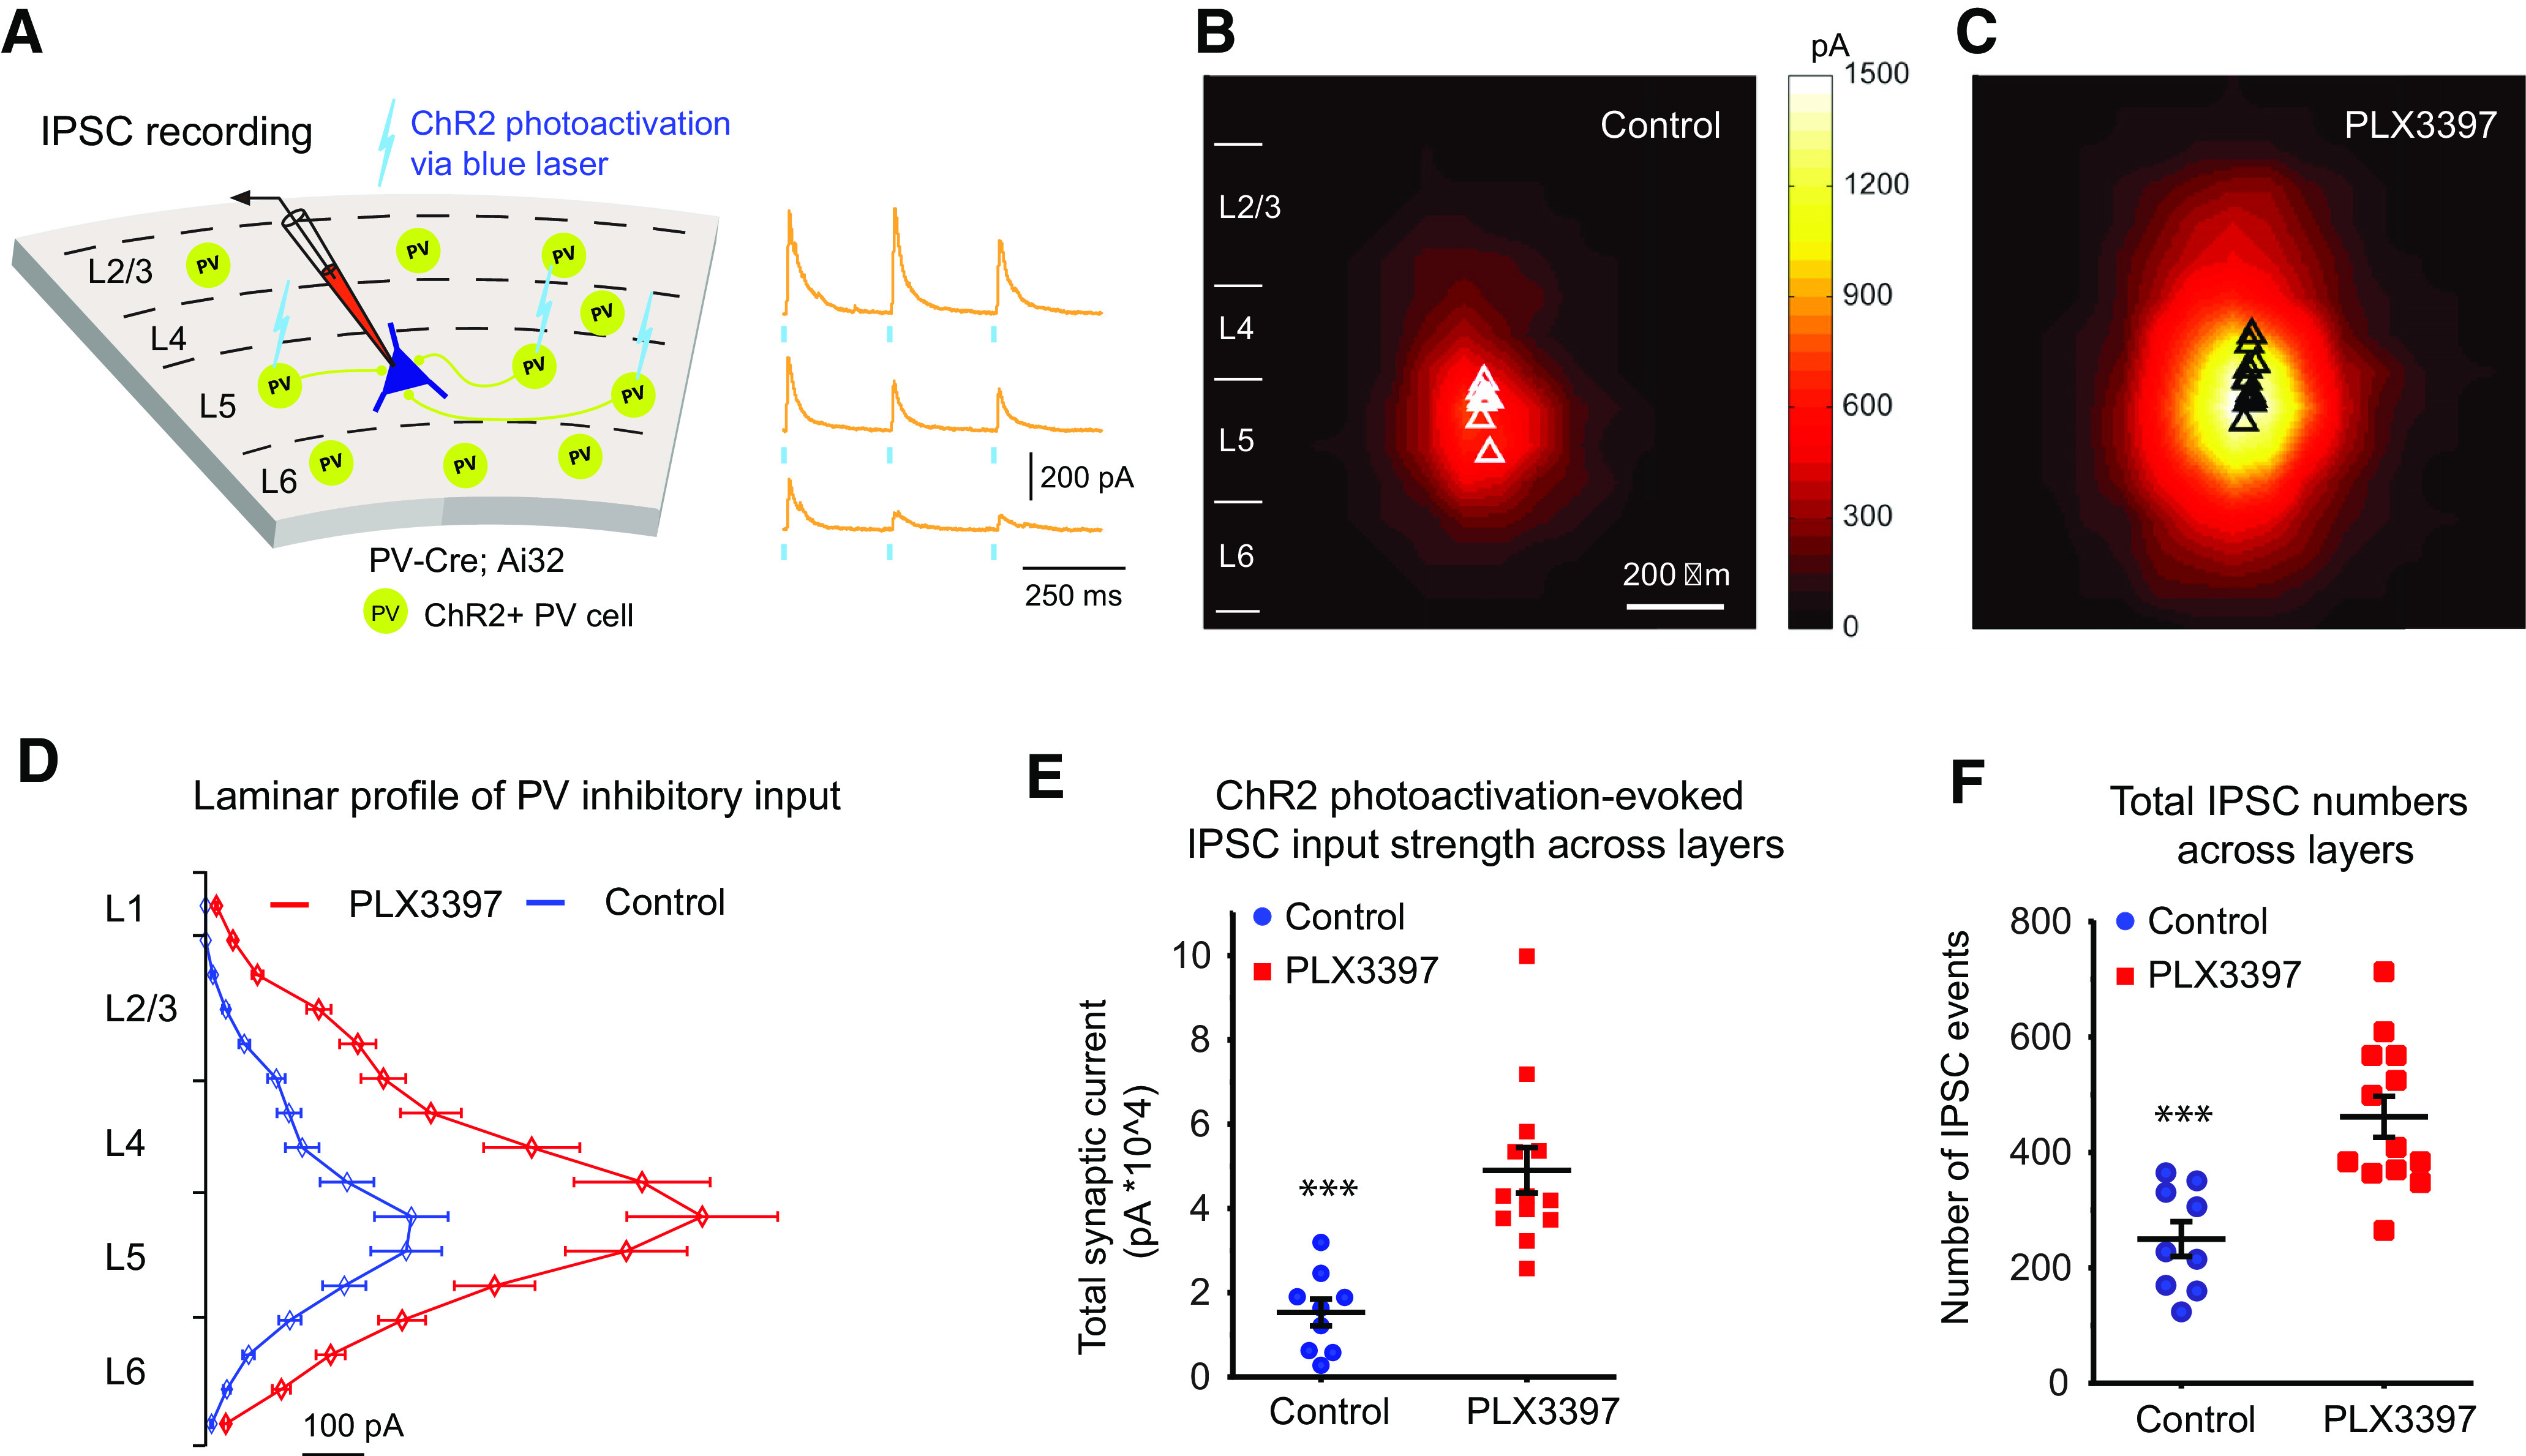
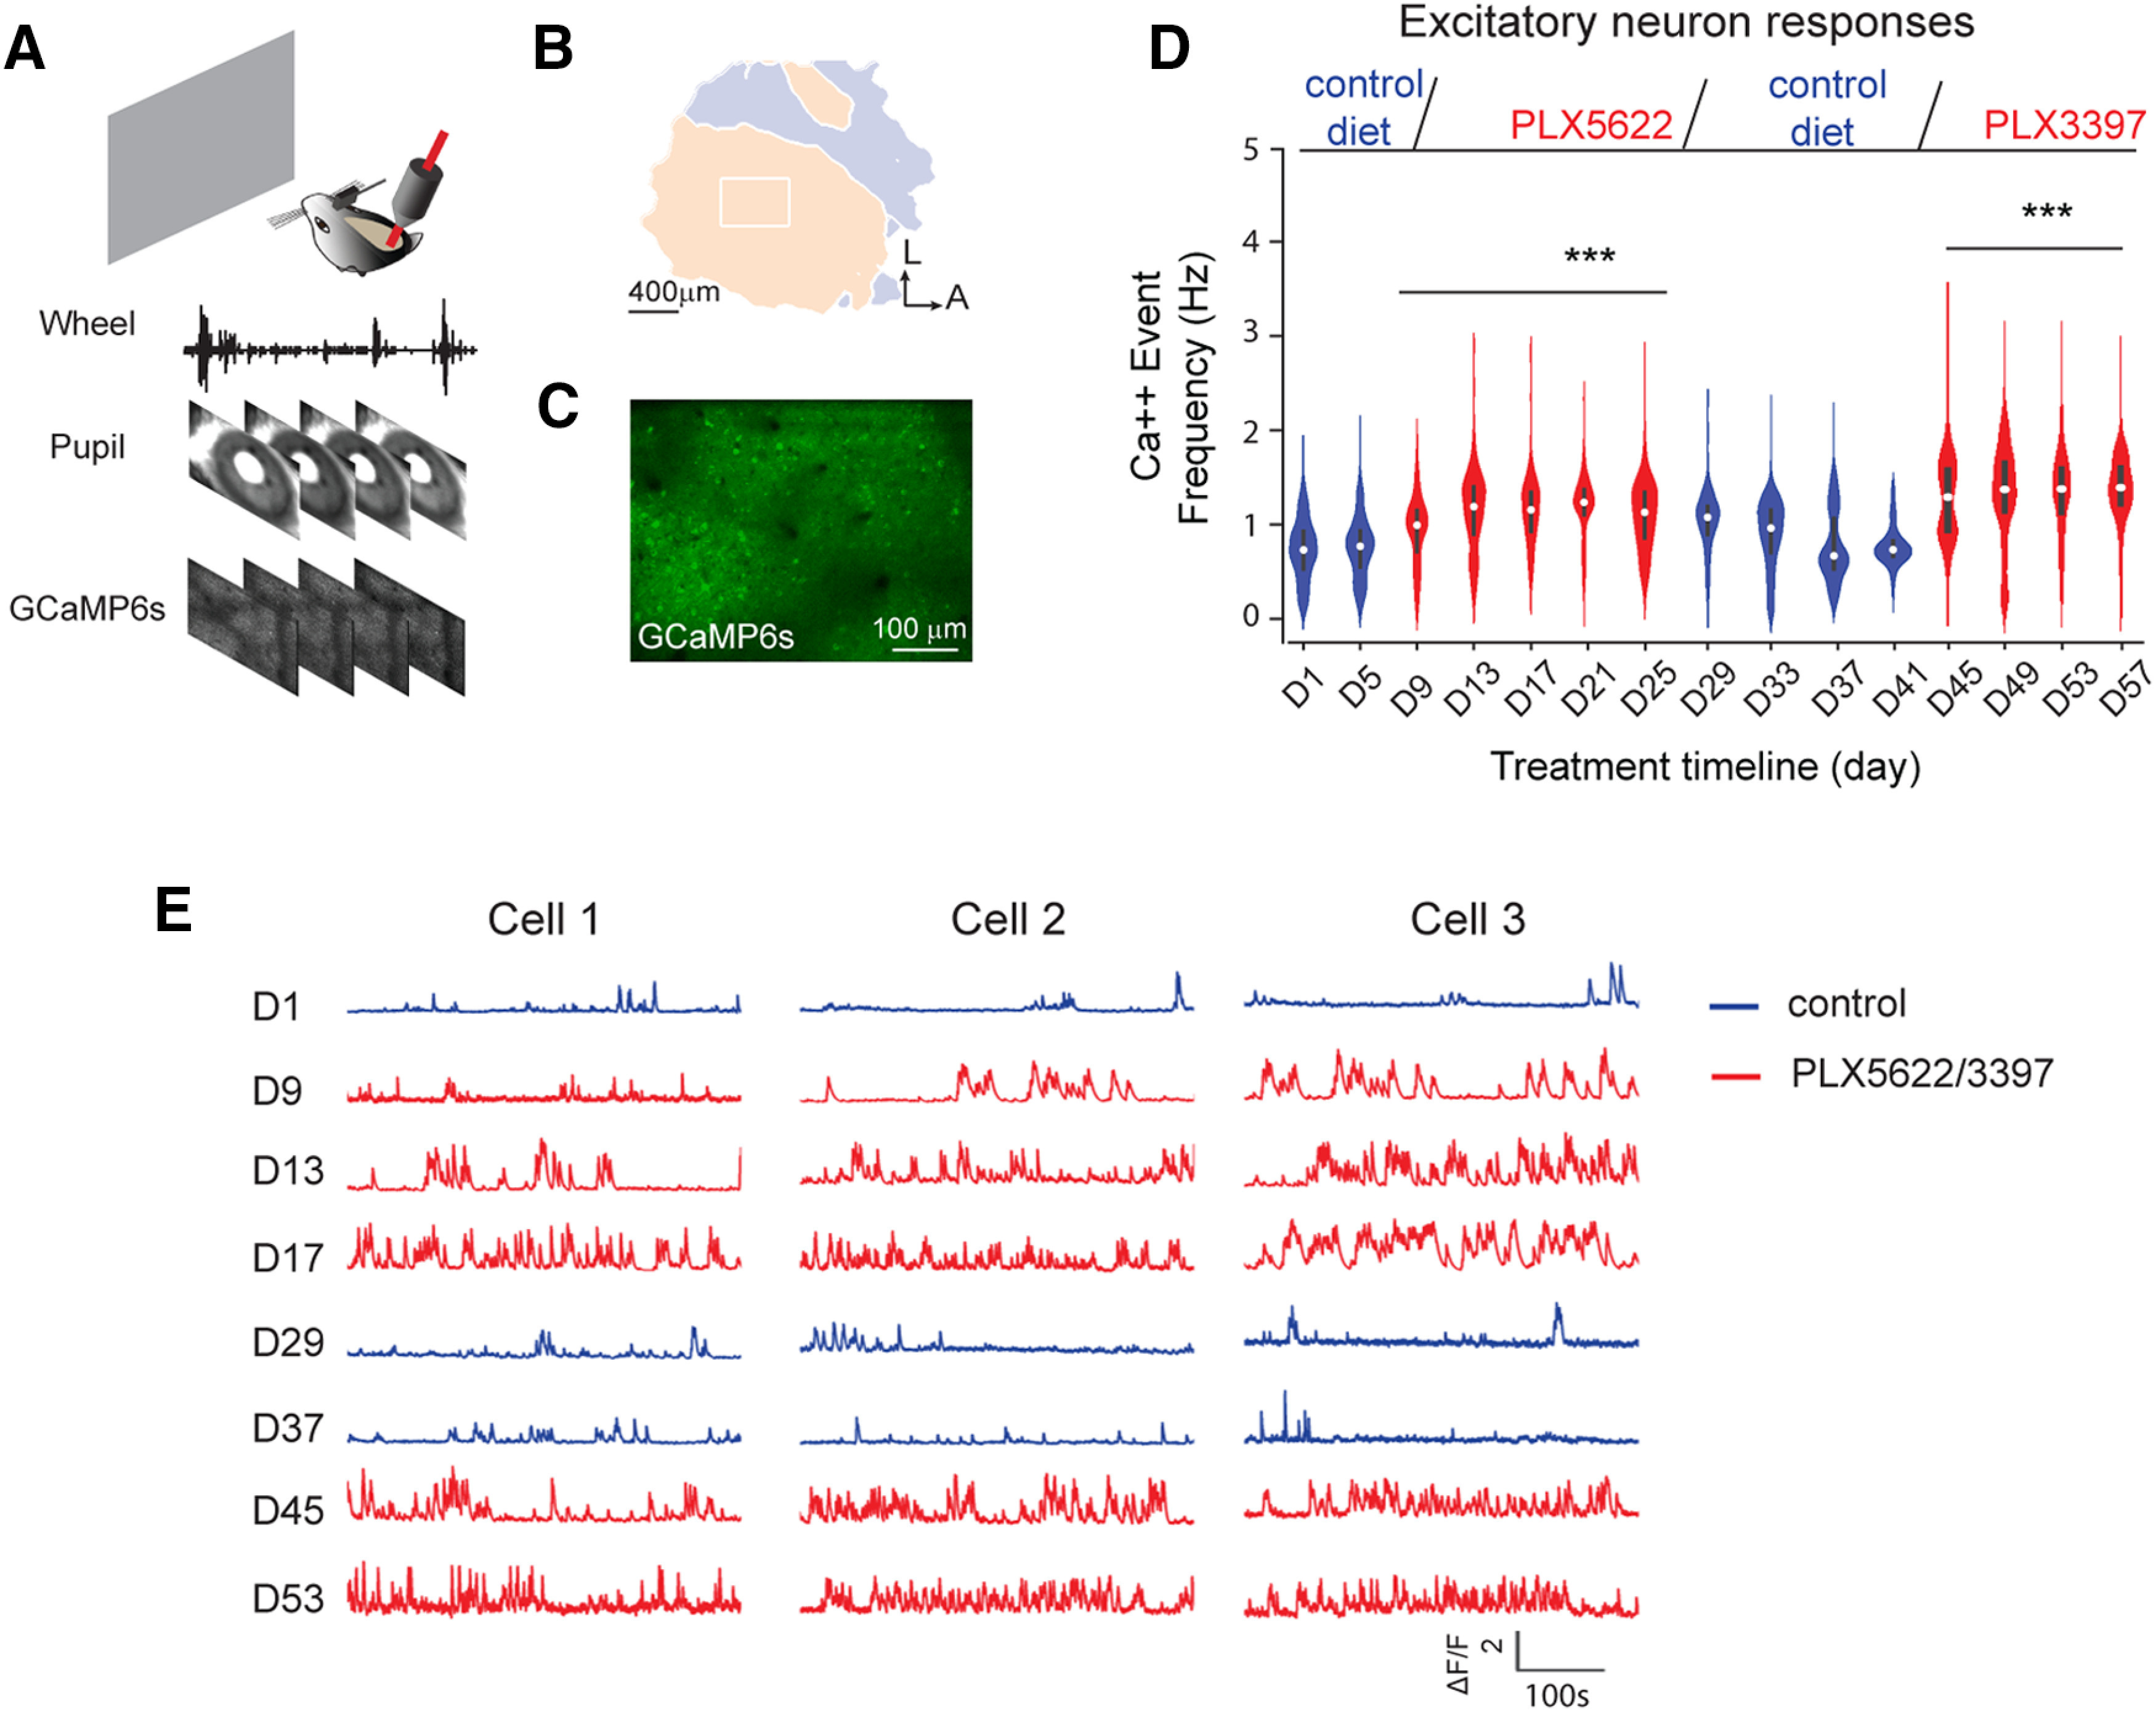
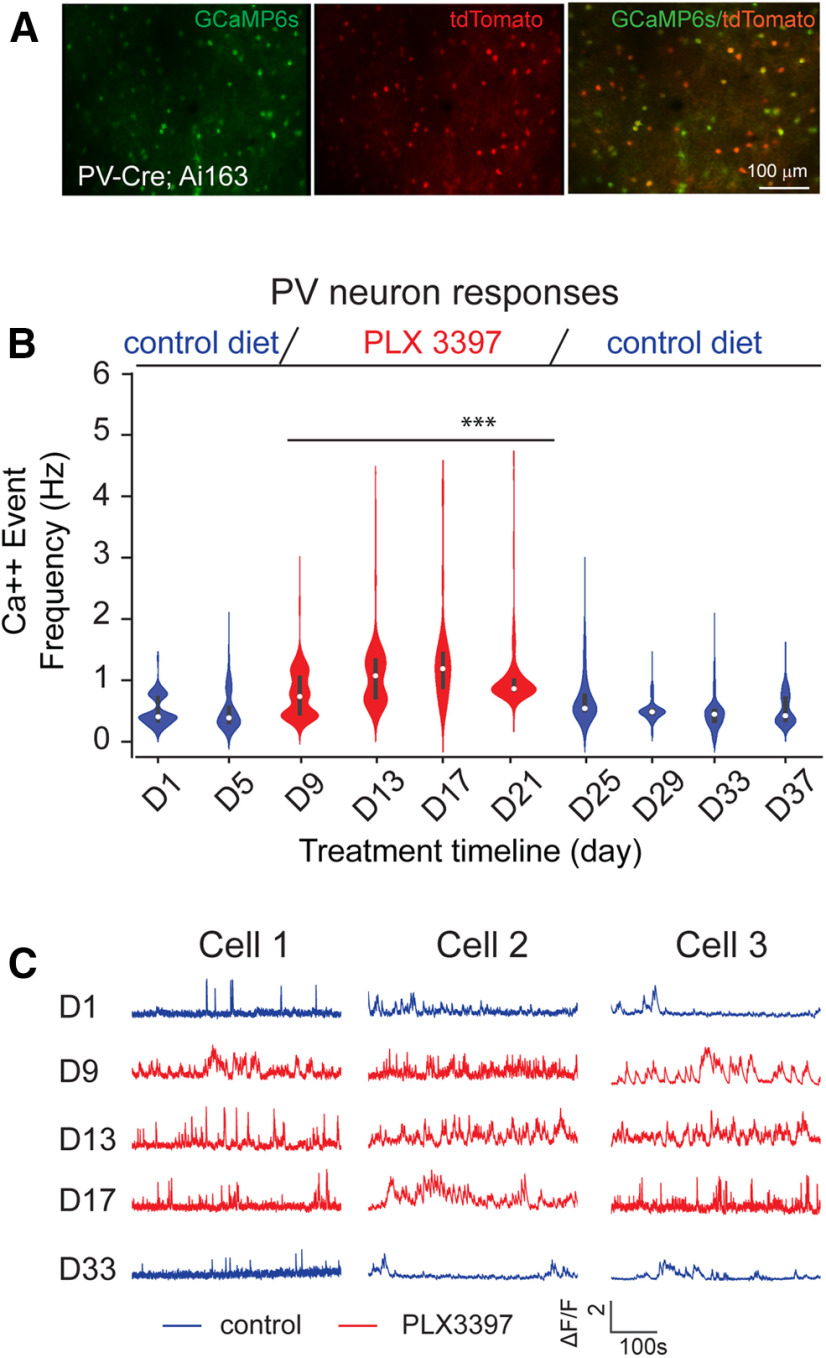
Microglia have crucial roles in sculpting synapses and maintaining neural circuits during development. To test the hypothesis that microglia continue to regulate neural circuit connectivity in adult brain, we have investigated the effects of chronic microglial depletion, via CSF1R inhibition, on synaptic connectivity in the visual cortex in adult mice of both sexes. We find that the absence of microglia dramatically increases both excitatory and inhibitory synaptic connections to excitatory cortical neurons assessed with functional circuit mapping experiments in acutely prepared adult brain slices. Microglia depletion leads to increased densities and intensities of perineuronal nets. Furthermore, in vivo calcium imaging across large populations of visual cortical neurons reveals enhanced neural activities of both excitatory neurons and parvalbumin-expressing interneurons in the visual cortex following microglia depletion. These changes recover following adult microglia repopulation. In summary, our new results demonstrate a prominent role of microglia in sculpting neuronal circuit connectivity and regulating subsequent functional activity in adult cortex.SIGNIFICANCE STATEMENT Microglia are the primary immune cell of the brain, but recent evidence supports that microglia play an important role in synaptic sculpting during development. However, it remains unknown whether and how microglia regulate synaptic connectivity in adult brain. Our present work shows chronic microglia depletion in adult visual cortex induces robust increases in perineuronal nets, and enhances local excitatory and inhibitory circuit connectivity to excitatory neurons. Microglia depletion increases in vivo neural activities of both excitatory neurons and parvalbumin inhibitory neurons. Our new results reveal new potential avenues to modulate adult neural plasticity by microglia manipulation to better treat brain disorders, such as Alzheimer's disease.

Keywords: excitatory; parvalbumin; perineuronal nets; plasticity; synaptic connections; visual cortex.


Figures

Figure 1.
Figure 1.
Microglial depletion by treatment with CSF1R inhibitors PLX3397 and PLX5622 robustly enhances PNNs. A, WT C57BL6/J mice treated for 3 weeks with control diet, or PLX3397 (290 ppm in chow) or PLX5622 (1200 ppm in chow). CD11b, S100β, and NeuN staining in visual cortex sections is shown for control (left) and PLX3397 treatment of 3 weeks (right). B, Numbers of CD11b+ cells/FOV are plotted with control and PLX3397 treatment. Microglia are reduced by ∼95% with this PLX3397 treatment (p = 0.001). C, Quantification of the number of S100β+ cells/FOV for control and PLX3397 conditions showing that astrocyte intensities were unaffected by PLX3397. D, WFA and PV staining is shown for control condition (left) and for PLX3397 treatment (right). E, Quantification shows that the numbers and intensity of WFA-positive PNNs per FOV significantly increase following 3-week-long PLX3397 treatment (p = 0.003 and p = 5.56 × 10⁻⁴). F, The PLX3397 treatment does not modulate the number and intensity of PV neurons (p = 0.335 and p = 0.056). G, WFA and PV staining following 5-week-long PLX5622 treatment. WFA and PV numbers and intensities for each condition are plotted in H and I. WFA is significantly increased with PLX5622 treatment (p = 0.002 for WFA number; and p = 0.002 for WFA intensity). Although the numbers of PV neurons are not affected (p = 0.359), PV staining intensity is significantly increased with PLX5622 treatment (p = 2.93 × 10⁻⁴). Data are mean ± SEM (samples from at least 3 mice/group). **p ≤ 0.01; ***p ≤ 0.001; two- tailed unpaired Student's t test.
Figure 2.
Figure 2.
Spontaneous EPSCs increase substantially while intrinsic electrophysiological properties of excitatory pyramidal cells are not changed following 3- to 4-week-long PLX3397 treatment. A, Example cortical slice images of mice on PLX3397 show effective depletion of microglia cells, compared with control. The slices were postfixed after physiological recordings and immunostained against the microglia marker, IBA1. The recorded excitatory cells are visualized with biocytin staining (red); green represents microglial cells. Scale bar, 50 µm. B, Hyperpolarized and depolarized responses of the representative V1 layer 5 excitatory pyramidal cells in response to intrasomatic current injections. C, Comparison of average input resistance (input R), series resistance (Rs), membrane resistance (Rm), and membrane capacitance (Cm) between excitatory pyramidal cells of mice on PLX3397 (n = 12 cells from 4 C57BL/6 mice) and control (n = 12 cells from 3 C57BL/6 mice). Data are mean ± SEM. D, The current injection-response functions do not differ between the recorded cells from PLX3397-treated and control brain slices. E, Example traces showing spontaneous EPSCs from two representative neurons in control and PLX3397-treated mice. F, Cumulative probability plots of spontaneous EPSC amplitude distribution in control (blue curve) and PLX3397 (red curve) for 6 cells each. The cumulative probability curves overlap (Mann–Whitney U test; p = 0.796), and the amplitudes at the 0.5 cumulative probability essentially are the same (13.42 vs 13.37 pA) between control and PLX treatment. G, Cumulative distribution of spontaneous EPSC intervals in control (blue) and treated (red) conditions for 6 cells each. The cumulative probability curves differ clearly (Mann–Whitney U test; p = 5.59 × 10−169), with their intervals at the 0.5 cumulative probability being 465.7 ms versus 242 ms for control and PLX treatment, respectively.
Figure 3.
Figure 3.
LSPS mapping in brain slices reveals enhanced local excitatory connections to excitatory pyramidal neurons in adult mouse visual cortex following 3-week-long PLX3397 treatment. A, Schematic of LSPS. During the experiment, a layer 5 pyramidal neuron (left) is recorded by patch clamping while stimulating its surrounding sites by short-duration UV glutamate uncaging to generate action potentials from potentially connected presynaptic neurons. Right, Example uncaging responses. Direct uncaging responses (1, red) are excluded from synaptic input analysis, and synaptically mediated EPSC responses (2, cyan) are plotted to show latency and amplitude characteristics of synaptic inputs from presynaptic neuronal spiking. B, C, The averaged photostimulation-evoked EPSC input maps from visual cortex in control mice (n = 17 cells from 8 mice) and PLX3397 treatment mice (n = 29 cells from 10 mice), respectively. D, Average strengths of summed EPSC inputs in mice treated with PLX3397 (n = 29 cells) increase significantly compared with control cells (n = 17 cells) in adult mice (p = 1.48 × 10⁻⁶). E, The numbers of total EPSC input events per cell for each group differ significantly (control vs PLX3397, p = 3.97 × 10⁻⁷). Data are mean ± SEM. ***p < 0.001 (Mann–Whitney U tests). F–H, Spiking excitation profiles of excitatory neurons measured by glutamate uncaging show a trend of increase in excitability for the recorded cells in PLX3397-treated cortex (n = 7 cells from 4 mice), compared with controls (n = 7 cells from 4 mice; p = 0.17 for total spikes; p = 0.085 for spiking sites, Mann–Whitney U test).
Figure 4.
Figure 4.
Microglial removal by a second CSFR1 inhibitor, PLX5622, shows similar effects on excitatory circuit connectivity, compared with the PLX3397 treatment. A–C, Example cortical images of IBA1 staining of microglia in control cortex, PLX5622-treated cortex, and the cortex repopulated with microglia 1 week after stopping PLX5622 treatment. D–F, The averaged photostimulation-evoked EPSC input maps of visual cortex in control mice in D, PLX5622 treatment mice in E, and repopulated cortex in F. G, Photostimulation-evoked EPSC inputs of recorded layer 5 excitatory neurons differ significantly between control (n = 14 cells from 4 mice) and 3-week-long PLX5622-treated groups (n = 13 cells from 4 mice) (p = 0.027; Mann–Whitney U test). Also, the enhanced cortical connectivity of layer 5 excitatory cells (n = 5 cells from 4 mice) is reversed with microglia repopulation at a week after stopping PLX5622 treatment, as the total inputs of these cells did not differ from control cells in adult cortex (p = 0.559). Data are plotted as mean ± SEM. **p < 0.05. In addition to all-layers inputs, cortical layer specific inputs are also plotted.
Figure 5.
Figure 5.
Microglia depletion with PLX3397 increases PV-specific inhibitory inputs to excitatory neurons in mouse visual cortex as assessed by ChR2-mediated circuit mapping. A, Illustration of IPSC recordings by optogenetically evoking PV inhibitory inputs to a layer 5 pyramidal neuron in PV-Cre;Ai32 mice. The IPSCs from three locations of ChR2 photoactivation are shown on the right. Short blue vertical lines beneath the yellow response traces indicate 0.25 ms blue laser stimulation. B, Average IPSCs input maps (n = 9 cells from 4 mice) in control mice. C, Average IPSC input maps (n = 13 cells from 4 mice) in PLX3397-treated mice. D, Plot of IPSCs from PV interneurons across the entire L1-L6 visual cortical layers for control mice (blue curve) and PLX3397 mice (red curve). E, Average ChR2 photoactivation-evoked IPSC input strength in the PLX3397 treatment group is 3 times greater than in the control group (p = 1.4 × 10⁻⁴, Mann–Whitney U test). F, The average total IPSC event number in the PLX3397 treatment group is 2 times higher than in the control group (p = 6.6 × 10⁻⁴). Data are mean ± SEM. ***p < 0.001.
Figure 6.
Figure 6.
In vivo two-photon calcium imaging reveals that microglia depletion enhances V1 excitatory neuron activity. A, A schematic illustration of in vivo two-photon imaging setup for a head-fixed awake mouse. During recording sessions, GCaMP6s calcium signals were recorded from V1 excitatory neurons; wheel tracking and pupil sizes were recorded simultaneously to determine animal running and eye movements. B, A color-coded visual field map of visual cortex (left) is mapped before two-photon imaging. The imaging area (the white rectangle) is located within binocular V1. C, A z-projection image from the top surface view of the mouse cortex expressing GCaMP6s in excitatory neurons. D, The violin plot graph of average calcium event frequencies of excitatory neurons (1144-1564 neurons from 5 mice; violin plot with median ± SEM) as the mice viewed a gray screen during different conditions, including 5 d of the control condition, 3 weeks of depletion of microglia with the PLX5622 treatment, 2 weeks of microglia recovery, and 2 weeks of microglia redepletion with PLX3397. Top, Experimental timeline. Blue violins represent control or microglia repopulation groups. Red violins represent microglia depletion conditions. Neural activity was recorded every 4 d, and was compared with neural activity on day 1 (D1) of control condition. Linear mixed-effects model analysis, overall: p = 5.19 × 10⁻³¹. ***p < 0.001. E, Example calcium activity traces of three representative V1 excitatory neurons under control, microglia depletion, microglia repopulation, and microglia redepletion conditions. Blue traces represent calcium activity under control or microglia repopulation condition. Red traces represent activity under microglia depletion conditions.
Figure 7.
Figure 7.
In vivo two-photon calcium imaging reveals that microglia depletion enhances PV interneuron activity. A, A representative cortical image of PV-Cre;Ai163 mice with PV interneurons (tdTomato, red) coexpressing GCaMP6s (green). B, A violin plot graph of average calcium event frequencies of PV inhibitory neurons (violin plot with median ± SEM) across the control chow condition (blue), microglia depletion by PLX3397 treatment (red), and microglia repopulation (blue). A total of 541-733 neurons from 3 mice are included for analysis. Neural activity was recorded every 4 d and was compared with neural activity on day 1 (D1) of control condition. Linear mixed-effects model analysis, overall: p = 6.27 × 10⁻⁴. ***p < 0.001. C, Example calcium activity traces of three PV neurons from PV-Cre;Ai163 mice across control, microglia depletion, and microglia repopulation conditions.

Comment in

Similar articles

Cited by

References

    1. Baohan A, Ikrar T, Tring E, Xu X, Trachtenberg JT (2016) Pten and EphB4 regulate the establishment of perisomatic inhibition in mouse visual cortex. Nat Commun 7:12829. 10.1038/ncomms12829 - DOI - PMC - PubMed
    1. Brückner G, Grosche J, Schmidt S, Hartig W, Margolis RU, Delpech B, Seidenbecher CI, Czaniera R, Schachner M (2000) Postnatal development of perineuronal nets in wild-type mice and in a mutant deficient in tenascin-R. J Comp Neurol 428:616–629. 10.1002/1096-9861(20001225)428:4<616::AID-CNE3>3.0.CO;2-K - DOI - PubMed
    1. Cardin JA, Carlen M, Meletis K, Knoblich U, Zhang F, Deisseroth K, Tsai LH, Moore CI (2009) Driving fast-spiking cells induces gamma rhythm and controls sensory responses. Nature 459:663–667. 10.1038/nature08002 - DOI - PMC - PubMed
    1. Carulli D, Pizzorusso T, Kwok JC, Putignano E, Poli A, Forostyak S, Andrews MR, Deepa SS, Glant TT, Fawcett JW (2010) Animals lacking link protein have attenuated perineuronal nets and persistent plasticity. Brain 133:2331–2347. 10.1093/brain/awq145 - DOI - PubMed
    1. Chu Y, Jin X, Parada I, Pesic A, Stevens B, Barres B, Prince DA (2010) Enhanced synaptic connectivity and epilepsy in C1q knockout mice. Proc Natl Acad Sci USA 107:7975–7980. 10.1073/pnas.0913449107 - DOI - PMC - PubMed

Publication types

MeSH terms