. 2020 Dec 30;10(1):22426.
doi: 10.1038/s41598-020-80078-7.

Fluid dynamics of COVID-19 airborne infection suggests urgent data for a scientific design of social distancing

Affiliations

Fluid dynamics of COVID-19 airborne infection suggests urgent data for a scientific design of social distancing

M E Rosti et al. Sci Rep. .

Abstract

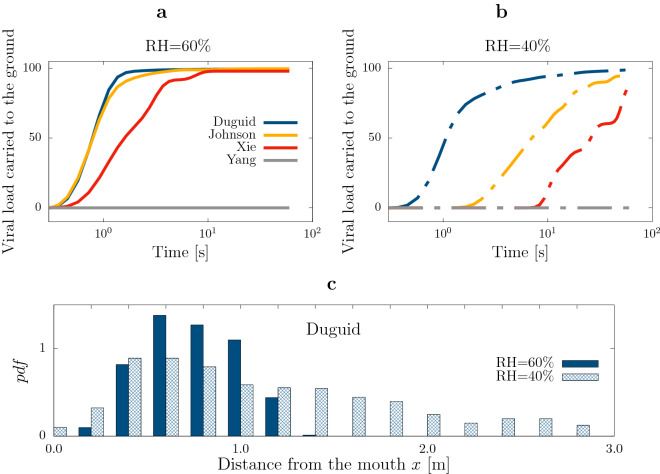
The COVID-19 pandemic is largely caused by airborne transmission, a phenomenon that rapidly gained the attention of the scientific community. Social distancing is of paramount importance to limit the spread of the disease, but to design social distancing rules on a scientific basis the process of dispersal of virus-containing respiratory droplets must be understood. Here, we demonstrate that available knowledge is largely inadequate to make predictions on the reach of infectious droplets emitted during a cough and on their infectious potential. We follow the position and evaporation of thousands of respiratory droplets by massive state-of-the-art numerical simulations of the airflow caused by a typical cough. We find that different initial distributions of droplet size taken from literature and different ambient relative humidity lead to opposite conclusions: (1) most versus none of the viral content settles in the first 1-2 m; (2) viruses are carried entirely on dry nuclei versus on liquid droplets; (3) small droplets travel less than [Formula: see text] versus more than [Formula: see text]. We point to two key issues that need to be addressed urgently in order to provide a scientific foundation to social distancing rules: (I1) a careful characterisation of the initial distribution of droplet sizes; (I2) the infectious potential of viruses carried on dry nuclei versus liquid droplets.


Conflict of interest statement

The authors declare no competing interests.

Figures

Figure 1
Figure 1
Airflow generated during coughing. (a) Evolution of the relative humidity in space and time. After the end of the exhalation, the emitted air behaves as a turbulent puff growing in length as t1/4 and decaying in amplitude as t-3/4 (the latter is shown in Fig Supplementary 1). (b) Droplet initial size distributions considered in the present study: Duguid (blue), Johnson et al. (yellow), Xie et al. (red), Yang et al. (gray). (c) Relative humidity (color coded) and exhaled droplets (blue and gray spheres, not in scale) after 7.6s considering two different initial droplet size distributions: (top) Duguid; (bottom) Yang et al. showcases the dramatic differences in predictions depending on the initial distribution of droplet sizes. The distribution of droplet sizes from Duguid contains large droplets that rapidly settle carrying most viral load on the ground, as well as many small droplets which remain airborne. In contrast, in the size distribution from Yang et al. all droplets are small enough to remain airborne for the entire simulation. The ambient RH is 60% in all figures. Scale bar: 50 cm.
Figure 2
Figure 2
Sedimentation of large droplets. (a) Cumulative viral load sedimenting to the ground, obtained with the four different initial droplet size distributions proposed by Duguid (blue), Johnson et al. (yellow), Xie et al. (red) and Yang et al. (gray). Here, the ambient relative humidity is RH = 60%. (b) Same as (a), for a dry environment, RH = 40%. Most of the viral load settles within 60s for three initial distributions, whereas for one, Yang et al., no droplets settle within the simulation time. (c) Probability density function of the distance from the mouth when droplets reach the ground; ambient relative humidity RH=60% (solid blue) and RH=40% (patterned blue). Drier environments cause further spreading: Droplets that reach the ground remain within 1m from the mouth in wet conditions, whereas they can reach nearly 3m in dry conditions.
Figure 3
Figure 3
Airborne-transmitted droplets. (a, d) Cumulative viral load per unit area (% viral load/m2) reaching a distance of 2m from the mouth after 60s. Results obtained with RH=40% using the distribution by Duguid and Yang et al. (a left and right respectively) and using the distribution by Duguid with RH=60% and 40% (d left and right respectively). (b, c) Probability density function of droplet evaporation time (i.e. time for the droplet to shrink to its final radius; only airborne droplets in the observation time of 60s are considered). (b) Results with ambient RH=60% for the four different initial droplet size distributions, i.e. Duguid (blue), Johnson et al. (yellow), Xie et al. (red) and Yang et al. (gray). (c) Results for the distribution by Duguid with ambient RH=60% (solid) and RH=40% (dashed). The initial size distribution and the ambient humidity cause dramatic differences in the reach of airborne droplets, with variations of the order of 80% for the mean value. (e) Trajectory of the viral load center of mass (computed considering only the airborne droplets and not those that already settled on the ground) for the simulation labeled WetDu; horizontal position xCM (green) and vertical position zCM (magenta). The solid lines indicate the results from the simulation while the dashed ones are extrapolations over longer time as discussed in the Methods section. (f) Extrapolated horizontal distance travelled by the viral load center of mass for the eight numerical experiments performed.

References

    1. Bahl P, Doolan C, de Silva C, Chughtai AA, Bourouiba L, MacIntyre CR. Airborne or droplet precautions for health workers treating coronavirus disease 2019? J. Infect. Dis. 2020 doi: 10.1093/infdis/jiaa189. - DOI - PMC - PubMed
    1. Bourouiba L. Turbulent gas clouds and respiratory pathogen emissions: potential implications for reducing transmission of COVID-19. JAMA. 2020;323:1837–1838. - PubMed
    1. Mittal R, Ni R, Seo J. The flow physics of COVID-19. J. Fluid Mech. 2020;894:F2. doi: 10.1017/jfm.2020.330. - DOI
    1. Lewis D. Mounting evidence suggests coronavirus is airborne—but health advice has not caught up. Nature. 2020;583:510–513. doi: 10.1038/d41586-020-02058-1. - DOI - PubMed
    1. Seminara G, Carli B, Forni G, Fuzzi S, Mazzino A, Rinaldo A. Biological fluid dynamics of airborne COVID-19 infection. Rend. Fis. Acc. Lincei. 2020;31:505–537. doi: 10.1007/s12210-020-00938-2. - DOI - PMC - PubMed

Publication types