Review
. 2021;217(1):4.
doi: 10.1007/s11214-020-00777-5. Epub 2020 Dec 21.

The SuperCam Instrument Suite on the NASA Mars 2020 Rover: Body Unit and Combined System Tests

Roger C Wiens  1 Sylvestre Maurice  2 Scott H Robinson  1 Anthony E Nelson  1 Philippe Cais  3 Pernelle Bernardi  4 Raymond T Newell  1 Sam Clegg  1 Shiv K Sharma  5 Steven Storms  1 Jonathan Deming  1 Darrel Beckman  1 Ann M Ollila  1 Olivier Gasnault  2 Ryan B Anderson  6 Yves André  7 S Michael Angel  8 Gorka Arana  9 Elizabeth Auden  1 Pierre Beck  10 Joseph Becker  1 Karim Benzerara  11 Sylvain Bernard  11 Olivier Beyssac  11 Louis Borges  1 Bruno Bousquet  12 Kerry Boyd  1 Michael Caffrey  1 Jeffrey Carlson  13 Kepa Castro  9 Jorden Celis  1 Baptiste Chide  14   2 Kevin Clark  13 Edward Cloutis  15 Elizabeth C Cordoba  13 Agnes Cousin  2 Magdalena Dale  1 Lauren Deflores  13 Dorothea Delapp  1 Muriel Deleuze  7 Matthew Dirmyer  1 Christophe Donny  7 Gilles Dromart  16 M George Duran  1 Miles Egan  5 Joan Ervin  13 Cecile Fabre  17 Amaury Fau  11 Woodward Fischer  18 Olivier Forni  2 Thierry Fouchet  4 Reuben Fresquez  1 Jens Frydenvang  19 Denine Gasway  1 Ivair Gontijo  13 John Grotzinger  18 Xavier Jacob  20 Sophie Jacquinod  4 Jeffrey R Johnson  21 Roberta A Klisiewicz  1 James Lake  1 Nina Lanza  1 Javier Laserna  22 Jeremie Lasue  2 Stéphane Le Mouélic  23 Carey Legett 4th  1 Richard Leveille  24 Eric Lewin  10 Guillermo Lopez-Reyes  25 Ralph Lorenz  21 Eric Lorigny  7 Steven P Love  1 Briana Lucero  1 Juan Manuel Madariaga  9 Morten Madsen  19 Soren Madsen  13 Nicolas Mangold  23 Jose Antonio Manrique  25 J P Martinez  1 Jesus Martinez-Frias  26 Kevin P McCabe  1 Timothy H McConnochie  27 Justin M McGlown  1 Scott M McLennan  28 Noureddine Melikechi  29 Pierre-Yves Meslin  2 John M Michel  1 David Mimoun  14 Anupam Misra  5 Gilles Montagnac  16 Franck Montmessin  30 Valerie Mousset  7 Naomi Murdoch  14 Horton Newsom  31 Logan A Ott  1 Zachary R Ousnamer  13 Laurent Pares  2 Yann Parot  2 Rafal Pawluczyk  32 C Glen Peterson  1 Paolo Pilleri  2 Patrick Pinet  2 Gabriel Pont  7 Francois Poulet  33 Cheryl Provost  32 Benjamin Quertier  3 Heather Quinn  1 William Rapin  11 Jean-Michel Reess  4 Amy H Regan  1 Adriana L Reyes-Newell  1 Philip J Romano  13 Clement Royer  33 Fernando Rull  25 Benigno Sandoval  1 Joseph H Sarrao  1 Violaine Sautter  11 Marcel J Schoppers  13 Susanne Schröder  34 Daniel Seitz  1 Terra Shepherd  1 Pablo Sobron  35 Bruno Dubois  36 Vishnu Sridhar  13 Michael J Toplis  2 Imanol Torre-Fdez  9 Ian A Trettel  13 Mark Underwood  13 Andres Valdez  1 Jacob Valdez  1 Dawn Venhaus  1 Peter Willis  13
Affiliations
Review

The SuperCam Instrument Suite on the NASA Mars 2020 Rover: Body Unit and Combined System Tests

Roger C Wiens et al. Space Sci Rev. 2021.

Abstract

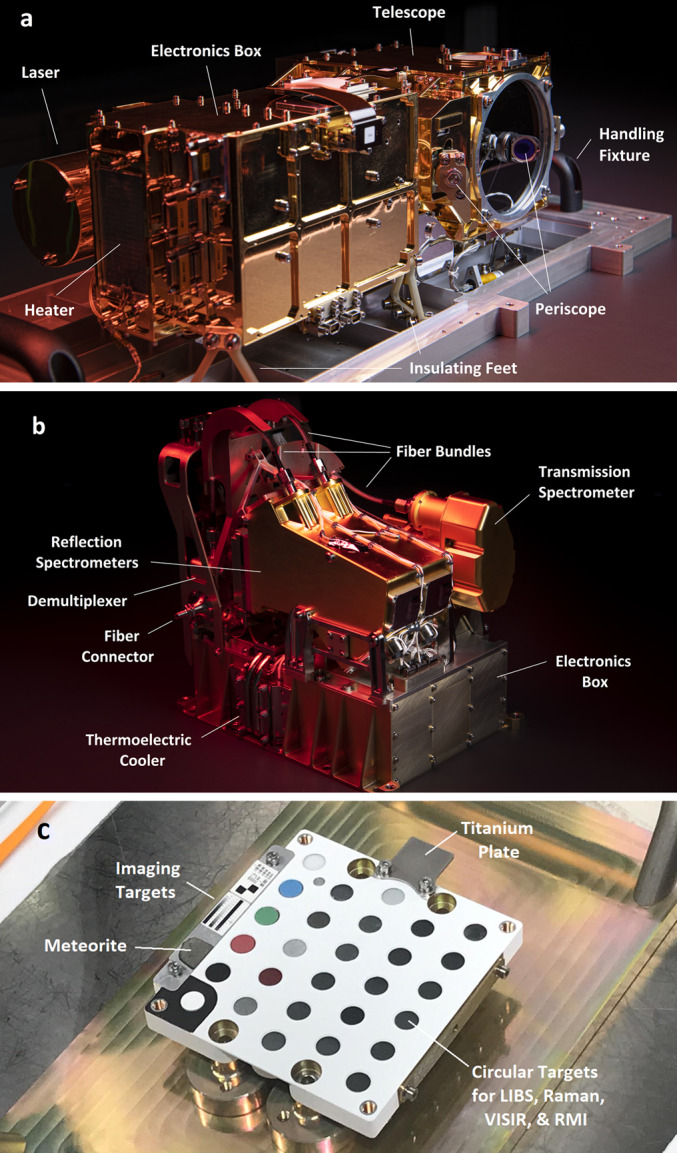
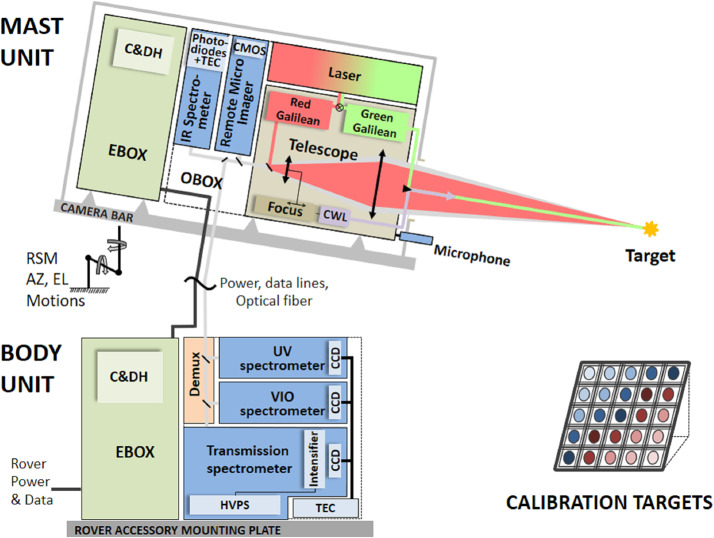
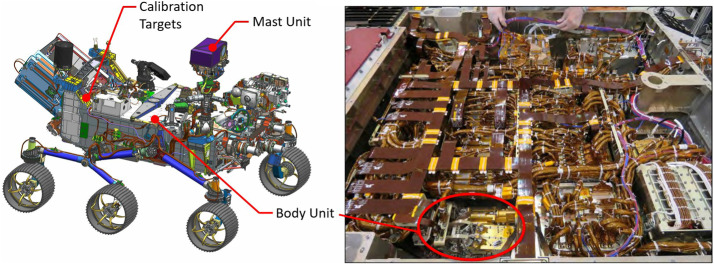
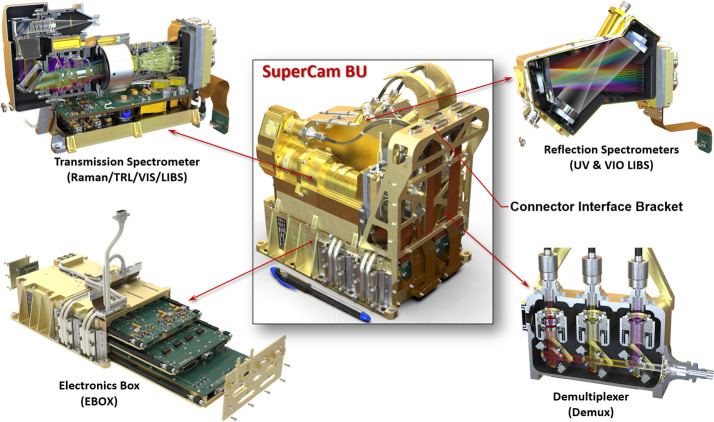
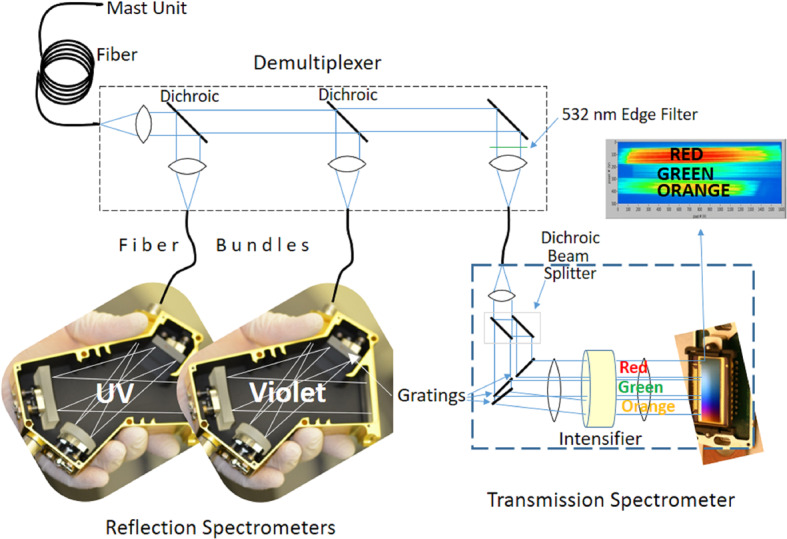
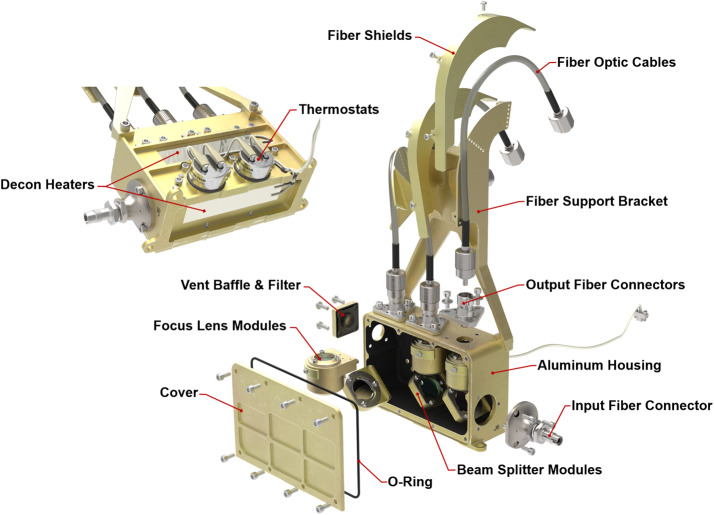
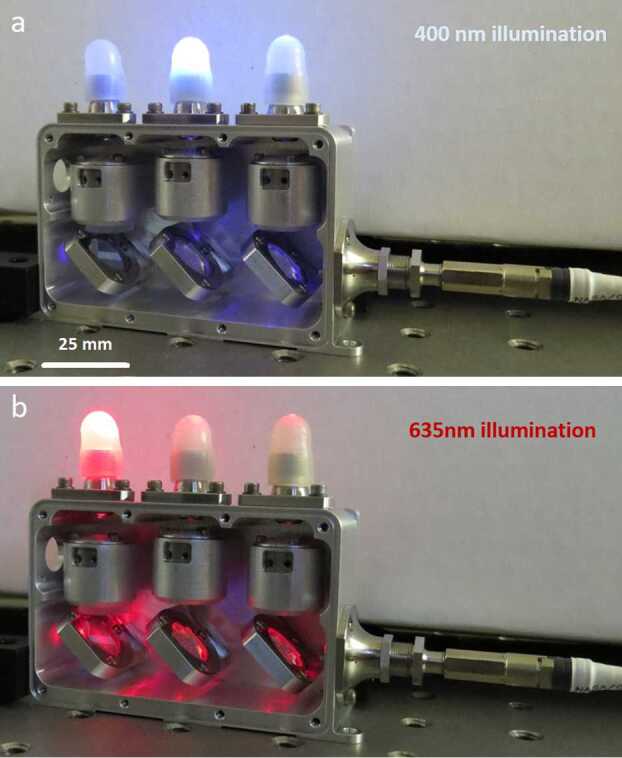
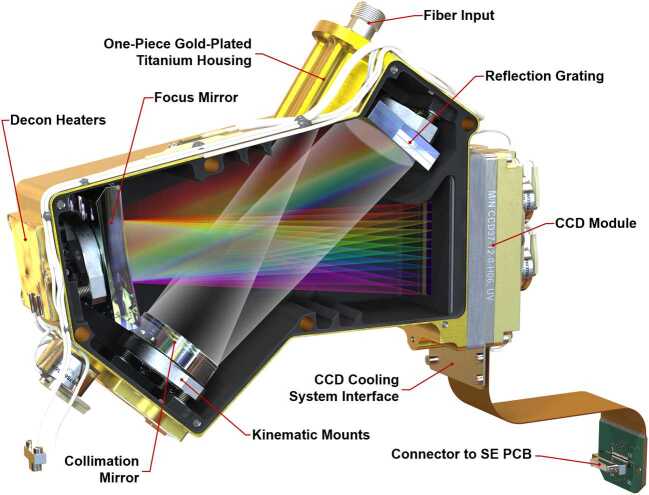
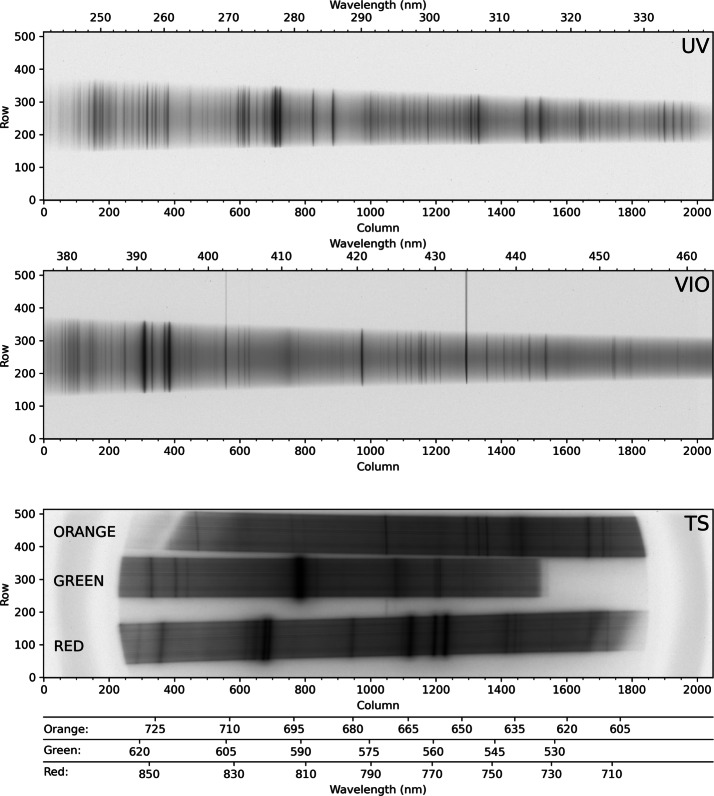
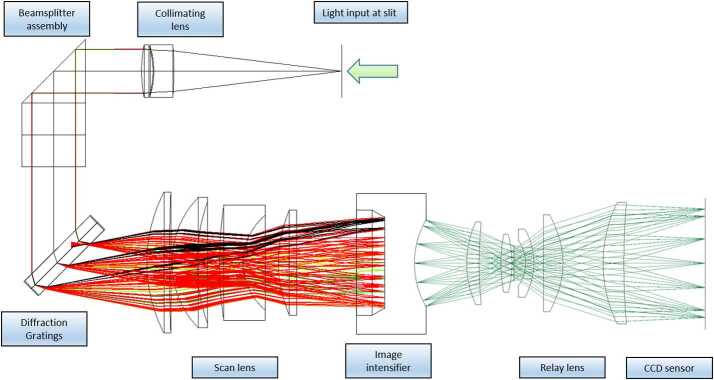
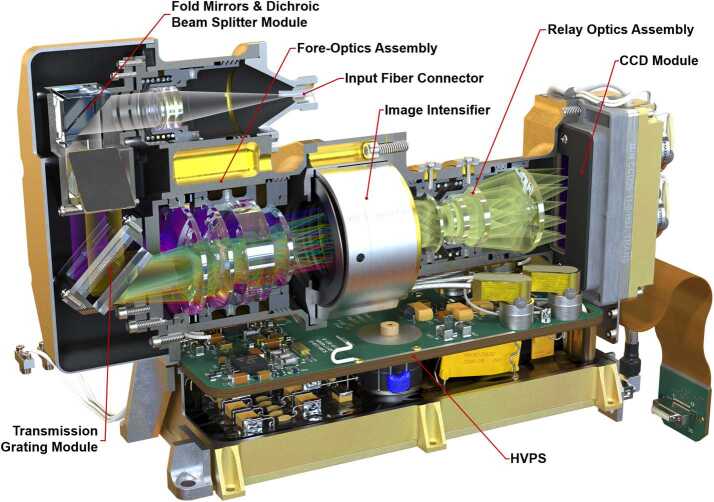
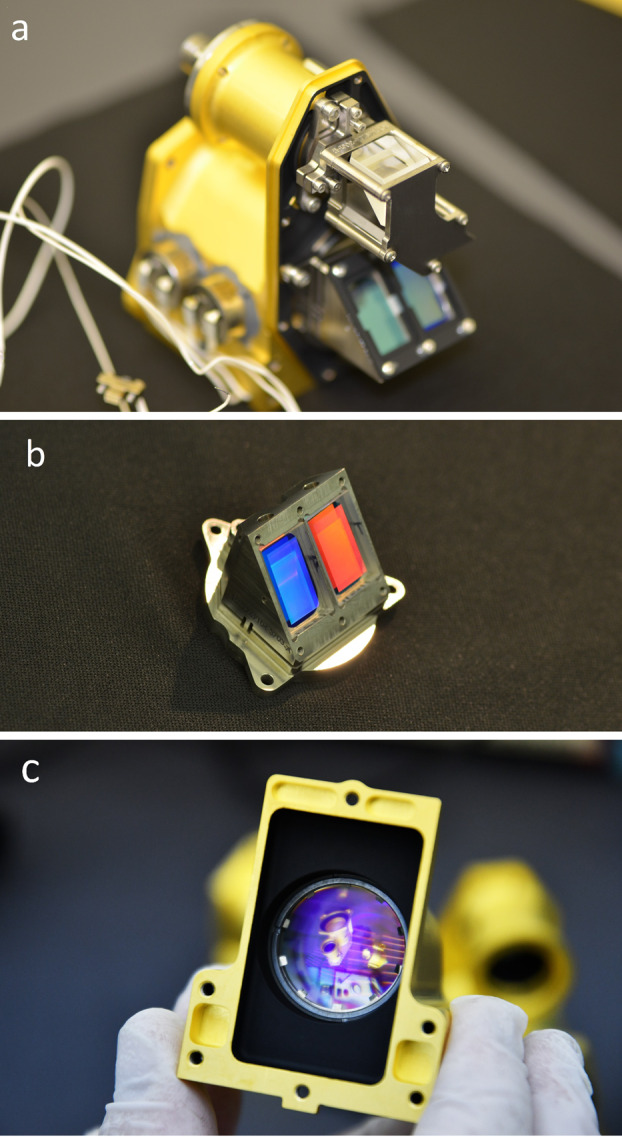
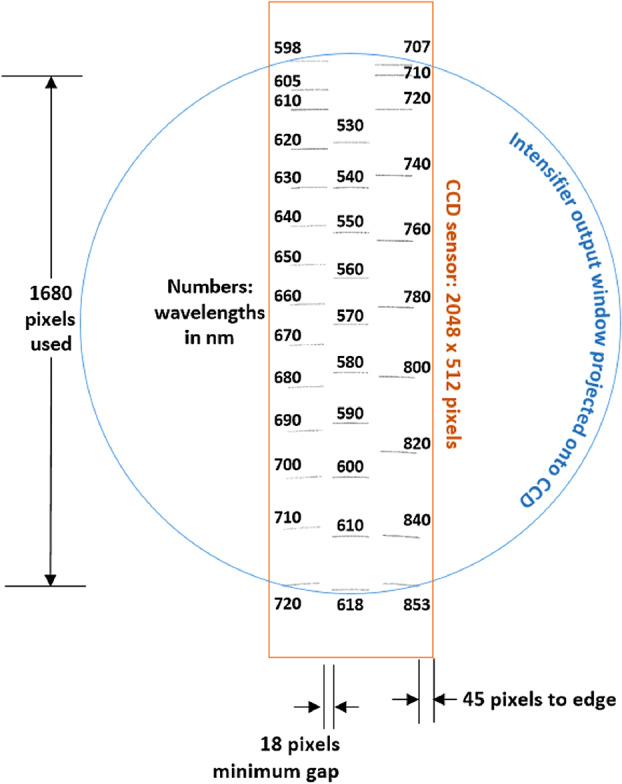
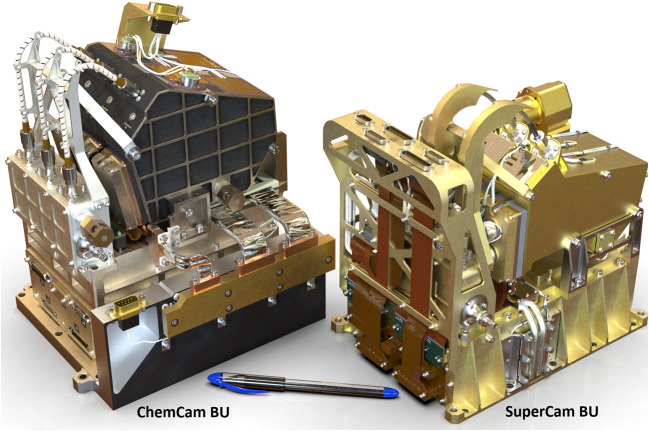
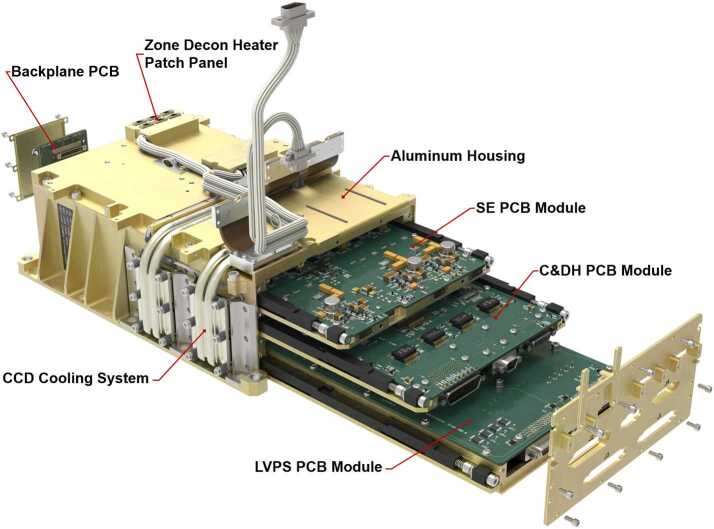
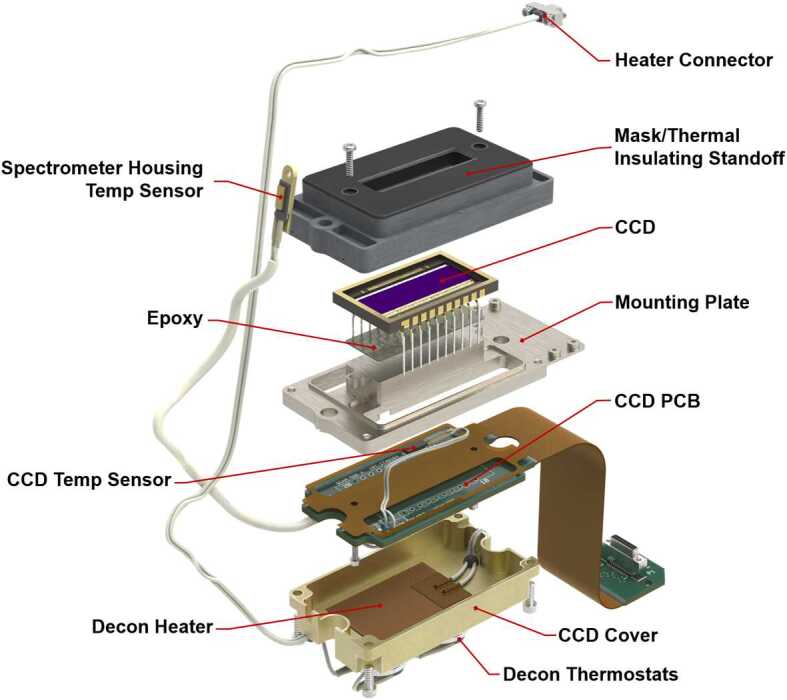
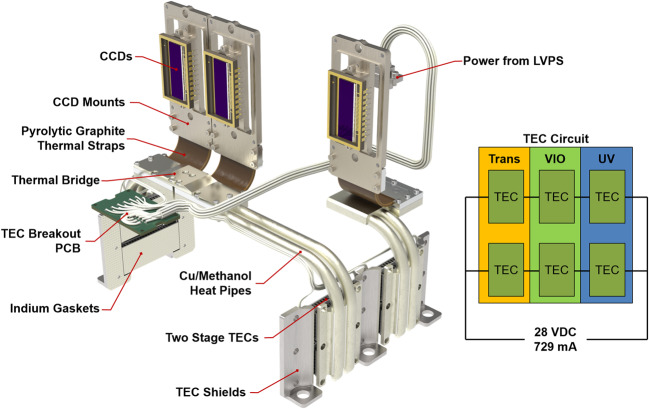
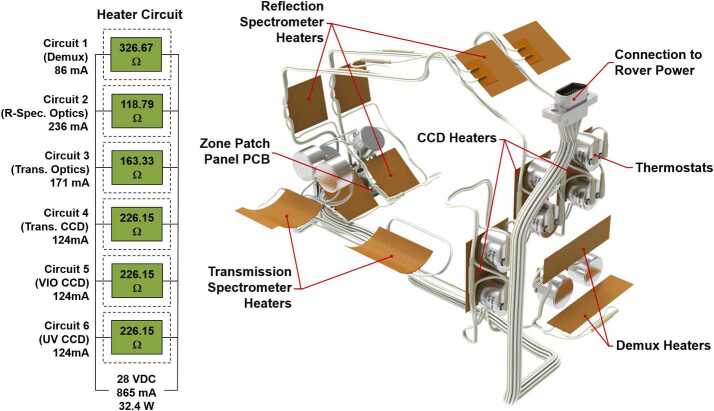
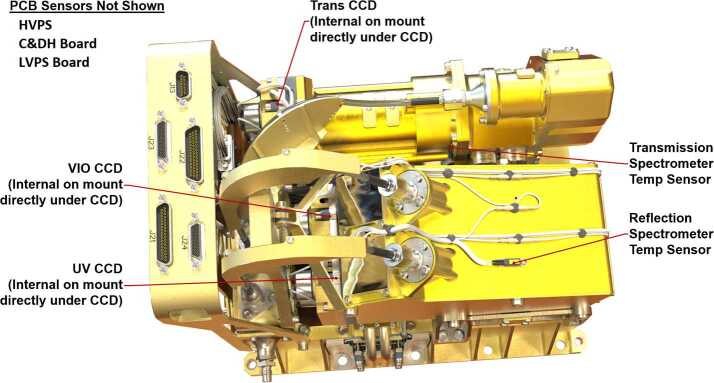
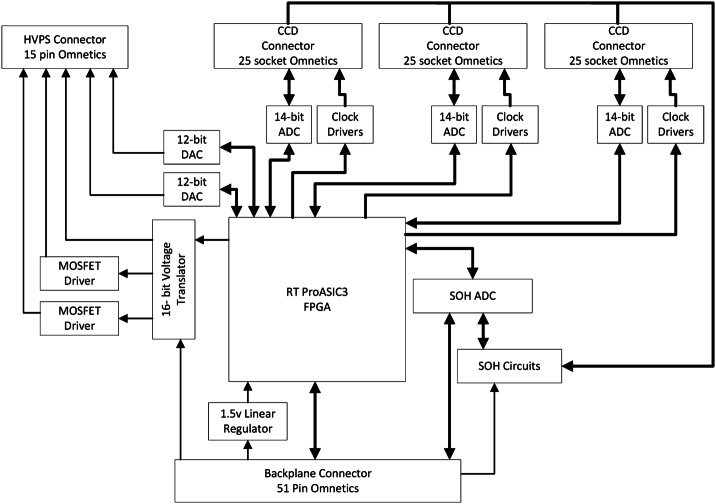
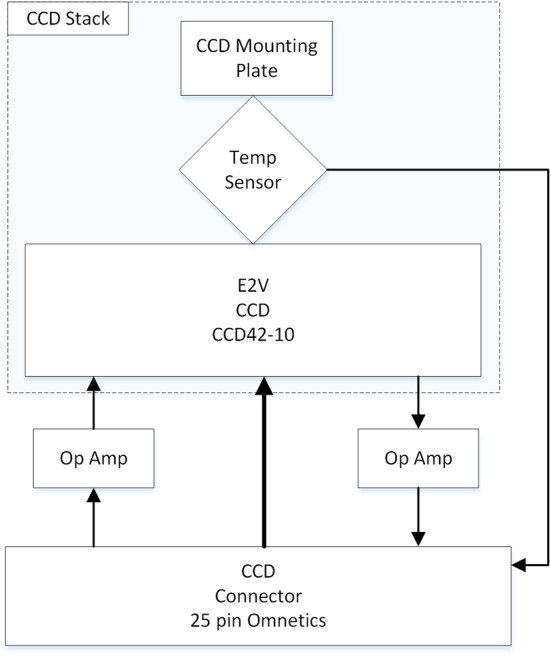
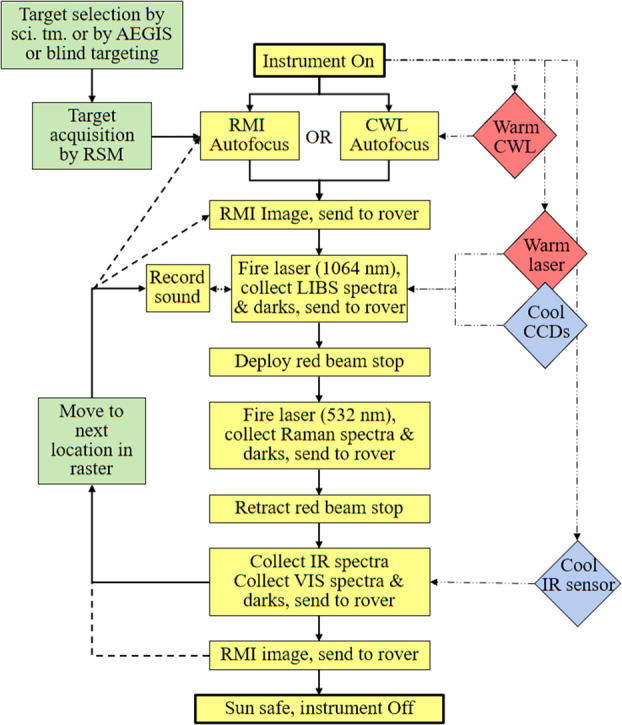
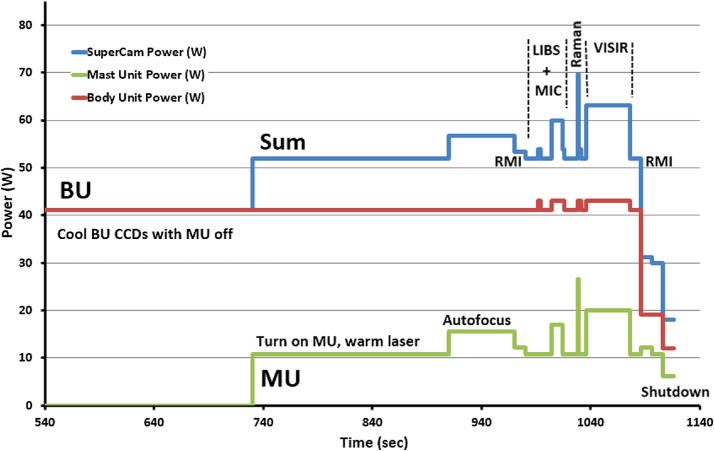
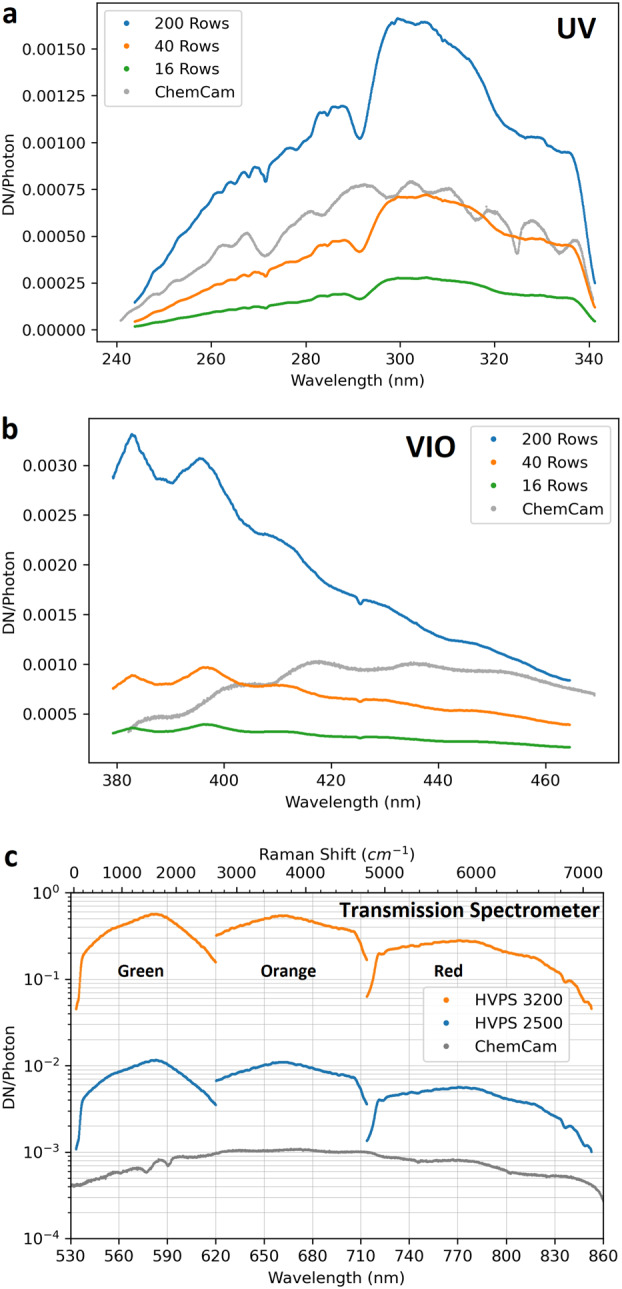
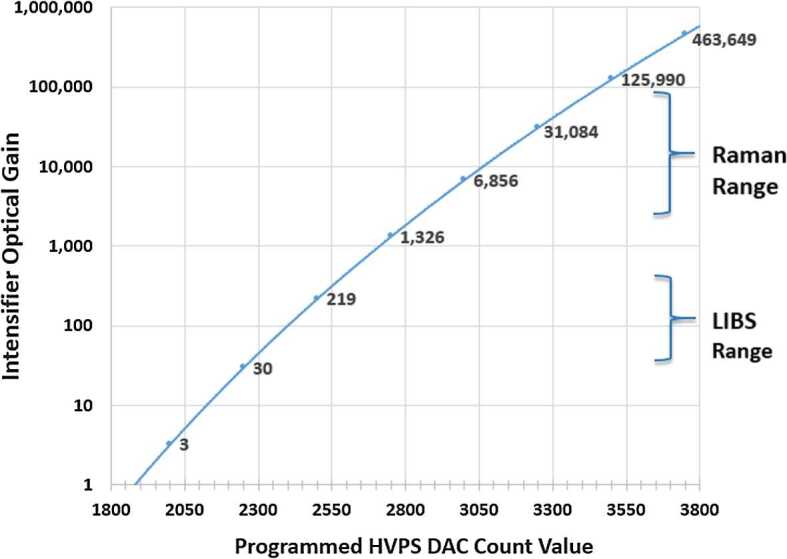
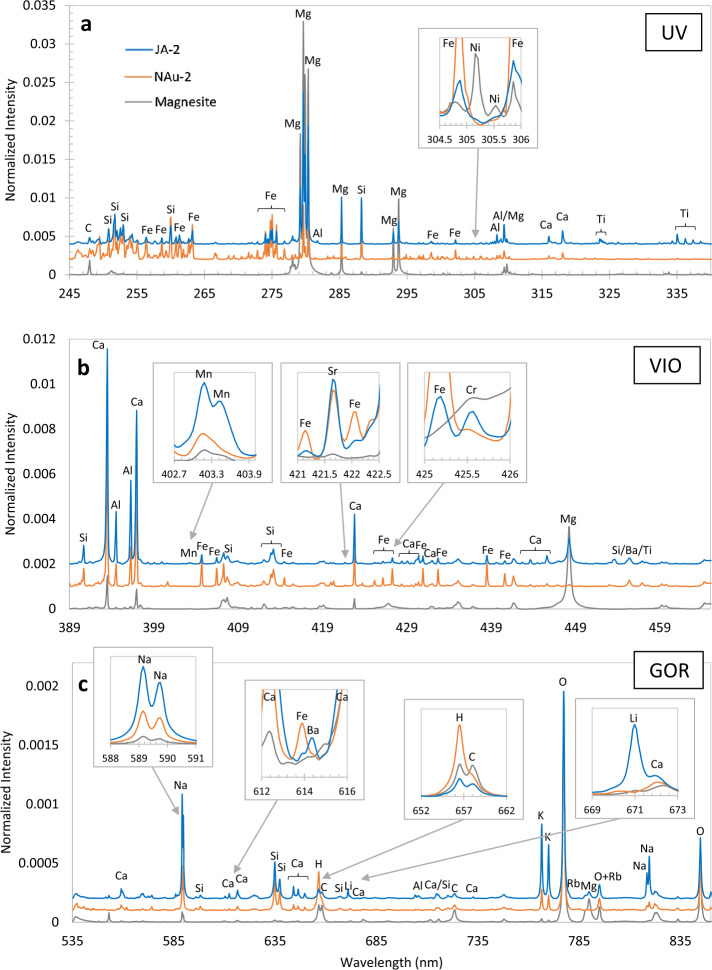
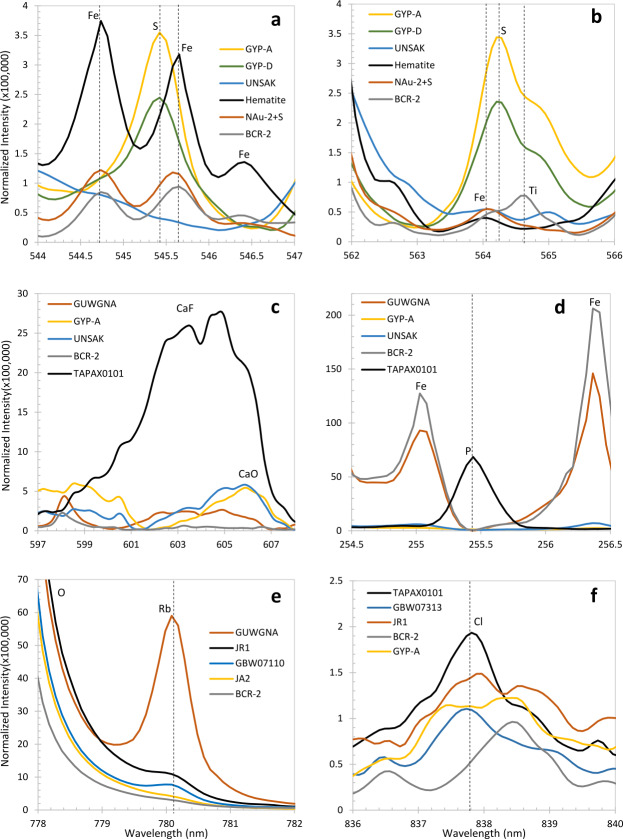
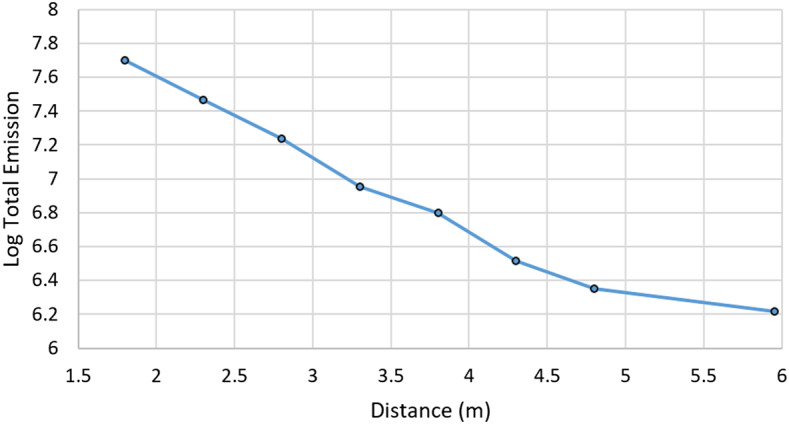
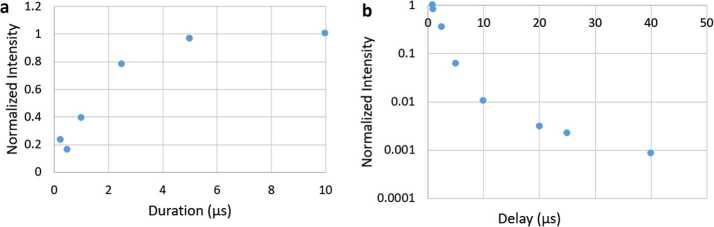
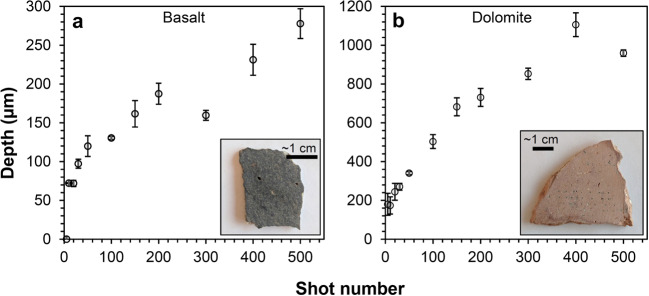
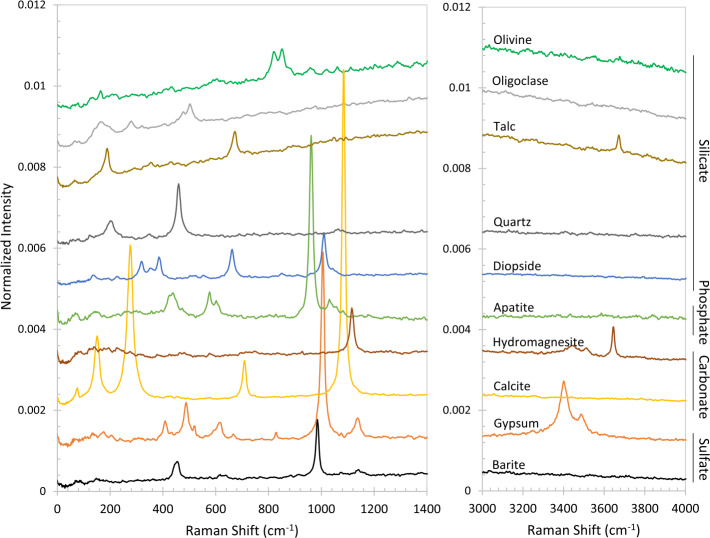
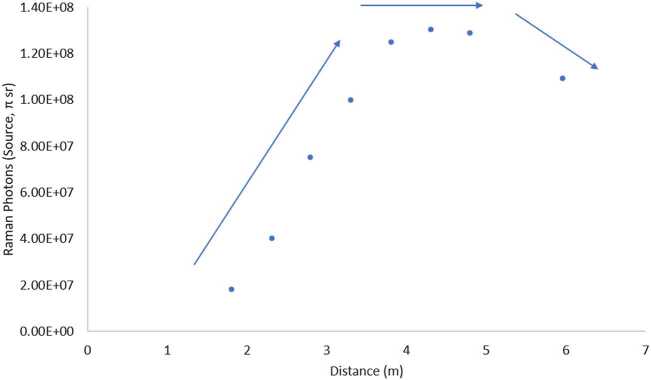
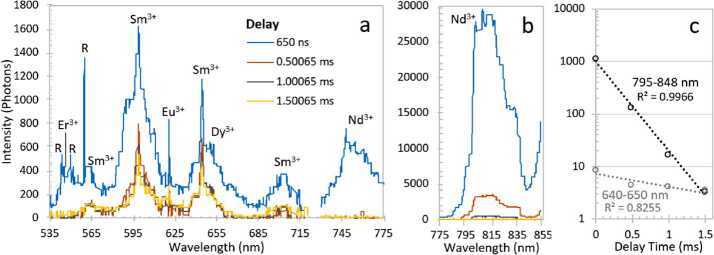
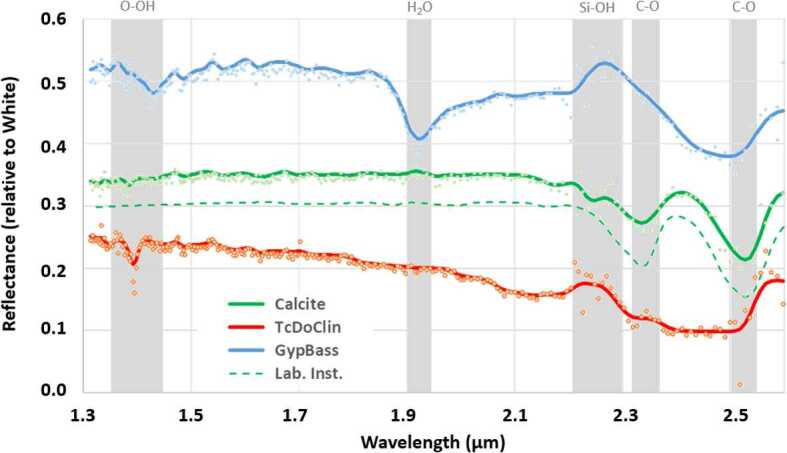
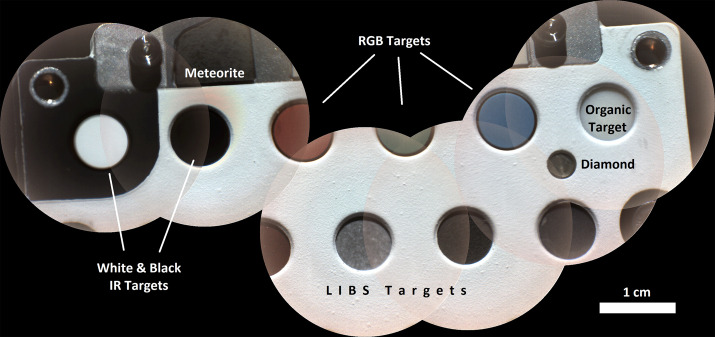
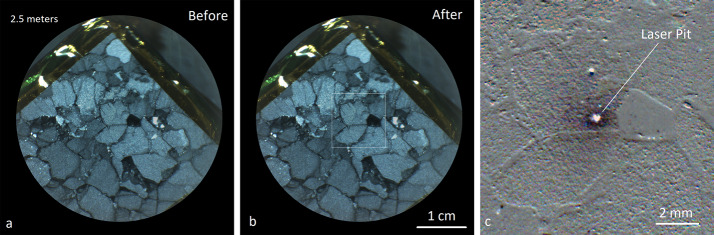
The SuperCam instrument suite provides the Mars 2020 rover, Perseverance, with a number of versatile remote-sensing techniques that can be used at long distance as well as within the robotic-arm workspace. These include laser-induced breakdown spectroscopy (LIBS), remote time-resolved Raman and luminescence spectroscopies, and visible and infrared (VISIR; separately referred to as VIS and IR) reflectance spectroscopy. A remote micro-imager (RMI) provides high-resolution color context imaging, and a microphone can be used as a stand-alone tool for environmental studies or to determine physical properties of rocks and soils from shock waves of laser-produced plasmas. SuperCam is built in three parts: The mast unit (MU), consisting of the laser, telescope, RMI, IR spectrometer, and associated electronics, is described in a companion paper. The on-board calibration targets are described in another companion paper. Here we describe SuperCam's body unit (BU) and testing of the integrated instrument. The BU, mounted inside the rover body, receives light from the MU via a 5.8 m optical fiber. The light is split into three wavelength bands by a demultiplexer, and is routed via fiber bundles to three optical spectrometers, two of which (UV and violet; 245-340 and 385-465 nm) are crossed Czerny-Turner reflection spectrometers, nearly identical to their counterparts on ChemCam. The third is a high-efficiency transmission spectrometer containing an optical intensifier capable of gating exposures to 100 ns or longer, with variable delay times relative to the laser pulse. This spectrometer covers 535-853 nm ( 105 - 7070 cm - 1 Raman shift relative to the 532 nm green laser beam) with 12 cm - 1 full-width at half-maximum peak resolution in the Raman fingerprint region. The BU electronics boards interface with the rover and control the instrument, returning data to the rover. Thermal systems maintain a warm temperature during cruise to Mars to avoid contamination on the optics, and cool the detectors during operations on Mars. Results obtained with the integrated instrument demonstrate its capabilities for LIBS, for which a library of 332 standards was developed. Examples of Raman and VISIR spectroscopy are shown, demonstrating clear mineral identification with both techniques. Luminescence spectra demonstrate the utility of having both spectral and temporal dimensions. Finally, RMI and microphone tests on the rover demonstrate the capabilities of these subsystems as well.

Keywords: Infrared spectroscopy; Jezero crater; LIBS; Mars; Microphone on Mars; Perseverance rover; Raman spectroscopy; SuperCam.


Conflict of interest statement

Conflicts of interest/Competing interestsThe authors declare that there are no conflicts of interest or competing interests.

Figures

Fig. 1
Fig. 1
The SuperCam instrument, consisting of the Mast Unit (MU), shown in (a), the Body Unit (BU), shown in (b), and the SuperCam Calibration Target (SCCT), shown in (c). As part of the MU (a), the laser can be seen to the left, protruding from behind the electronics box. The telescope is at the far end, at the center of which the periscope mirror for the green laser beam is mounted. The corresponding periscope mirror can be seen just past the electronics box, facing away from the camera. At the near end of the electronics box, a heating pad is just to the left of the connectors. The Mast Unit is mounted on insulating feet, and is shown here resting on a handling fixture. The BU (b) shows a transmission spectrometer resting behind two identical reflection spectrometers, all mounted on top of the electronics box. Three optical fiber bundles can be seen with their protective shields near the upper left; these transfer light to the spectrometers from the demultiplexer. The only part of the demultiplexer that is visible is the fiber connector, protruding at the left center. This is where the light from the MU enters the BU. One of three sets of thermoelectric coolers is seen in the lower center, identified by two visible heat pipes that run under the spectrometers to cool their detectors. On the SCCT (c), twenty-nine circular targets and several other calibration targets are mounted. The titanium plate at the upper right is used for wavelength calibration via LIBS spectra. Imaging targets and a Mars meteorite sample line the left side. Dimensions of all three SuperCam units are given in Table 2
Fig. 2
Fig. 2
Schematic diagram showing the major units and subcomponents of the SuperCam instrument suite. The Mast Unit (MU) consists of the main laser which provides two wavelengths using two Galilean beam expanders, the telescope, a continuous-wave laser (CWL) for focusing, and a microphone. The optical box (OBOX) also includes the infrared (IR) spectrometer and the Remote Micro-Imager (RMI), the detector of which is a complementary metal oxide semiconductor (CMOS). An electronics box (EBOX) controls and powers the various subsystems in the MU. Acquisition of the target is provided by the rover mast azimuthal (AZ) and elevation (EL) motions. Electrical cables and an optical fiber connect the Body Unit (BU) to the MU. The fiber carries light in the 245–853 nm range to the demultiplexer (labeled Demux) in the BU, which distributes the light to three spectrometers covering ultraviolet (UV), violet (VIO), green, orange, and red spectral ranges. The latter are characterized by a transmission spectrometer, which uses an intensifier driven by a high-voltage power supply (HVPS). All three BU spectrometers collect light with charge-coupled devices (CCDs) cooled by thermoelectric coolers (TECs). The electronics box (EBOX) in the BU operates the instrument, provides power to the BU spectrometers and the MU, and communicates with the rover through the control and data handling (C&DH) board. A set of calibration targets is mounted on the back of the rover to facilitate calibration while on Mars
Fig. 3
Fig. 3
Locations of the SuperCam units on the rover. The right side shows the rover body inverted, with the Body Unit circled. It is next to the RSM side of the rover to minimize the length of the fiber that transfers the optical signal from the mast unit. The rover’s instrument and electronics bay is 1181×1106mm (length, left-right, x width)
Fig. 4
Fig. 4
Subassemblies of the Body Unit
Fig. 5
Fig. 5
Schematic diagram of the optical layout of the SuperCam BU. The Fiber Optic Cable (FOC) transfers light from the MU to the demultiplexer, which uses two dichroic mirrors to split the light into three bands. An edge filter removes green laser light from the Raman signal. Fiber bundles transmit the light from the demultiplexer to the spectrometers. The ultraviolet (UV) and violet bands are dispersed and recorded by crossed Czerny-Turner reflection spectrometers of identical design but with their own mirrors and gratings. They are shown prior to CCD installation. The transmission spectrometer separates a red band using a dichroic beam splitter, and it separates green and orange bands using a compound grating. All three bands are focused onto the intensifier. Beyond the intensifier, a set of relay lenses re-focuses the light onto the CCD, which collects all three bands of light. For illustration purposes, the bands are shown orthogonal to the way in which they are actually projected onto the intensifier and CCD; the correct orientation is illustrated above, indicated by the blue arrow
Fig. 6
Fig. 6
Attenuation and insertion loss for the flight fiber-optic cable, measured with two commercial spectrometers (orange and blue curves), made after planetary protection/contamination control bake-out and flight-acceptance thermal cycling. Red and black lines indicate goal and requirement levels, respectively
Fig. 7
Fig. 7
Rendering of the optical demultiplexer which accepts light from the FOC (at the connector at the right) and distributes it efficiently to the three spectrometers through three fiber bundles
Fig. 8
Fig. 8
Demultiplexer illuminated with 400 (a) and 635 (b) nm light, showing the separation of wavelength bands for the VIO (a) and transmission (b) spectrometers. UV illumination of the third band on the right side is invisible to the human eye, so it is not shown. An approximate scale is indicated in (a). The table holes are centered 25.4 mm apart
Fig. 9
Fig. 9
Typical inspection images of demultiplexer end (a) and spectrometer end (b) of fiber bundles, showing the one feeding the transmission spectrometer. The core of each fiber is 50 μm diameter. Fibers are backlit for the inspections. The relative intensity of each fiber may be a function of the position of the lamp, and so does not indicate relative throughput in this case. Inset shows a magnified image of the linear array of fibers at the spectrometer end before (c) and after (d) bonding a 28.7 μm slit. Inset (e) shows the mapping of fibers in the array, with central fibers in the circle mapped to central fibers in the line
Fig. 10
Fig. 10
Comparison of optical throughput efficiency (a) and spectral resolution (b) as functions of entrance slit width for transmission spectrometer. The theoretical maximum optical transmission is shown as a dotted line in (a). As expected, a wider slit allows more light but also increases the FWHM of spectral features. The 28.7 micron slit was selected for flight. Although not shown in the figure (the lowest-wavelength Ne line used was at 576 nm), this slit just meets the 12cm1 resolution requirement at the short-wavenumber end of the spectrum
Fig. 11
Fig. 11
Rendering of a SuperCam reflection spectrometer. Light enters from the fiber bundle and slit assembly at the upper right. It is collimated by the circular mirror at lower left. The grating at upper right provides spectral dispersion, the first order of which is focused by the rectangular mirror at the upper left onto the detector assembly at the lower right. Baffles can be seen along the upper and lower sides and next to the grating, used to absorb higher order reflections from the grating. The cylinder protruding at the left is a thermal switch
Fig. 12
Fig. 12
LIBS light from andesite standard JA-3 (shot in terrestrial atmosphere) as seen by SuperCam’s detectors. Shown are full images of the CCDs of UV, violet (VIO), and transmission (TS) spectrometers. These images are shaded as the natural logarithm of intensity. Rows and columns are indicated, as are the wavelengths. Two lines extending to the top of the VIO image are Hg emission lines from room lights. In the transmission spectrometer, the edge of the intensifier can be perceived by the edges of the continuum emission
Fig. 13
Fig. 13
Ray traces in a model of the transmission spectrometer, showing collimation, diffraction, and formation of slit images on the image intensifier entrance window and relay lens carrying intensified image to CCD sensor. Rays are colored by wavelength; 534 nm to 853 nm to the intensifier, and 545 nm from the intensifier phosphor to the CCD
Fig. 14
Fig. 14
Cutaway rendering of the transmission spectrometer showing the internal layout
Fig. 15
Fig. 15
Subsections of the transmission spectrometer. The spectrometer section (a) is shown with the fiber connector facing to the rear. The dichroic beam splitter is in focus. The grating assembly (b) is shown with the input side visible, and relay lens is seen in its housing (c), looking from the CCD side. Other components on the table are visible through the relay lens
Fig. 16
Fig. 16
Map of spectrometer slit images at various wavelengths (in nm) with the field of view of the intensifier (circle) drawn for scale. The green band (middle, 530–618 nm) starts part-way in from the CCD’s edge in order to optimize the resolution. The orange band (598–720 nm) is projected to the left, and the red band (707–853 nm) to the right. The CCD is read-out from the right side in this orientation. Compare with the bottom panel of Fig. 12
Fig. 17
Fig. 17
Side-by-side rendering of ChemCam and SuperCam Body Units. SuperCam’s BU is 345 g lighter and occupies a slightly smaller volume
Fig. 18
Fig. 18
An exploded view showing the major components of the electronics box (EBOX). Its backplane/daughter-card architecture allows easier removal and installation of circuit boards during assembly and testing. The EBOX acts as the support structure for the optical sub-assemblies
Fig. 19
Fig. 19
Exploded view showing the assembly of the CCD module. The basic design is common to all three spectrometers. The VIO CCD does not have a temperature sensor for its spectrometer housing
Fig. 20
Fig. 20
The system for cooling the CCDs shown in isolation along with the wiring schematic. The TEC shields provide both protection to the TECs during rover integration and improve the thermal path to the mounting fasteners
Fig. 21
Fig. 21
Decontamination heater system shown in isolation along with the wiring schematic. The system is composed of six independent zones, each controlled by a pair of redundant thermostats and operating on rover power
Fig. 22
Fig. 22
Locations of all the SOH temperature sensors on the SuperCam BU. Locations were chosen to provide the best temperatures for calibration. Trans = transmission spectrometer
Fig. 23
Fig. 23
Schematic diagram of the BU low-voltage power supply. RTN = return; EMI = electromagnetic interference; Cap = capacitor; LC = inductance-capacitance
Fig. 24
Fig. 24
Schematic diagram for the BU C&DH board. See main text for definitions of abbreviations
Fig. 25
Fig. 25
Schematic diagram for the BU spectrometer electronics board. ADC = analog-to-digital converter; DAC = digital-to-analog converter; Op Amp = operational amplifier; MOSFET = metal-oxide semiconductor, field-effect transistor. See main text for the meaning of other abbreviations
Fig. 26
Fig. 26
Oscilloscope traces illustrating the correlated quadruple sampling used to improve the signal-to-noise ratio. ORST is output reset pulse; R3 is readout register phase-3 clock pulse
Fig. 27
Fig. 27
CCD board schematic diagram. Op Amp = operational amplifier; Temp = temperature. See main text for other abbreviations
Fig. 28
Fig. 28
Simplified schematic diagram of the high-voltage power supply that operates the intensifier depicted in Fig. 14. MCP = micro-channel plate
Fig. 29
Fig. 29
Description of testing the duration of the intensifier gate by generating a Raman signal on a target multiple times with different delays for each collect. The technique is illustrated schematically in (a). The result is shown in (b) for a 100 ns gate. Each point represents data collection at the delay given on the x-axis. The y-axis represents the Raman signal peak intensity for a given delay setting. The rising portion of the curve on the left of the plot (b) comes from signals received at the end of the integration period (a, top); the falling portion on the right in (b), at longer delays, represents signals received at the beginning of the integration period, as shown at the bottom of (a)
Fig. 30
Fig. 30
Operating states of the SuperCam BU as commanded by the rover. POR = power-on reset, which is first achieved by providing power to the instrument
Fig. 31
Fig. 31
Illustration of the nested nature of the commands that operate SuperCam, spanning from instrument-level commands (I-cmds) to spacecraft-level commands (S-cmds) up to components, which operate more than one instrument
Fig. 32
Fig. 32
Flow diagram for typical SuperCam operations. This illustration includes all of the spectral techniques, though it is not necessary to use all techniques on a given observation, nor to use the order of taking spectra shown here. See text for description
Fig. 33
Fig. 33
Power profile for one observation point, starting with a power-on and warm-up sequence. Note that the y-axis starts at 540 seconds; in this example the first 12 minutes is used exclusively for BU TEC cooling. After that the laser is warmed, followed by autofocus, an RMI image, and spectral collects for LIBS (30 shots at 3 Hz), Raman (10 shots at 10 Hz), and VISIR spectroscopies prior to a final RMI image and shut-down. Total duration is 18 minutes, 36 seconds; total energy is 13.8 W-hr with a maximum power of 69.7 W, and total data volume is 26.5 Mbytes, dominated by the two RMI images
Fig. 34
Fig. 34
Image of a SuperCam BU CCD illustrating the sequence of events that take place in collecting a spectrum. The spectrum is shown in the center of the CCD. The region from which the light is collected lies in the rows between the two horizontal lines. The serial register that integrates the charge from each column is represented by the yellow row at the bottom. The serial register is read out sequentially to the right
Fig. 35
Fig. 35
Illustration of the timing sequence of the ICCD in the transmission spectrometer for collecting Raman emission (a). The intensifier gate closes at 100 ns. The phosphor emission from the intensifier continues for several milliseconds, so the CCD does not transfer its signal until 5 ms after the gate closes. The TRL data collection scheme is also shown (b). In this case, data are collected at up to five different delay times to determine the time dependence of the luminescence. Each exposure at a different delay requires a separate laser burst and collection by the CCD
Fig. 36
Fig. 36
Preliminary instrument optical response functions for the SuperCam BU UV (a), VIO, (b), and transmission (c) spectrometers. The units are digital numbers (DN) per photon incident at the telescope aperture. Data were taken with the instrument mounted in the rover. For the reflection (UV, VIO) spectrometers, read-out of fewer CCD rows results in a lower optical response that can be used to avoid saturation for nearby targets. For the transmission spectrometer (c), a large range in response is needed to accommodate both bright LIBS signals and weak Raman signals. A log scale is used to present the gain settings planned for LIBS (2500) and Raman spectroscopy (3200). The response curves of the transmission spectrometer clearly show the three different (green, orange, red) optical windows, with dips in response at the transition regions. The exact position of the transition was selected to avoid any important LIBS emission peaks. ChemCam’s instrument response (Wiens et al. 2012) is shown for comparison. ChemCam is limited to 14-bit numbers, in contrast to SuperCam’s 16 bits
Fig. 37
Fig. 37
Gain produced across the SuperCam intensifier as a function of the digital-to-analog count value (0–4095). The typical DAC setting for LIBS is 2500; Raman spectroscopy uses a DAC setting of 3200, but these can be adjusted, depending on conditions, e.g., decreased to avoid saturation or increased to highlight a weak feature
Fig. 38
Fig. 38
Resolution, indicated as FWHM in nm, at various wavelengths. Atomic emission lamps were used as sources. The observations were made with the SuperCam BU in a thermal chamber at Mars pressure. SuperCam’s reflection spectrometers meet their requirements of 0.2 nm FWHM across the entire temperature range. The Raman fingerprint region, indicated by the green curves at 546 and 579 nm, indicates a resolution in wavenumbers of 11.7 and 10.5cm1, respectively, meeting the requirement of 12cm1. The red region, indicated by the two red curves, used an integration over 70 rows, trading some signal for better resolution. ChemCam’s resolution is shown for comparison for VIO and visible and near infrared (VNIR) ranges, measured at 405 and 764 nm, respectively. ChemCam’s UV resolution (not shown) is similar to its VIO resolution
Fig. 39
Fig. 39
Shift of the position of the incident light on the CCDs as a function of temperature. Construction with titanium instead of beryllium (ChemCam) resulted in a large improvement in thermal stability
Fig. 40
Fig. 40
Examples of LIBS spectra taken with the FM BU and EQM MU at LANL. Spectra are normalized to the total emission. Examples were selected to be representative of the expected diversity of materials at Jezero crater. They include an igneous rock (blue, JA-2, andesite from Japan), a smectite clay (orange, NAu-2, nontronite from Australia), and an Mg-rich carbonate (gray, Ni-rich magnesite from Australia). (a) UV spectral range with an inset highlighting Ni detections in magnesite. (b) VIO spectral range with insets illustrating the detections of Mn, Sr, and Cr. (c) transmission spectrometer range (GOR = green, orange, red) with insets showing the Na doublet, Ba, H and C, and Li. This spectral range has improved resolution over ChemCam in the shorter wavelengths as illustrated by the separation of the peaks in the Na doublet, not seen in ChemCam spectra
Fig. 41
Fig. 41
LIBS spectra highlighting various spectral features of interest. The S II 545.5 nm (a) and S II 564.2 nm (b) peaks are present in gypsum standards GYP-A (46.2 wt.% SO3) and GYP-D (36.70 wt.% SO3). Fe peaks are also present in this region as demonstrated by an oolitic hematite (74.96 wt.% total iron as FeO), a sulfur doped Fe-rich nontronite clay (NAu2 plus added sulfur, 15.76 FeOT and 21.07 SO3), and a basalt (BCR-2, 12.42 wt.% FeOT and 0.04 wt.% SO3). Note the NAu2+S spectrum has an unresolved peak between S and Fe with the skew to the left indicating the presence of sulfur, as opposed to the peak in BCR-2, which is not skewed. UNSAK (aragonite) has very low FeOT and SO3, 0.11 and 0.12 wt.%, respectively. (c) CaF molecular features (appearing as a very broad peak) are present in apatite standard TAPAX0101 and slightly in GUWGNA (granite with 33,200 ppm F and 0.64 wt.% CaO). CaO molecular features are present in gypsum (GYP-A) and aragonite (UNSAK). No features are present in the basalt (BCR-2). (d) A P peak is present in the apatite (TAPAX0101) but not in the other shown spectra, which have low to no P. (e) Rb peak on the upper side of a major O peak. The spectra are arranged in descending order of Rb concentration: GUWGNA (Granite) = 2020 ppm, JR1 (rhyolite) = 257 ppm, GBW07110 = 183 ppm, JA2 = 71 ppm, BCR-2 = 47 ppm. (f) Cl peaks with the spectra arranged in descending order of Cl concentration: TAPAX0101 (apatite) = several wt.%, GBW07313 (marine sediment) = 40,700 ppm, JR-1 (rhyolite) = 920 ppm, BCR-2 = 98 ppm, and GYP-A = 12 ppm
Fig. 42
Fig. 42
Total emission from target JA-1 as a function of distance
Fig. 43
Fig. 43
Example of the ability of SuperCam to use time resolution to study LIBS processes. Shown are trends in the intensity of the CaF molecular peak measured at 603 nm as a function of the exposure duration up to 10 μs (a), and with up to 40 μs delay, on a log scale (b). In (a), all exposures start at a delay of 800 ns. In (b), all exposures have a duration of 10 μs
Fig. 44
Fig. 44
Measured pit depths as a function of the number of laser shots for basalt (a) and dolomite (b) made with the EQM laser at a distance of 2.86 m in a simulated Mars atmosphere. Error bars show the standard deviations of three pits at each number of shots. Insets show the samples. Rows of pits can be seen in the dolomite sample (b)
Fig. 45
Fig. 45
Profile of a laser pit made with 500 shots in dolomite, and a side view of a slice near the surface. (a) Profile of the laser pit. (b) Backscattered electron image of the same dolomite sample in thin section; the natural exterior of the rock is seen near the top of the image, with the outline of the LIBS pit from (a) in black (the pit was not made at this location, but the scale of features can be compared). The weathered surface of the terrestrial dolomite is a different composition than the interior rock, and LIBS depth profiles sample and differentiate between exterior and interior compositions. The LIBS pit is approximately cone shaped but shows some variation due to the properties of the beam
Fig. 46
Fig. 46
Raman spectra of pure minerals taken using the FM BU and EQM MU. Spectra are averages from 100 laser pulses taken with a delay of 650 ns, a gate width of 100 ns, and a gain of 3200. Laser energy was measured at 8mJ. The distance was 2.77 m. The talc is from an unknown locality while the apatite is from Durango, Mexico, the diopside from Tanzania, the oligoclase from Ontario, Canada, the gypsum from Durango, Mexico, the quartz from Minas Gerais, Brazil, the calcite from Mato Grosso do Sul, Brazil, the barite from Cumbria, UK, the hydromagnesite from Iran, and the olivine from San Carlos, AZ, USA. Spectra of the oligoclase, olivine, and talc have been multiplied by 4 to enlarge the peaks
Fig. 47
Fig. 47
SuperCam Raman spectra of pressed-powder pellets of different grain sizes of selenite gypsum (Glitter Mine, Utah), observed with the EQM at 2.25 m distance integrating 100 laser pulses. Wavenumbers are approximate. Insets show closer detail of the fingerprint (a) and water regions (b) of the spectrum
Fig. 48
Fig. 48
SuperCam Raman spectra of pressed-powder pellets of different grain sizes of epsomite, observed with the EQM at 2.25 m distance integrating 100 laser pulses. Wavenumbers are approximate. Insets show closer detail of the fingerprint (a) and water regions (b) of the spectrum
Fig. 49
Fig. 49
Number of photons generated at the target within the spectrometer field of view (FOV) as a function of distance, for the ν1 mode of gypsum powder using the EQM SuperCam instrument. The result is based on data taken at these distances and knowledge of the spectrometer FOV convolved with an independent determination of the Raman efficiency of the sample. For a given sample, the number of Raman photons produced within the FOV depends on the alignment of the laser beam and the spectrometer FOV, which can degrade beyond a certain distance. The number of photons collected and detected by the instrument is a convolution of this curve with the 1/r2 losses with distance, as presented in Table 12
Fig. 50
Fig. 50
Luminescence spectra of an apatite sample from Durango, Mexico, from 535–775 nm (c) and 775–850 nm (b); note the difference in intensity between these two regions. A small portion of the spectra around 720 nm have been removed due to excess noise where two spectral windows are joined. Each spectrum is the average of 50 laser shots with a gate width of 0.5 ms. Four time delays starting in the Raman window (650 ns delay) were taken with a 0.5 ms step size. Raman features (marked with an “R”) are present in the first time delay. The other features are attributed to rare-earth element luminescence. (c) shows lifetime curves based on the sum of the intensities in the regions between 640–650 nm (Sm3+) and 795–848 nm (Nd3+); the sums have been divided by 10,000 and plotted on a semi-log scale for clarity
Fig. 51
Fig. 51
Infrared spectra of several targets observed during the rover system thermal test (STT), referenced to the white standard on the rover calibration target assembly (Manrique et al. 2020). Intensities of individual channels are shown as data points, and shown as a smoothed curve. For the SCCT calcite target, spectra are shown from both SuperCam and from a laboratory instrument described in the text
Fig. 52
Fig. 52
RMI mosaic of part of the SuperCam Calibration Target (SCCT) assembly made from images taken at different times during STT. Some targets are identified. The image on the far right was taken in different lighting; the second from the left is slightly saturated in the red. “Meteorite” is a Mars meteorite sample; “RGB” are red, green, and blue targets (Manrique et al., this volume). Shadows below the fasteners in the upper part of the mosaic indicates the direction of the lighting. Shadows can also be seen below the upper edges of some of the calibration targets
Fig. 53
Fig. 53
RMI images taken during STT of a composite target (62% Ilmenite, 38% Hematite) at 2.6 m, using 19 ms integration time. (a) Before LIBS, 30 shots. (b) After LIBS. (c) Difference of the two images to highlight the laser pit. This level of detail is expected of most RMI images taken in the rover’s arm work zone and slightly beyond

References

    1. Acosta-Maeda T.E., Misra A.K., Porter J.N., Bates D.E., Sharma S.K. Appl. Spectrosc. 2017;71:1025–1038. doi: 10.1177/0003702816668531. - DOI - PubMed
    1. Arvidson R.E., Bellutta P., Calef F., Fraeman A.A., Garvin J., Gasnault O., Grant J., Grotzinger J.P., Hamilton V., Heverly M., Iagnemma K.A., Johnson J., Lanza N., Le Mouelic S., Mangold N., Ming D., Mehta M., Morris R.V., Newsom H., Renno N., Rubin D., Schieber J., Sletten R., Vasavada A.R., Vizcaino J., Wiens R.C. J. Geophys. Res., Planets. 2014;119:1322. doi: 10.1002/2013JE004605. - DOI
    1. Barbarand J., Pagel M. Am. Mineral. 2001;86:473.
    1. Bell J., III, Squyres S.W., Herkenhoff K.E., Maki J.N., Arneson H.M., Brown D., Collins S.A., Dingizian A., Elliott S.T., Hagerott E.C., Hayes A.G., Johnson M.J., Johnson J.R., Joseph J., Kinch K., Lemmon M.T., Morris R.V., Scherr L., Schwochert M., Shepard M.K., Smith G.H., Sohl-Dickstein J.N., Sullivan R.J., Sullivan W.T., Wadsworth M. J. Geophys. Res. 2003;108:8063. doi: 10.1029/2003JE002070. - DOI
    1. J. Bell et al. (2020, this journal). 10.1007/s11214-020-00755-x

LinkOut - more resources