

Detection of Coccolithophore Blooms With BioGeoChemical-Argo Floats
- PMID: 33380764
- PMCID: PMC7757229
- DOI: 10.1029/2020GL090559
Detection of Coccolithophore Blooms With BioGeoChemical-Argo Floats
Abstract
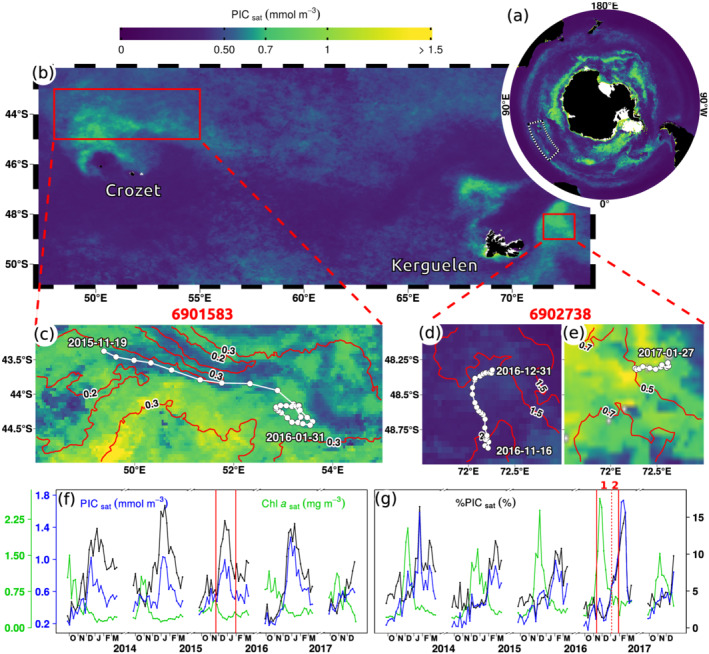
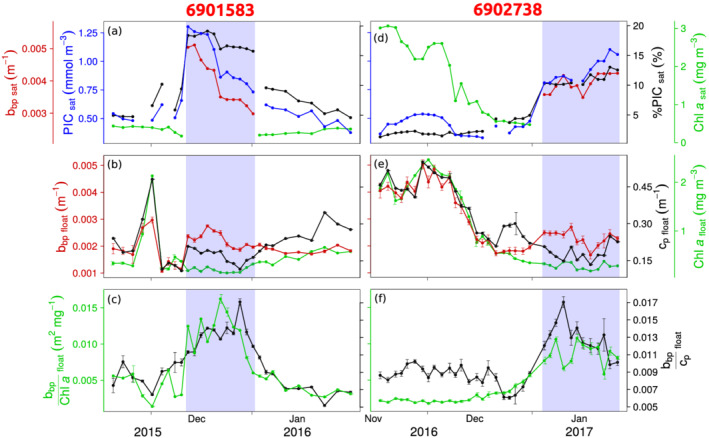
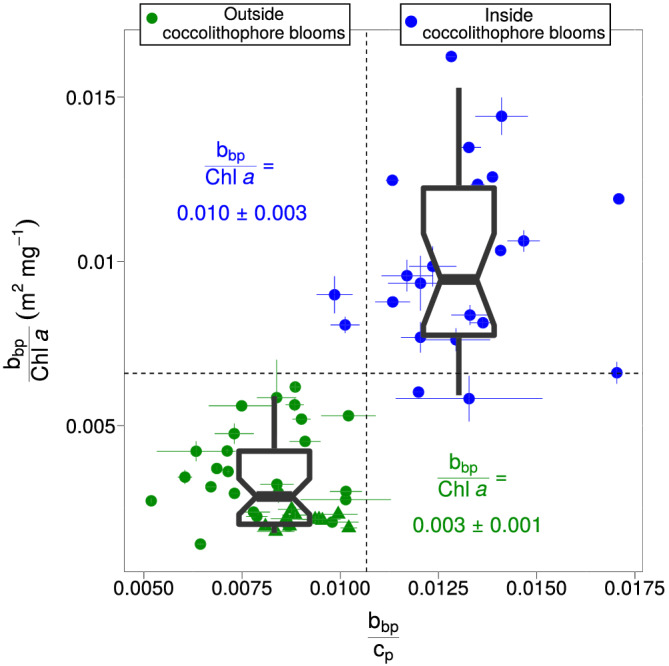
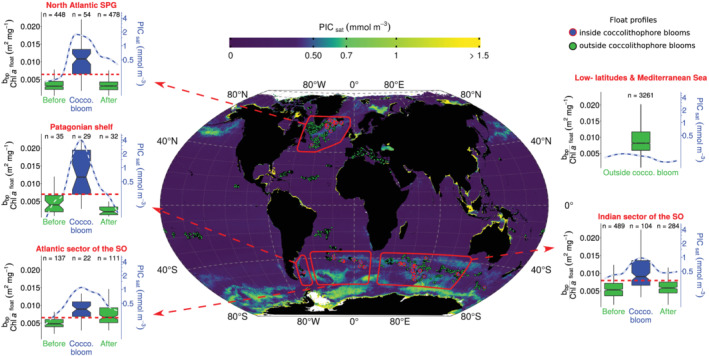
Coccolithophores (calcifying phytoplankton) form extensive blooms in temperate and subpolar oceans as evidenced from ocean-color satellites. This study examines the potential to detect coccolithophore blooms with BioGeoChemical-Argo (BGC-Argo) floats, autonomous ocean profilers equipped with bio-optical and physicochemical sensors. We first matched float data to ocean-color satellite data of calcite concentration to select floats that sampled coccolithophore blooms. We identified two floats in the Southern Ocean, which measured the particulate beam attenuation coefficient (c p) in addition to two core BGC-Argo variables, Chlorophyll-a concentration ([Chl-a]) and the particle backscattering coefficient (b bp). We show that coccolithophore blooms can be identified from floats by distinctively high values of (1) the b bp/c p ratio, a proxy for the refractive index of suspended particles, and (2) the b bp/[Chl-a] ratio, measurable by any BGC-Argo float. The latter thus paves the way to global investigations of environmental control of coccolithophore blooms and their role in carbon export.
Keywords: BGC‐Argo floats; Emiliania huxleyi; bio‐optics; bloom detection; coccolithophores; global ocean.
©2020. The Authors.
Conflict of interest statement
The authors declare no conflict of interest.
Figures
References
-
- Antoine, D. , & Morel, A. (1996). Oceanic primary production: 1. Adaptation of a spectral light‐photosynthesis model in view of application to satellite chlorophyll observations. Global Biogeochemical Cycles, 10(1), 43–55. 10.1029/95GB02831 - DOI
-
- Bailey, S. W. , & Werdell, P. J. (2006). A multi‐sensor approach for the on‐orbit validation of ocean color satellite data products. Remote Sensing of Environment, 102(1–2), 12–23. 10.1016/j.rse.2006.01.015 - DOI
-
- Balch, W. M. , Drapeau, D. T. , Bowler, B. C. , Lyczskowski, E. , Booth, E. S. , & Alley, D. (2011). The contribution of coccolithophores to the optical and inorganic carbon budgets during the Southern Ocean gas exchange experiment: New evidence in support of the “Great Calcite Belt” hypothesis. Journal of Geophysical Research, 116, C00F06 10.1029/2011JC006941 - DOI
-
- Balch, W. M. , Gordon, H. R. , Bowler, B. C. , Drapeau, D. T. , & Booth, E. S. (2005). Calcium carbonate measurements in the surface global ocean based on moderate‐resolution imaging spectroradiometer data. Journal of Geophysical Research, 110, C07001 10.1029/2004JC002560 - DOI
-
- Balch, W. M. , Bates, N. R. , Lam, P. J. , Twining, B. S. , Rosengard, S. Z. , Bowler, B. C. , Drapeau, D. T. , Garley, R. , Lubelczyk, L. C. , Mitchell, C. , & Rauschenberg, S. (2016). Factors regulating the Great Calcite Belt in the Southern Ocean and its biogeochemical significance. Global Biogeochemical Cycles, 30, 1124–1144. 10.1002/2016GB005414 - DOI
Grants and funding
LinkOut - more resources
Full Text Sources