

Cochlear Implant and Hearing Aid: Objective Measures of Binaural Benefit
- PMID: 33381008
- PMCID: PMC7768047
- DOI: 10.3389/fnins.2020.586119
Cochlear Implant and Hearing Aid: Objective Measures of Binaural Benefit
Abstract
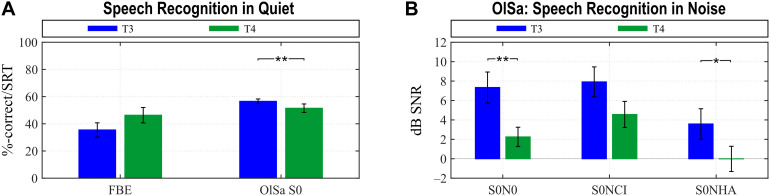
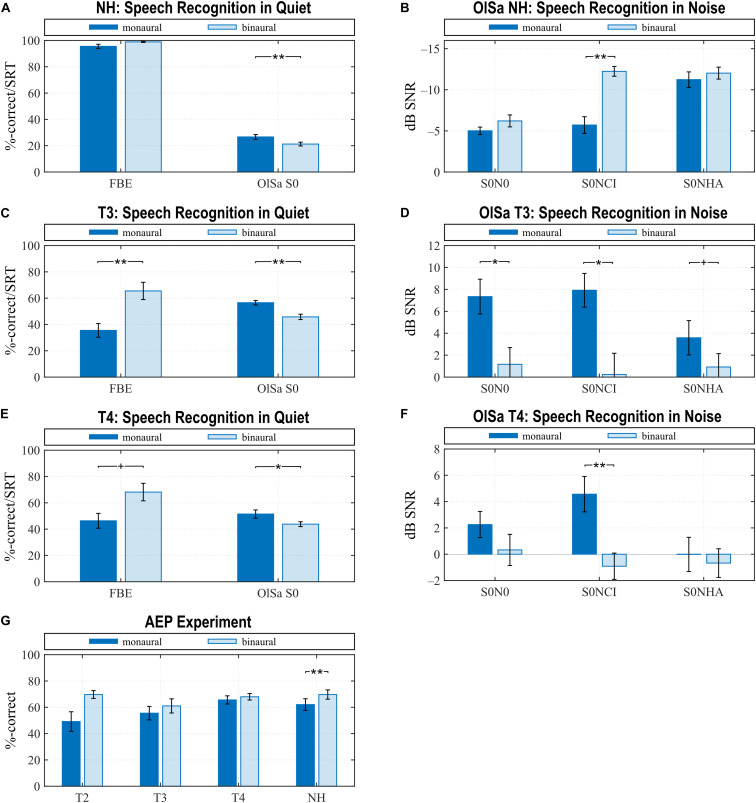
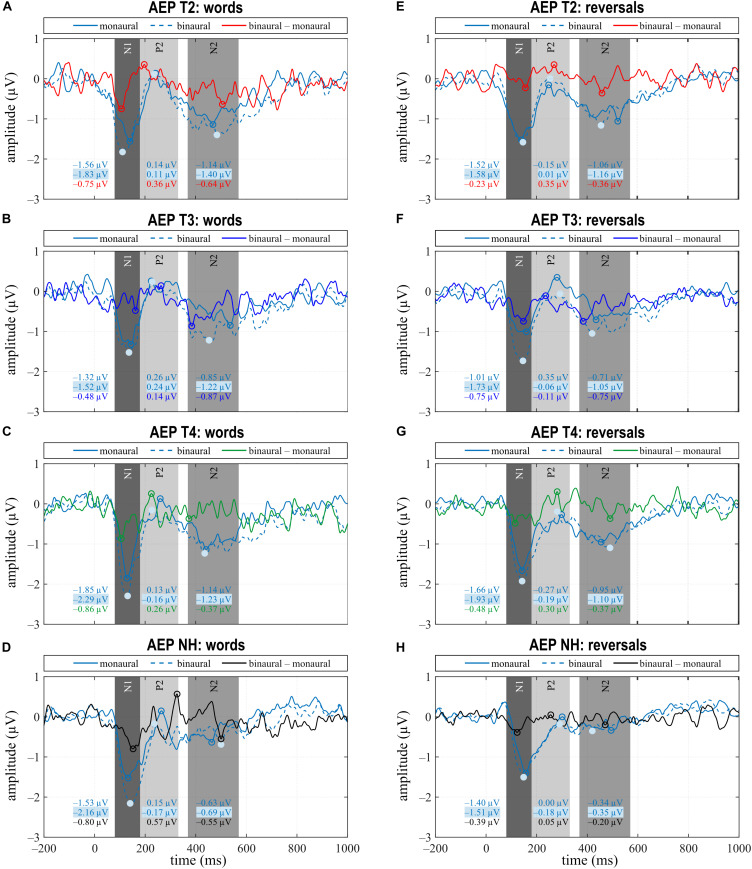
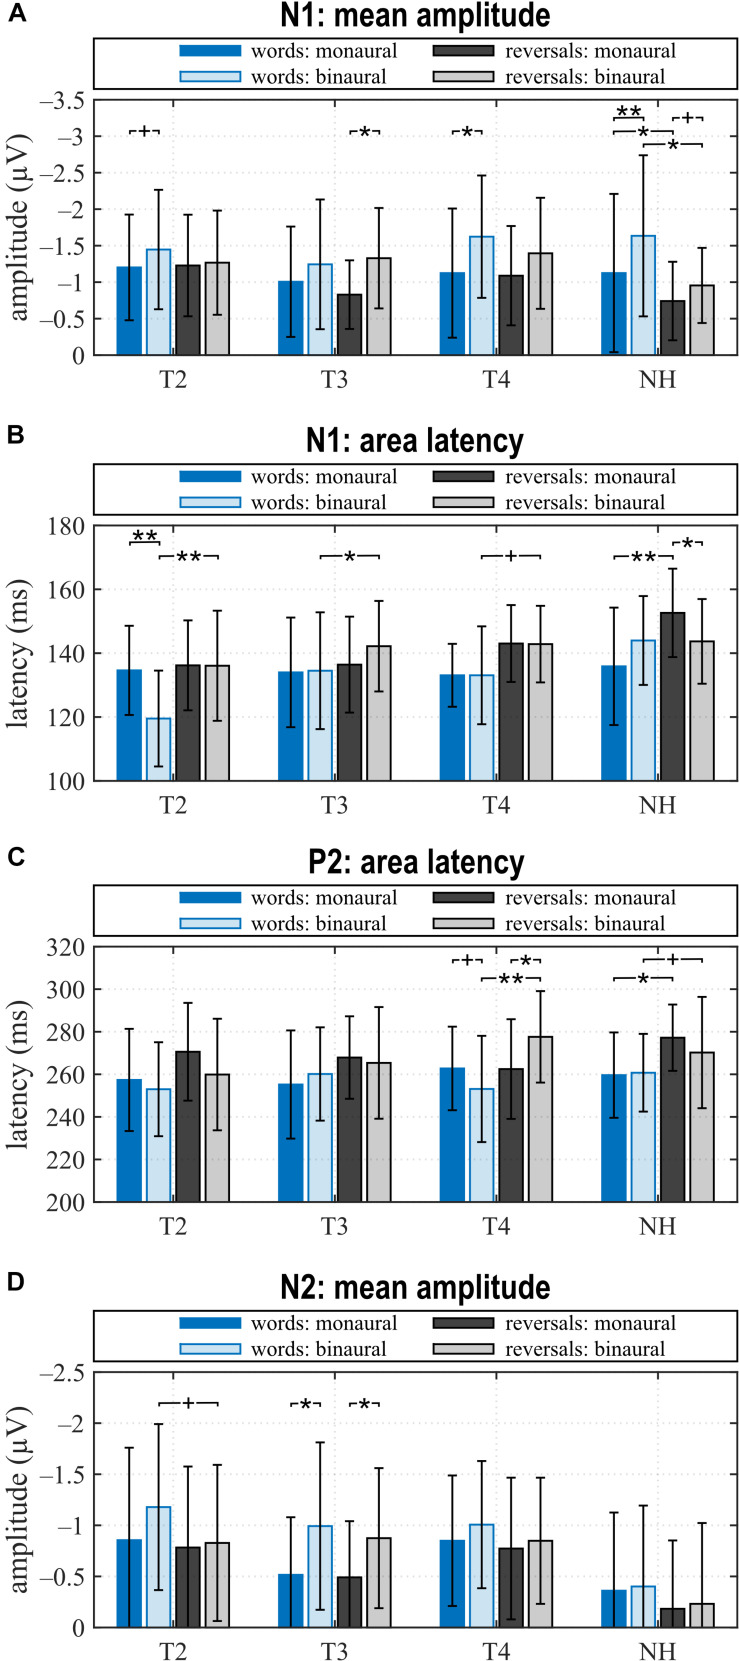
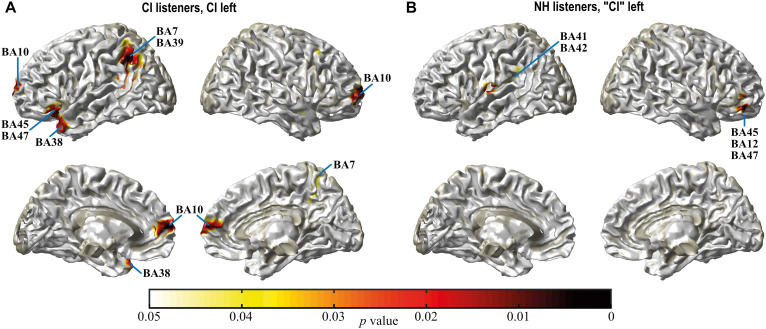
Cochlear implants (CI) improve hearing for the severely hearing impaired. With an extension of implantation candidacy, today many CI listeners use a hearing aid on their contralateral ear, referred to as bimodal listening. It is uncertain, however, whether the brains of bimodal listeners can combine the electrical and acoustical sound information and how much CI experience is needed to achieve an improved performance with bimodal listening. Patients with bilateral sensorineural hearing loss undergoing implant surgery were tested in their ability to understand speech in quiet and in noise, before and again 3 and 6 months after provision of a CI. Results of these bimodal listeners were compared to age-matched, normal hearing controls (NH). The benefit of adding a contralateral hearing aid was calculated in terms of head shadow, binaural summation, binaural squelch, and spatial release from masking from the results of a sentence recognition test. Beyond that, bimodal benefit was estimated from the difference in amplitudes and latencies of the N1, P2, and N2 potentials of the brains' auditory evoked response (AEP) toward speech. Data of fifteen participants contributed to the results. CI provision resulted in significant improvement of speech recognition with the CI ear, and in taking advantage of the head shadow effect for understanding speech in noise. Some amount of binaural processing was suggested by a positive binaural summation effect 6 month post-implantation that correlated significantly with symmetry of pure tone thresholds. Moreover, a significant negative correlation existed between binaural summation and latency of the P2 potential. With CI experience, morphology of the N1 and P2 potentials in the AEP response approximated that of NH, whereas, N2 remained different. Significant AEP differences between monaural and binaural processing were shown for NH and for bimodal listeners 6 month post-implantation. Although the grand-averaged difference in N1 amplitude between monaural and binaural listening was similar for NH and the bimodal group, source localization showed group-dependent differences in auditory and speech-relevant cortex, suggesting different processing in the bimodal listeners.
Keywords: auditory evoked potentials; auditory rehabilitation; bimodal benefit; cochlear implant; electroencephalography; hearing aid; source localization; speech recognition.
Copyright © 2020 Balkenhol, Wallhäusser-Franke, Rotter and Servais.
Conflict of interest statement
The authors declare that this study was partly funded by Advanced Bionics, Staefa, Switzerland. Advanced Bionics AG manufactures the device under investigation in this study. The funder was not involved in the study design, collection, analysis, interpretation of data, the writing of this article or the decision to submit it for publication.
Figures
Similar articles
-
Benefits of bilateral electrical stimulation with the nucleus cochlear implant in adults: 6-month postoperative results.Otol Neurotol. 2004 Nov;25(6):958-68. doi: 10.1097/00129492-200411000-00016. Otol Neurotol. 2004. PMID: 15547426 Clinical Trial.
-
Advantages of binaural hearing provided through bimodal stimulation via a cochlear implant and a conventional hearing aid: a 6-month comparative study.Acta Otolaryngol. 2005 Jun;125(6):596-606. doi: 10.1080/00016480510027493. Acta Otolaryngol. 2005. PMID: 16076708 Clinical Trial.
-
Availability of binaural cues for bilateral implant recipients and bimodal listeners with and without preserved hearing in the implanted ear.Audiol Neurootol. 2014;19(1):57-71. doi: 10.1159/000355700. Epub 2013 Dec 19. Audiol Neurootol. 2014. PMID: 24356514 Free PMC article.
-
Bimodal Hearing in Individuals with Severe-to-Profound Hearing Loss: Benefits, Challenges, and Management.Semin Hear. 2018 Nov;39(4):405-413. doi: 10.1055/s-0038-1670706. Epub 2018 Oct 26. Semin Hear. 2018. PMID: 30374211 Free PMC article. Review.
-
Binaural squelch and head shadow effects in children with unilateral cochlear implants and contralateral hearing aids.Acta Otorhinolaryngol Ital. 2015 Oct;35(5):343-9. doi: 10.14639/0392-100X-497. Acta Otorhinolaryngol Ital. 2015. PMID: 26824917 Free PMC article. Review.
Cited by
-
Mythbusters! The Truth about Common Misconceptions in Cochlear Implantation.Semin Hear. 2021 Dec 9;42(4):352-364. doi: 10.1055/s-0041-1739368. eCollection 2021 Nov. Semin Hear. 2021. PMID: 34912163 Free PMC article. Review.
-
Evaluation of Replacement Hearing Aids in Cochlear Implant Candidates Using the Hearing in Noise Test (HINT) and Pupillometry.Audiol Res. 2025 Jan 28;15(1):13. doi: 10.3390/audiolres15010013. Audiol Res. 2025. PMID: 39997157 Free PMC article.
-
Selective attention decoding in bimodal cochlear implant users.Front Neurosci. 2023 Jan 11;16:1057605. doi: 10.3389/fnins.2022.1057605. eCollection 2022. Front Neurosci. 2023. PMID: 36711138 Free PMC article.
-
Considerations for Fitting Cochlear Implants Bimodally and to the Single-Sided Deaf.Trends Hear. 2022 Jan-Dec;26:23312165221108259. doi: 10.1177/23312165221108259. Trends Hear. 2022. PMID: 35726211 Free PMC article. Review.
-
Cortical mechanisms of across-ear speech integration investigated using functional near-infrared spectroscopy (fNIRS).PLoS One. 2024 Sep 18;19(9):e0307158. doi: 10.1371/journal.pone.0307158. eCollection 2024. PLoS One. 2024. PMID: 39292701 Free PMC article.
References
LinkOut - more resources
Full Text Sources