. 2020 Dec 14:8:592967.
doi: 10.3389/fcell.2020.592967. eCollection 2020.

Chemical-Induced Cleft Palate Is Caused and Rescued by Pharmacological Modulation of the Canonical Wnt Signaling Pathway in a Zebrafish Model

Affiliations

Chemical-Induced Cleft Palate Is Caused and Rescued by Pharmacological Modulation of the Canonical Wnt Signaling Pathway in a Zebrafish Model

Rika Narumi et al. Front Cell Dev Biol. .

Abstract

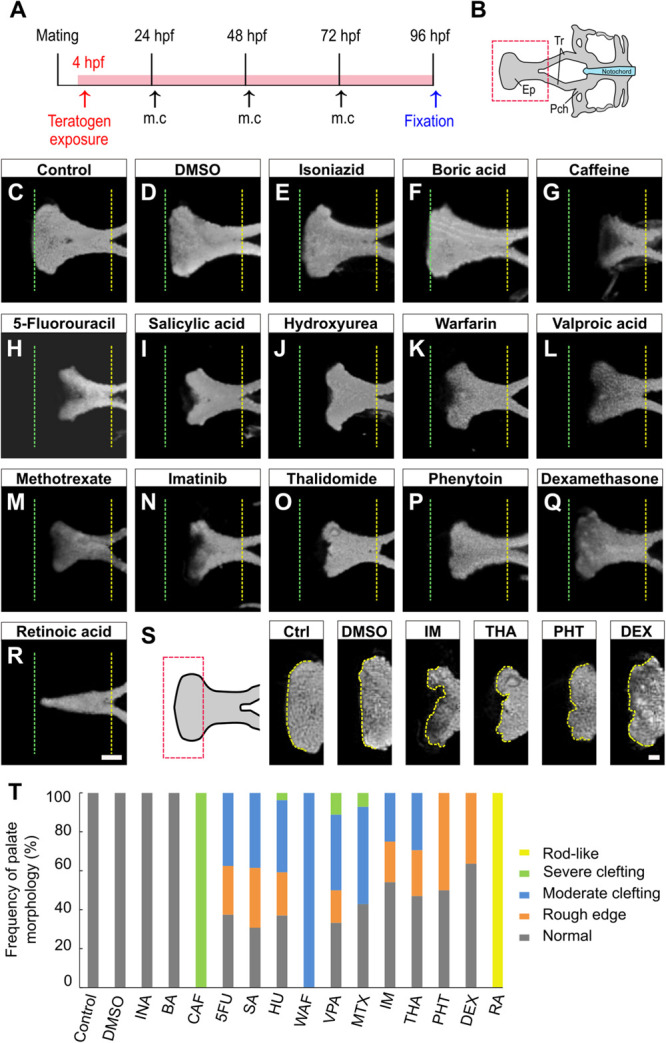
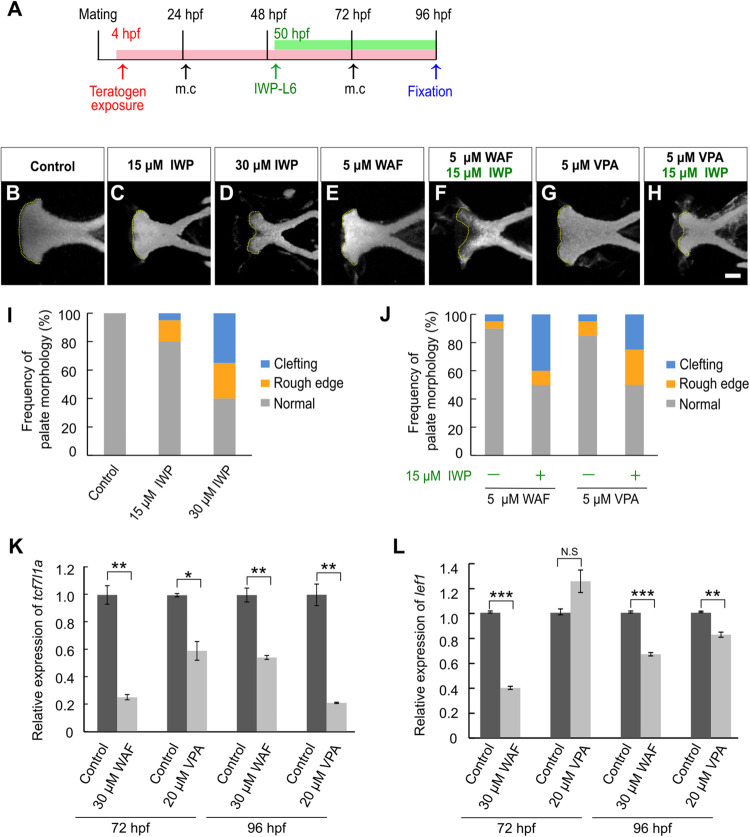
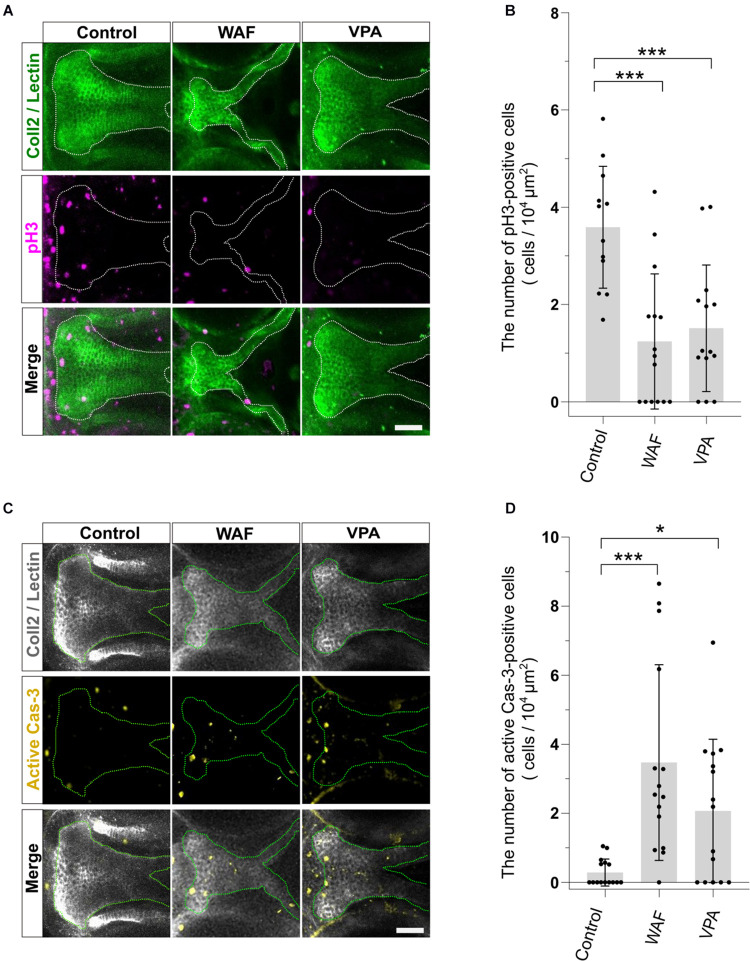
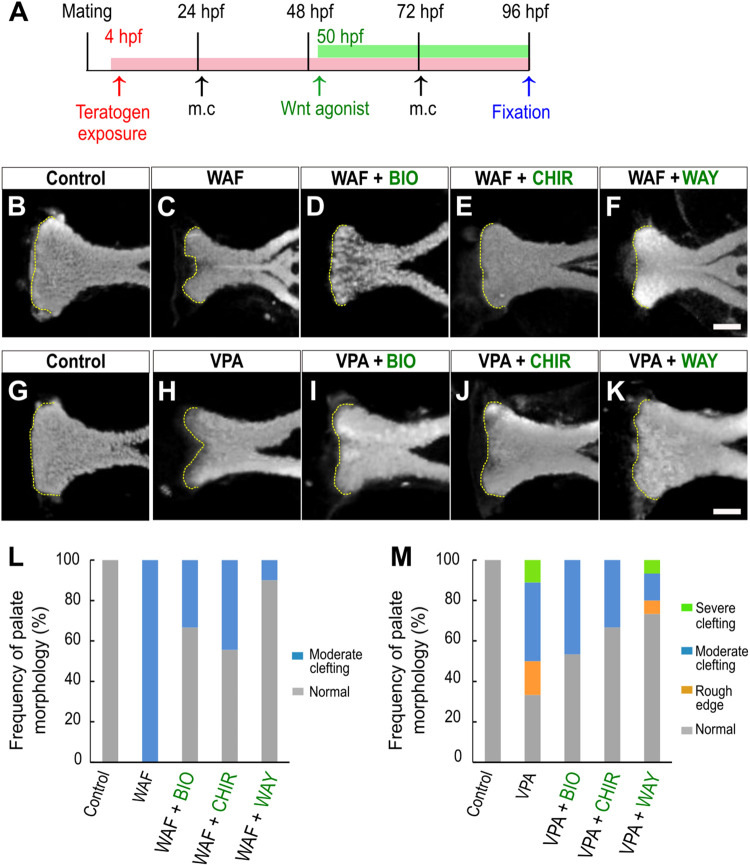
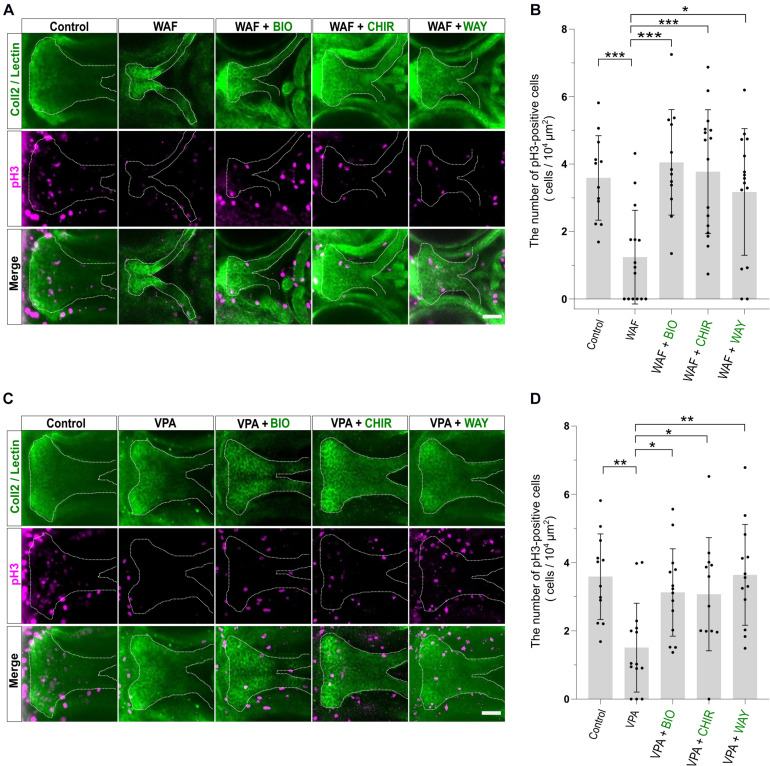
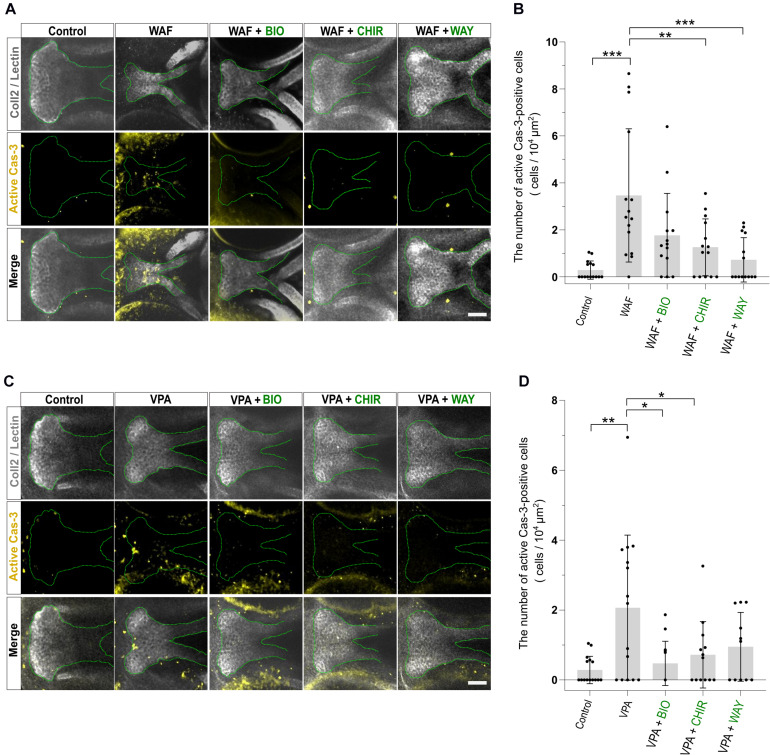
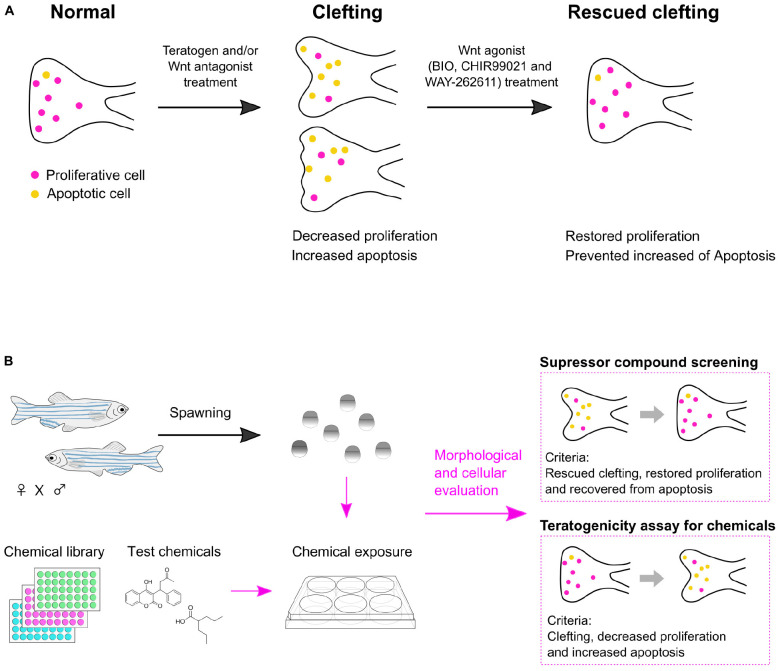
Cleft palate is one of the most frequent birth defects worldwide. It causes severe problems regarding eating and speaking and requires long-term treatment. Effective prenatal treatment would contribute to reducing the risk of cleft palate. The canonical Wnt signaling pathway is critically involved in palatogenesis, and genetic or chemical disturbance of this signaling pathway leads to cleft palate. Presently, preventative treatment for cleft palate during prenatal development has limited efficacy, but we expect that zebrafish will provide a useful high-throughput chemical screening model for effective prevention. To achieve this, the zebrafish model should recapitulate cleft palate development and its rescue by chemical modulation of the Wnt pathway. Here, we provide proof of concept for a zebrafish chemical screening model. Zebrafish embryos were treated with 12 chemical reagents known to induce cleft palate in mammals, and all 12 chemicals induced cleft palate characterized by decreased proliferation and increased apoptosis of palatal cells. The cleft phenotype was enhanced by combinatorial treatment with Wnt inhibitor and teratogens. Furthermore, the expression of tcf7 and lef1 as a readout of the pathway was decreased. Conversely, cleft palate was prevented by Wnt agonist and the cellular defects were also prevented. In conclusion, we provide evidence that chemical-induced cleft palate is caused by inhibition of the canonical Wnt pathway. Our results indicate that this zebrafish model is promising for chemical screening for prevention of cleft palate as well as modulation of the Wnt pathway as a therapeutic target.

Keywords: canonical Wnt signaling pathway; cleft palate; environmental factors; teratogen; zebrafish.


Conflict of interest statement

All authors are employed by the company Kao Corporation.

Figures

FIGURE 1
FIGURE 1
Morphological phenotype of chemical-induced cleft palate in zebrafish embryos. (A) Experimental time course m.c.: medium change. (B) Atlas of the neurocranial cartilage. Ep, Ethmoid plate; Tr, Trabecula; Pch, Parachordal. (C–R) Fluorescence images of the ethmoid palate (zebrafish palate) at 96 hpf. Nuclei of cartilage cells were stained with DAPI. The anterior and posterior edges of the palate are indicated by green and yellow dotted lines, respectively. Exposure concentration was as follows: DMSO as vehicle control (0.1%), isoniazid (INA, 1 mM), boric acid (BA, 1 mM), caffeine (CAF, 1 mM), 5-fluorouracil (5FU, 1 mM), salicylic acid, (SA, 200 μM), hydroxyurea (HU, 1 mM), warfarin (WAF, 30 μM), valproic acid (VPA, 15 μM), methotrexate (MTX, 200 μM), imatinib (IM, 250 μM), thalidomide (THA, 400 μM), phenytoin (PHT, 1 mM), dexamethasone (DEX, 1 mM), and retinoic acid (RA, 10 nM). (S) Highly magnified images of the anterior edge of the palate. Ctrl, control; IM, imatinib; THA, thalidomide; PHT, phenytoin; DEX, dexamethasone. Yellow dotted line traces the shape of anterior edge. (T) Frequency of palate morphology. n = 19 (Control), 18 (DMSO), 11 (INA), 14 (BA), 17 (CAF), 8 (5FU), 16 (SA), 27 (HU), 11 (WAF), 18 (VPA), 14 (MTX), 24 (IM), 17 (THA), 10 (PHT), 22 (DEX), 16 (RA). Scale bars: 50 μm in (C–R), 20 μm in (S).
FIGURE 2
FIGURE 2
Chemical-induced cleft palate was induced by inhibition of the canonical Wnt signaling pathway. (A) Experimental time-course. m.c.: medium change. (B–H) Fluorescence images of the palate at 96 hpf. Nuclei of cartilage cells were stained with DAPI. Yellow dotted line indicates the anterior edge of the palate. (I,J) Frequency of palate morphology. n = 20 for each sample. (K,L) Quantification of relative levels of tcf7l1a (K) and lef1 (L) mRNA isolated from the neurocranium at 72 and 96 hpf. Each mRNA level was normalized by gapdh mRNA by the comparative CT (2– ΔΔCT) method. Data are shown as mean ± SD from triplicate experiments. *P < 0.05, **P < 0.01, ***P < 0.001 (two-tailed Welch’s t-tests). Scale bar: 50 μm.
FIGURE 3
FIGURE 3
The pattern of proliferation and apoptosis in the cleft palate induced by teratogens. (A) Immunofluorescence images of proliferative cells in the palate at 96 hpf. Embryos were treated with WAF (30 μM) or VPA (20 μM) and stained with anti-coll2 antibody, lectin PNA and anti-phospho-histone H3 (pH3) antibody. Green indicates cartilage cells double stained with anti-coll2 antibody and lectin PNA. White dotted lines trace the shape of the palate. Magenta indicates proliferative cells stained with anti-pH3 antibody. (B) The number of pH3-positive cells in the palate. Numerical value is normalized by 104 μm2. n = 12 (Control), 15 (WAF), 14 (VPA), ***P < 0.001 (one-way ANOVA followed by Dunnett’s multiple comparison test). (C) Immunofluorescence images of apoptotic cells in the palate at 96 hpf. Embryos were treated with WAF (30 μM) or VPA (20 μM) and stained with anti-coll2, lectin PNA anti-active caspase 3 (active Cas-3) antibody. White indicates cartilage cells double stained with anti-coll2 antibody and lectin PNA. Green dotted lines trace the shape of ethmoid plate. Yellow indicates apoptotic cells stained with anti-caspase3 antibody. (D) The number of active caspase3-positive cells in the palate. Numerical value was normalized to 104 μm2. n = 15 (Control), 15 (WAF), 15 (VPA), *P < 0.05, ***P < 0.001 (one-way ANOVA followed by Dunnett’s multiple comparison test). Scale bars: 50 μm.
FIGURE 4
FIGURE 4
Restoration of chemical-induced cleft palate by Wnt agonists. (A) Experimental time course. m.c.: medium change. (B–K) Fluorescence images of the palate at 96 hpf. (B,C) WAF (30 μM) exposure induced cleft palate. (D–F) The cleft palate was rescued by combinatorial treatment with BIO (100 nM), CHIR99021 (300 nM) or WAY-262611 (250 nM). (G,H) VPA (20 μM) exposure induced cleft palate. (I–K) The cleft palate caused by VPA was rescued by combinatorial treatment with BIO (100 nM), CHIR99021 (300 nM) or WAY-262611 (250 nM). White indicates nuclei stained with DAPI. Yellow dotted lines trace the shape of the anterior edge of the plate. (L,M) Frequency of rescued cleft palate. n = 18 (Control), 11 (WAF), 12 (WAF + BIO), 9 (WAF + CHIR), 10 (WAF + WAY) in (L), n = 19 (Control), 18 (VPA), 15 (VPA + BIO), 18 (VPA + CHIR),15 (VPA + WAY) in (M). Scale bar: 50 μm.
FIGURE 5
FIGURE 5
Cell proliferation in the palate was restored by combinatorial treatment with the teratogen and Wnt agonists. (A) Immunofluorescence images of proliferative cells of the plate at 96 hpf. Experimental time course is the same as in Figure 4A. WAF (30 μM) exposure induced cleft palate and decreased the number of pH3-positive cells in the palate. The number of pH3-positive cells was restored by combinatorial treatment with BIO (100 nM), CHIR99021 (300 nM) or WAY-262611 (250 nM). Green indicates cartilage cells double stained with anti-coll2 antibody and lectin PNA. White dotted lines trace the shape of the palate. Magenta indicates proliferative cells stained with anti-pH3 antibody. (B) Quantification of the number of pH3-positive cells in the palate. Numerical value was normalized to 104 μm2. (C) VPA (20 μM) exposure induced cleft palate and the number of pH3-positive cells was decreased. The number of pH3-positive cells was restored by combinatorial treatment with BIO (100 nM), CHIR99021 (300 nM) or WAY-262611 (250 nM). (D) Quantification of the number of pH3-positive cells in the palate. Numerical value was normalized to 104 μm2. n = 12 (Control), 15 (WAF), 12 (WAF + BIO), 16 (WAF + CHIR), 15 (WAF + WAY) in (B), n = 12 (Control), 14 (VPA), 14 (VPA + BIO), 12 (VPA + CHIR), 13 (VPA + WAY) in (D), *P < 0.05, **P < 0.01, ***P < 0.001 (one-way ANOVA followed by Dunnett’s multiple comparison test). Scale bar: 50 μm.
FIGURE 6
FIGURE 6
Apoptosis level was restored by combinatorial treatment with teratogen and Wnt agonists. (A) Immunofluorescence images of apoptotic cells in the palate at 96 hpf. Experimental time course is the same as in Figure 4A. WAF (30 μM) exposure induced cleft palate and increased the number of active Cas3-positive cells in the palate. The number of active Cas3-positive cells was restored to normal by combinatorial treatment with BIO (100 nM), CHIR99021 (300 nM) or WAY-262611 (250 nM). White indicates cartilage cells double stained with anti-coll2 antibody and lectin PNA. Green dotted lines trace the shape of the palate. Yellow indicates apoptotic cells stained with anti-caspase3 antibody. (B) Quantification of the number of active Cas3-positive cells in the palate. Numerical value is normalized to 104 μm2. (C) VPA (20 μM) exposure induced cleft palate and increased the number of active Cas3-positive cells. The number of active Cas3-positive cells was restored to normal by combinatorial treatment with BIO (100 nM), CHIR99021 (300 nM) or WAY-262611 (250 nM). (D) Quantification of the number of active Cas3-positive cells in the palate. Numerical value is normalized to 104 μm2. n = 15 (Control), 15 (WAF), 14 (WAF + BIO), 14 (WAF + CHIR), 14 (WAF + WAY) in (B), n = 15 (Control), 15 (VPA), 14 (VPA + BIO), 13 (VPA + CHIR), 11 (VPA + WAY) in (D), *P < 0.05, **P < 0.01, ***P < 0.001 (one-way ANOVA followed by Dunnett’s multiple comparison test). Scale bar, 50 μm.
FIGURE 7
FIGURE 7
Summary of chemical-induced cleft palate. (A) Teratogen induces cleft palate by inhibition of the canonical Wnt signaling pathway. This defect is characterized by decreased proliferation and increased apoptosis in the zebrafish palate. Chemical-induced cleft palate is prevented by Wnt agonist treatment. (B) Application of a zebrafish model for suppressor screening as well as teratogenicity assay for chemicals.

Similar articles

Cited by

References

    1. Beaty T. H., Marazita M. L., Leslie E. J. (2016). Genetic factors influencing risk to orofacial clefts: today’s challenges and tomorrow’s opportunities. F1000Res 5:2800. 10.12688/f1000research.9503.1 - DOI - PMC - PubMed
    1. Benke P. J. (1984). The isotretinoin teratogen syndrome. JAMA 251 3267–3269. 10.1001/jama.251.24.3267 - DOI - PubMed
    1. Billington C. J., Jr., Schmidt B., Marcucio R. S., Hallgrimsson B., Gopalakrishnan R., et al. (2015). Impact of retinoic acid exposure on midfacial shape variation and manifestation of holoprosencephaly in Twsg1 mutant mice. Dis. Model. Mech. 8 139–146. 10.1242/dmm.018275 - DOI - PMC - PubMed
    1. Boulet S. L., Grosse S. D., Honein M. A., Correa-Villasenor A. (2009). Children with orofacial clefts: health-care use and costs among a privately insured population. Public Health Rep. 124 447–453. 10.1177/003335490912400315 - DOI - PMC - PubMed
    1. Brent R. L. (2004). Environmental causes of human congenital malformations: the pediatrician’s role in dealing with these complex clinical problems caused by a multiplicity of environmental and genetic factors. Pediatrics 113 957–968. - PubMed

LinkOut - more resources