. 2020 Dec 10:2020:3193725.
doi: 10.1155/2020/3193725. eCollection 2020.

Coadministration of Ketamine and Perampanel Improves Behavioral Function and Reduces Inflammation in Acute Traumatic Brain Injury Mouse Model

Affiliations

Coadministration of Ketamine and Perampanel Improves Behavioral Function and Reduces Inflammation in Acute Traumatic Brain Injury Mouse Model

Faleh Alqahtani et al. Biomed Res Int. .

Abstract

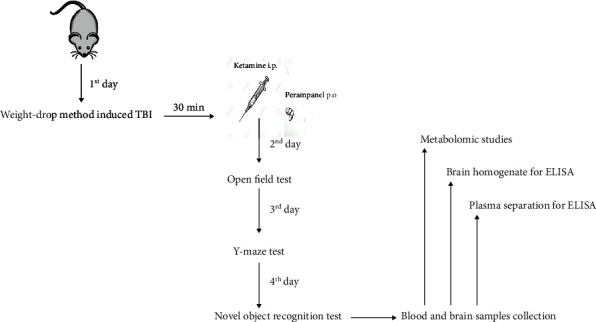
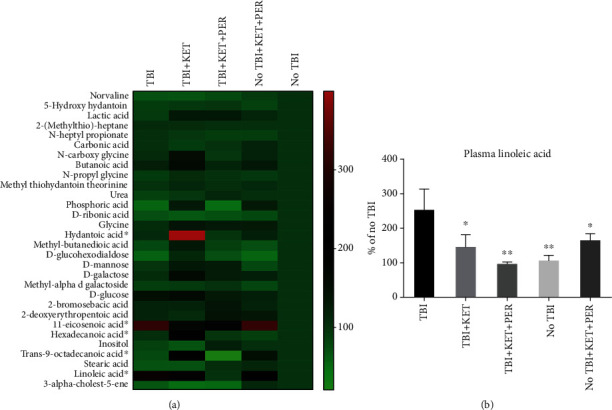
Traumatic brain injury (TBI) is among the most debilitating neurological disorders with inadequate therapeutic options. It affects all age groups globally leading to post-TBI behavioral challenges and life-long disabilities requiring interventions for these health issues. In the current study, C57BL/6J mice were induced with TBI through the weight-drop method, and outcomes of acutely administered ketamine alone and in combination with perampanel were observed. The impact of test drugs was evaluated for post-TBI behavioral changes by employing the open field test (OFT), Y-maze test, and novel object recognition test (NOR). After that, isolated plasma and brain homogenates were analyzed for inflammatory modulators, i.e., NF-κB and iNOS, through ELISA. Moreover, metabolomic studies were carried out to further authenticate the TBI rescuing potential of drugs. The animals treated with ketamine-perampanel combination demonstrated improved exploratory behavior in OFT (P < 0.05), while ketamine alone as well as in combination yielded anxiolytic effect (P < 0.05-0.001) in posttraumatic mice. Similarly, the % spontaneous alternation and % discrimination index were increased after the administration of ketamine alone (P < 0.05) and ketamine-perampanel combination (P < 0.01-0.001) in the Y-maze test and NOR test, respectively. ELISA demonstrated the reduced central and peripheral expression of NF-κB (P < 0.05) and iNOS (P < 0.01-0.0001) after ketamine-perampanel polypharmacy. The TBI-imparted alteration in plasma metabolites was restored by drug combination as evidenced by metabolomic studies. The outcomes were fruitful with ketamine, but the combination therapy proved more significant in improving all studied parameters. The benefits of this new investigated polypharmacy might be due to their antiglutamatergic, antioxidant, and neuroprotective capacity.


Conflict of interest statement

The authors declare that they have no conflict of interests.

Figures

Figure 1
Figure 1
Experimental design depicting day-wise behavioral studies with subsequent in vitro analysis.
Figure 2
Figure 2
Comparison of total distance traveled (a), time spent in peripheral zone (b), time spent in central zone (c), and tracings of general exploratory behavior (d) among different groups in the open field test. ∗∗P < 0.01 and ∗∗∗∗P < 0.0001 show comparisons b/w TBI mice with healthy ones receiving vehicle only. #P < 0.05, ##P < 0.01, and ####P < 0.0001 show comparisons b/w TBI mice with healthy ones exposed to ketamine-perampanel combination. aP < 0.05 shows comparison b/w TBI mice with the TBI mice treated with ketamine only. bP < 0.05 and bbbbP < 0.0001 show comparisons b/w TBI mice with TBI mice treated with ketamine-perampanel combination. All data are expressed as the mean ± SD (n = 8/9 animals per group).
Figure 3
Figure 3
Comparison of % spontaneous alternation behavior among different groups in the Y-maze test. ∗∗∗∗P < 0.0001 shows comparisons b/w TBI mice with healthy ones receiving vehicle only. ####P < 0.0001 shows comparisons b/w TBI mice with healthy ones exposed to ketamine-perampanel combination, aP < 0.05 shows comparison b/w TBI mice with the TBI mice treated with ketamine only. bbP < 0.01 shows comparisons b/w TBI mice with TBI mice treated with ketamine-perampanel combination. All data are expressed as the mean ± SD (n = 8/9 animals per group).
Figure 4
Figure 4
Comparison of % discrimination index among different groups in the novel object recognition test. ∗∗∗P < 0.001 shows comparisons b/w TBI mice with healthy ones receiving vehicle only. #P < 0.05 shows comparisons b/w TBI mice with healthy ones exposed to ketamine-perampanel. aP < 0.05 shows comparison b/w TBI mice with the TBI mice treated with ketamine only. bP < 0.05 shows comparisons b/w TBI mice with TBI mice treated with ketamine-perampanel combination. All data are expressed as the mean ± SD (n = 8/9 animals per group).
Figure 5
Figure 5
Comparison of plasma levels of NF-κB (a) and iNOS (b) among differently treated groups through ELISA. ∗∗P < 0.01 and ∗∗∗∗P < 0.0001 show comparisons b/w TBI mice with healthy ones receiving vehicle only. ##P < 0.01 and ####P < 0.0001 show comparisons b/w TBI mice with healthy ones exposed to ketamine-perampanel. aP < 0.05 and aaaaP < 0.0001 show comparison b/w TBI mice with the TBI mice treated with ketamine only. bP < 0.05 and bbbbP < 0.0001 show comparisons b/w TBI mice with TBI mice treated with ketamine-perampanel combination. All data are expressed as the mean ± SD (n = 3 animals per group).
Figure 6
Figure 6
Evaluation of concentration of NF-κB (a) and iNOS (b) in the brains of differently treated groups after traumatic brain injury. P < 0.05 and ∗∗∗∗P < 0.0001 show comparisons b/w TBI mice with healthy ones receiving vehicle only. #P < 0.05 and ###P < 0.001 show comparisons b/w TBI mice with healthy ones exposed to ketamine-perampanel. aP < 0.05 and aaP < 0.01 show comparison b/w TBI mice with the TBI mice treated with ketamine only. bP < 0.05 and bbP < 0.01 show comparisons b/w TBI mice with TBI mice treated with ketamine-perampanel combination. All data are expressed as the mean ± SD (n = 3 animals per group).
Figure 7
Figure 7
Plasma metabolomic analysis. A heat map shows thirty identified plasma metabolites (a) and differences in plasma concentrations of linoleic acid (b). The statistically significant changed metabolites were labeled bold on the heat map (a). All data are expressed as the mean ± SEM (n = 3‐4). Outcomes of all groups were compared with the No TBI group which is assumed 100%, and comparative statistical significance P < 0.05 was compared with the TBI group. Two-way ANOVA analysis of normalized values (as percentage of the No TBI group). P < 0.05 and ∗∗P < 0.01 (Supplementary Raw Data).

References

    1. Jean-Louis É. Traumatic brain injury. L'Aide-Soignante. 2016;30(173):31–32. doi: 10.1016/j.aidsoi.2015.11.009. - DOI
    1. Centers for Disease Control and Prevention. TBI: Get the Facts Concussion Traumatic Brain Injury CDC Injury Center. U.S. Department of Health & Human Services; 2019. https://www.cdc.gov/traumaticbraininjury/get_the_facts.html.
    1. Dewan M. C., Rattani A., Gupta S., et al. Estimating the global incidence of traumatic brain injury. Journal of Neurosurgery. 2019;130(4):1080–1097. doi: 10.3171/2017.10.JNS17352. - DOI - PubMed
    1. GBD 2016 Traumatic Brain Injury and Spinal Cord Injury Collaborators. Global, regional, and national burden of traumatic brain injury and spinal cord injury, 1990–2016: a systematic analysis for the Global Burden of Disease Study 2016. The Lancet Neurology. 2019;18(1):56–87. doi: 10.1016/S1474-4422(18)30415-0. - DOI - PMC - PubMed
    1. Dawish H., Mahmood A., Schallert T., Chopp M., Therrien B. Mild traumatic brain injury (MTBI) leads to spatial learning deficits. Brain Injury. 2012;26(2):151–165. doi: 10.3109/02699052.2011.635362. - DOI - PMC - PubMed

MeSH terms